


Detailed market information is essential for efficient price discovery. Fed dairy steer and heifer purchase information is collected by the United States Department of Agriculture (USDA), Agricultural Marketing Service (AMS) from qualifying packers under Livestock Mandatory Reporting (LMR). Fed dairy steers and heifers comprise an important component of the U.S. fed cattle market with annual sales typically exceeding $3 billion, representing approximately 10% of overall annual fed steer and heifer sales (U.S. Department of Agriculture, 2021a). Fed dairy cattle have become more prevalent as the U.S. dairy cow herd grew from about 9.1 million in 2010 to 9.4 million in 2023. In contrast, the beef cow herd declined by about 2 million head over this time (U.S. Department of Agriculture, National Agricultural Statistics Service, 2011, 2023).
The majority of fed dairy steers and heifers are purchased by packers using forward contracts or formula trade. A challenge in summarizing and reporting prices for these categories of trade, in contrast to cash negotiated trade, is net prices vary more because often these types of transactions also include grids that pay premiums or discounts for quality and other traits (U.S. Department of Agriculture, 2021b). During 2021, the average weekly net price range for forward contract purchases was $55/cwt dressed weight (30% of the average price) and $35/cwt (20% of the average) for formula trade.Footnote 1 The wide range in reported weekly fed dairy cattle prices is similar to variation observed in reported fed beef steer and heifer formula prices (Schroeder et al., Reference Schroeder, Coffey and Tonsor2022). In this study, we seek to determine how well we can explain factors contributing to the large reported price ranges and provide a framework for more informative price reporting.
The purpose of this study is to determine how current data collected and used by AMS for fed dairy cattle market reporting explains price variation across transactions. Further, we assess ways price reporting might be enhanced for fed dairy cattle using hedonic models estimated weekly and specified using data currently collected under LMR. Finally, we recommend additional data collection which could potentially be used to develop more accurate weekly hedonic models and provide improved market information. The information gleaned from this study will be useful for enhancing market reporting to provide more precise information regarding fed dairy cattle prices. The goal is to increase market transparency by providing more detailed information about factors contributing to variation in prices across transactions. More detailed information describing price variation across transactions improves the value of public market reports because it facilitates more informed price discovery and provides clearer signals to adjust production and marketing decisions.
Background
Fed dairy steers and heifers not retained for replacements in the milk cow herd are reared to weaning on calf ranches (Walker et al. Reference Walker, Epperson, Wittum, Lord, Rajala-Schultz and Lakritz2012). After weaning, they are either backgrounded on low-energy roughage diets before going to a feedlot or directly placed on high-energy diets in feedlots. Upon finishing in feedlots, fed dairy cattle are sold to beef packers. Fed dairy cattle are generally considered close substitutes for fed beef steers and heifers. Buhr (Reference Buhr1996) found correlations of 0.93–0.94 for weekly South St. Paul terminal auction market prices for fed Holstein and beef steers. He concluded fed Holstein steers could be effectively cross-hedged or forward contracted using fixed basis contracts with the CME live cattle futures contract.
However, fed dairy cattle are not perfect substitutes for fed beef cattle. Fed dairy cattle tend to have lower dressing percentage and meat yield than beef cattle (Duff and McMurphy, Reference Duff and McMurphy2007). Fed dairy cattle also more consistently achieve higher quality grades and have larger numeric yield grades than beef cattle (McKenna et al. Reference McKenna, Roberts, Bates, Schmidt, Hale, Griffin, Savell, Brooks, Morgan, Montgomery, Belk and Smith2002). Fed dairy cattle have lower-valued muscle conformation with smaller and elongated ribeyes (Cauffman and Sterry, Reference Cauffman and Sterry2019) and higher incidence of liver abscesses (Amachawadi and Nagaraja, Reference Amachawadi and Nagaraja2016), resulting in liver condemnation at slaughter. Fed dairy steers and heifers are commonly fed in regions where beef cattle feeding is not as prevalent such as Arizona, California, Minnesota, and Ohio, though they are also fed in key beef cattle feeding states of Texas, Kansas, and Iowa.
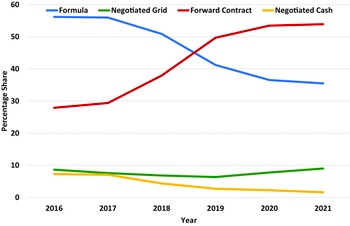
Past studies analyzing fed dairy cattle prices have often used either auction market prices (e.g., Buhr, Reference Buhr1996) or negotiated cash prices (e.g., McKendree et al. Reference McKendree, Saitone and Schaefer2020). Pudenz and Schulz (Reference Pudenz and Schulz2021) conducted analyses of fed dairy cattle basis comparing Iowa auction prices as well as formula net, negotiated grid net, and forward contract net prices from the Iowa-Minnesota region with CME live cattle futures. Packers predominantly use forward contracts (53%) and formula agreements (35%) to procure fed dairy steers and heifers (Fig. 1). In contrast, negotiated grid purchases represent about 10% and negotiated cash represent under 2% of fed dairy cattle purchases. Forward contracting has rapidly become the most common way to procure fed dairy cattle. This differs from beef cattle trade where forward contracting is typically less than 10% of trade and formula purchases exceed 60% (Schroeder et al. Reference Schroeder, Coffey, Tonsor, Fischer, Outlaw and Anderson2021). Thus, the fed dairy cattle market notably differs from the fed beef cattle market and, as we discuss further later, more attention to forward contract purchases in fed dairy cattle may be warranted in USDA market data collection and market reports.
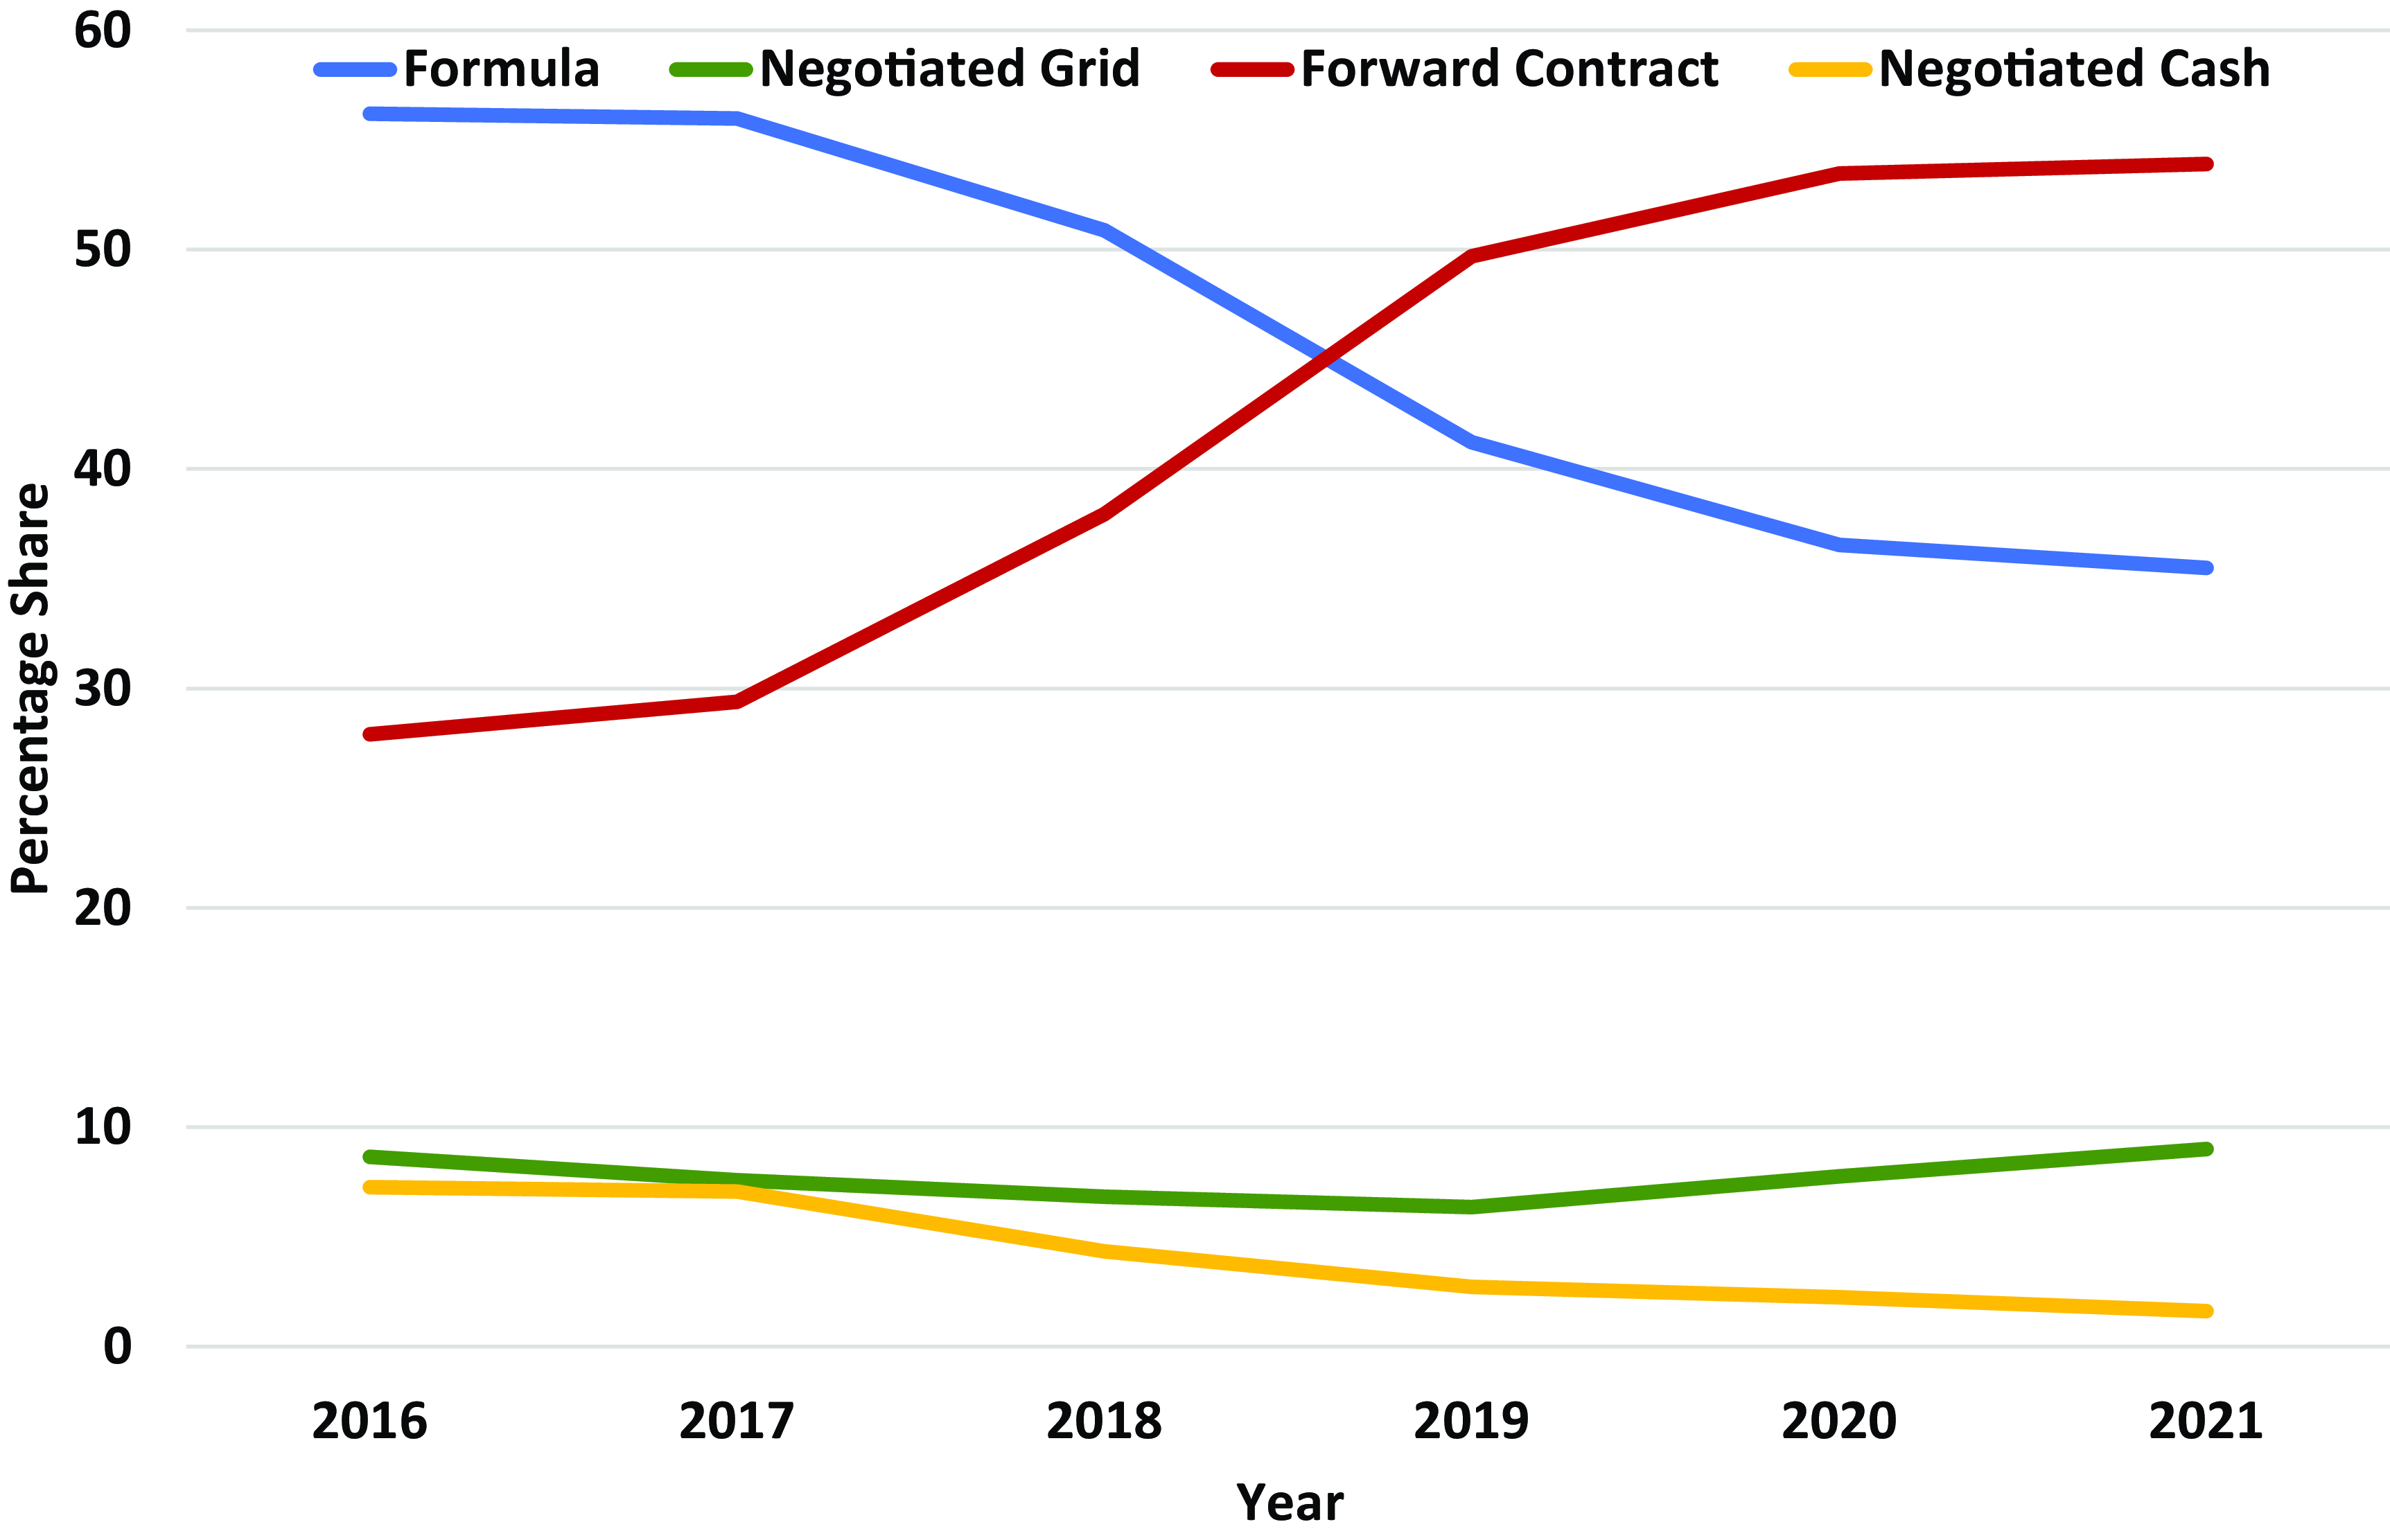
Figure 1. Shares of purchase type methods, fed dairy steers, and heifers, annual 2016–October 2021. (Source: USDA, AMS (2021a)).
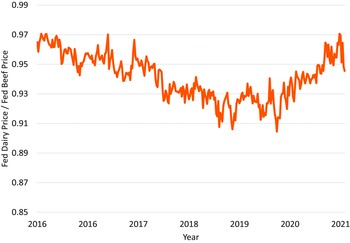
Fed dairy cattle generally receive discounted prices relative to beef steers and heifers. Figure 2 summarizes the ratio of weekly weighted-average net prices paid for formula purchased fed dairy relative to fed beef steers and heifers from January 2016 to October 2021. Especially noteworthy is the decline in the ratio going from about 97% of beef in 2016 to about 91% by 2018 and then back up again to about 95% in 2021. This is consistent with structural breaks in negotiated cash fed dairy cattle prices (McKendree et al. Reference McKendree, Saitone and Schaefer2020) and in fed dairy cattle basis analysis including formula trade and forward contracts (Pudenz and Schulz, Reference Pudenz and Schulz2021) in 2016 following Tyson discontinuing Holstein slaughter at its Joslin, IL plant.
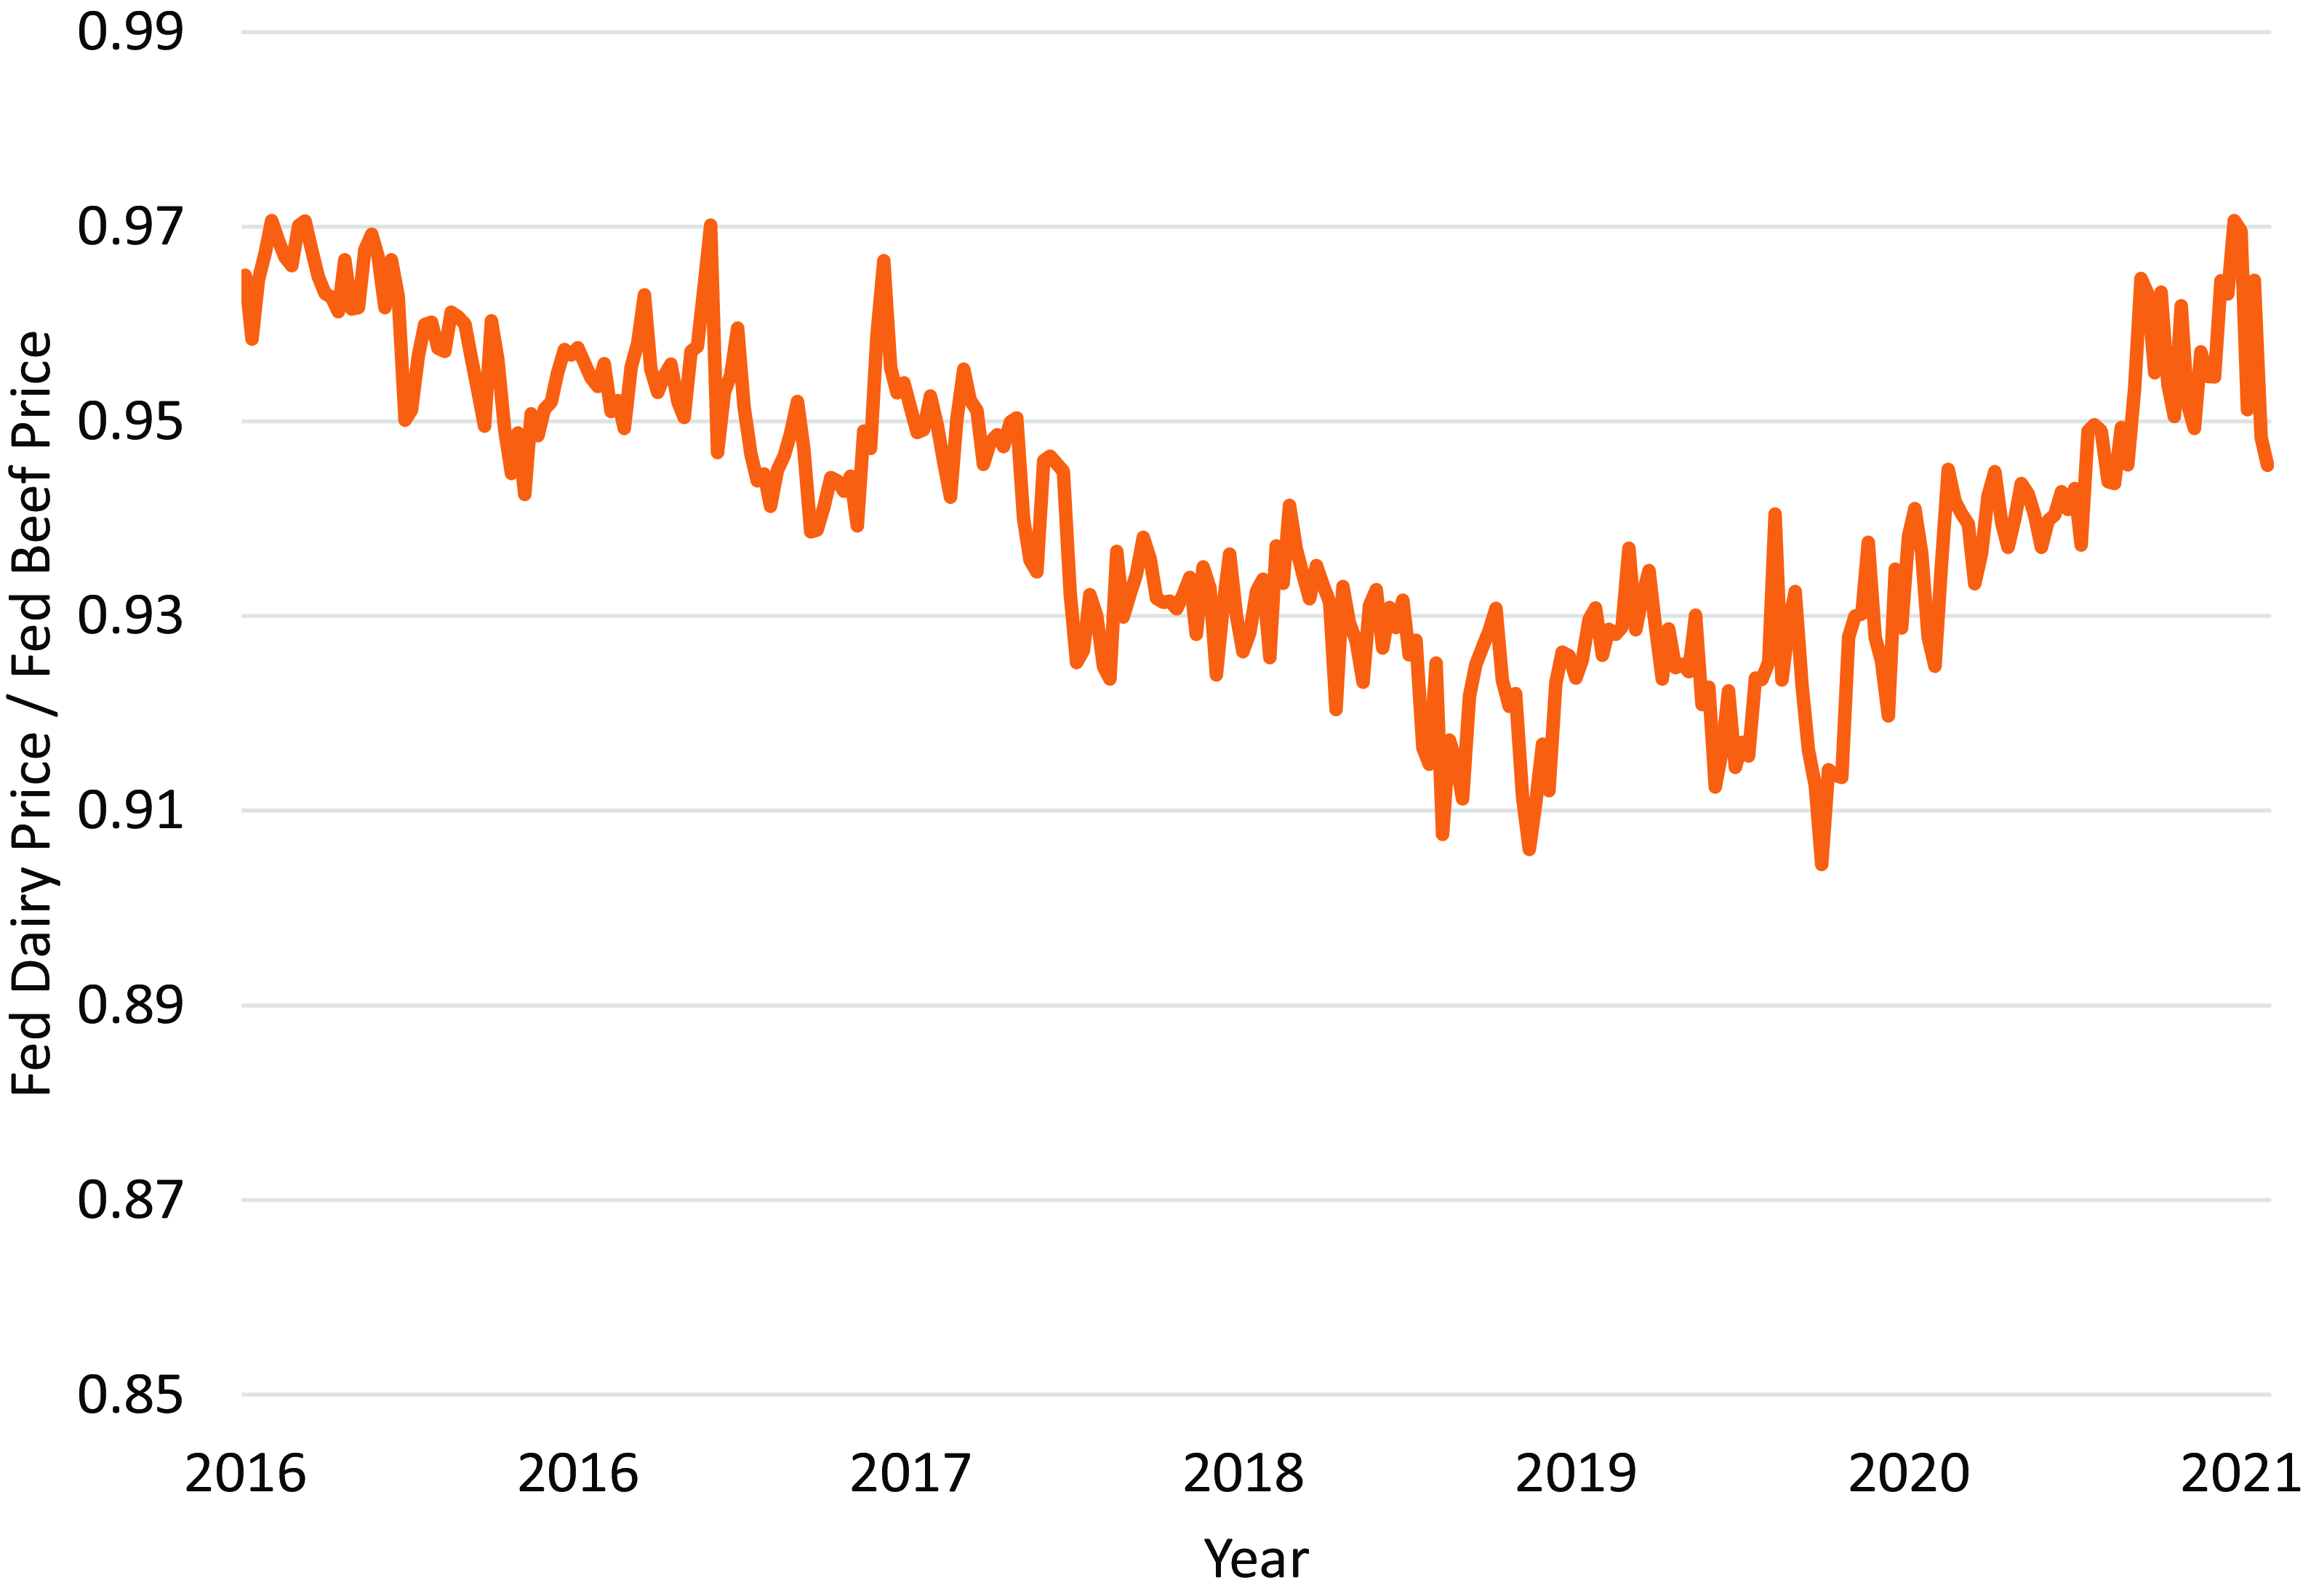
Figure 2. Net formula fed dairy relative to fed beef steer and heifer weighted-average weekly dressed price, weekly 2016–October 2021. (Source: USDA, AMS (2021a)).
Another important change occurring in the dairy sector is breeding genetically inferior dairy cows to beef sires to produce beef-dairy cross steers and heifers (Fairbarin and Felix, Reference Fairbarin and Felix2020). This practice, combined with using increasingly reliable and affordable sexed dairy semen to obtain dairy heifer calves (Pereira et al. Reference Pereira, Bruno, Marcondes and Ferreira2022), has increased rapidly over the past few years (Geiger, Reference Geiger2019). Discussions we have had with cattle feeders indicate beef-dairy cross steers are increasing in prevalence because they perform similarly to beef cattle in feeding efficiency and have a higher value than straight dairy fed cattle when finished. However, AMS does not currently identify beef-dairy cross cattle separately in LMR purchase data collected from packers but only offers binary categories of beef or dairy. Therefore, purchases of beef-dairy cross animals may be reported in either dairy or beef breed categories by packers. USDA AMS recently introduced at pilot Cattle Contracts Library (CCL) with the first report published in March 2023.Footnote 2 CCL includes separate beef and dairy categories for fed cattle. Dairy steers (heifers) are defined as “Slaughter steers (heifers) that possess dairy genetics expressed in the carcass traits” (USDA AMS, 2023, p. 10). This convention necessitates packers report beef-dairy cross cattle as either beef or dairy. The prevalence of beef-dairy cross animals may merit a third reporting category of beef-dairy cross. Given growing importance of beef-dairy cross fed cattle and anecdotal evidence of differing value relative to beef fed steers and heifers, we recommend AMS collect more specific breed information. We describe a better way to report associated market information on beef-dairy cross cattle. Regardless of the reasons, the price ratio variation observed in Fig. 2 suggests fed dairy cattle prices differ over time relative to fed beef steers and heifers justifying separate price reporting by USDA AMS.
USDA AMS reports fed dairy steer and heifer weighted-average prices separately from beef cattle. Table 1 illustrates a sample of weekly fed dairy market reporting for net forward contract and formula dressed trade in the LM_CT151 report for October 11, 2021.Footnote 3 Several aspects of these reports are noteworthy. First, the net price ranges on forward contract purchases were large with the overall range of $63.45/cwt (34% of the weighted-average net price). This is not surprising because forward contract prices for cattle reported any week were likely established at different times, meaning considerable temporal variation is embedded in reported prices in addition to other factors associated with price variation across transactions. Collecting dates on which base prices were established would enable either adjusting base prices for time before reporting or reporting in time windows associated with when base prices were established. Either of these options would improve the value of base price reporting for forward contract purchases.
Table 1. Sampling of reported fed dairy Steer and Heifer national weekly net forward contract and formula dressed price reports for October 11, 2011 (USDA AMS LM_CT151)
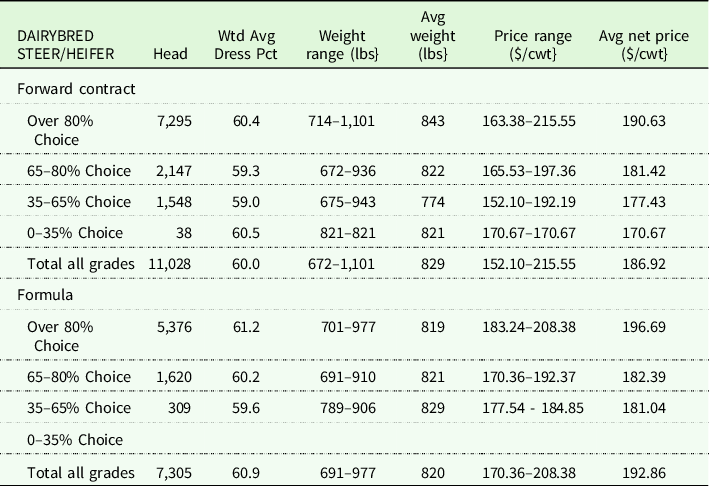
Source: USDA, AMS (2021c).
Second, price variation for formula trade is also large, though smaller than for forward contracts. The range in net price for all grades under formula purchases (Table 1) was $38.02/cwt (19% of the weighted-average net price). The percentage of Choice grade cattle categories provides a sense for typical quality grade price adjustments. For example, formula purchases over 80% Choice had a weighted-average price about $16/cwt higher than 65–80% Choice, which was just over a $1/cwt greater than 35–65% Choice category. We propose a way to report more continuous quality grade price impacts in this article.
There are important omissions in market price reporting in Table 1. For example, the report does not indicate how prices varied across yield grades, excessively light- or heavy-weight carcasses, carcasses with liver abscesses, or breed (dairy vs. beef-dairy cross). A similar issue was noted by Schroeder et al. (Reference Schroeder, Coffey and Tonsor2022) in market reports for fed beef steers and heifers. Reported price ranges may be partly explained by these or other price determinants that could help further illuminate price differences providing information useful to market participants.
Hedonic modeling to facilitate market reporting
We propose hedonic modeling, using individual transactions to enhance fed dairy steer and heifer price reporting. The modeling approach enables us to determine whether collecting additional details of animal characteristics in a transaction would enable more informed price reporting. A similar approach was used by Schroeder et al. (Reference Schroeder, Coffey and Tonsor2022) and Rogers et al. (Reference Rogers, Schroeder, Tonsor and Coffey2023) in modeling beef steer and heifer transaction prices.
We illustrate the hedonic modeling method for forward contracting and formula trade, since these by far represent the largest share of fed dairy cattle purchases (Fig. 1). Negotiated grid could potentially be combined with formula, since both types are often sold using a grid valuation method. However, base prices are determined in different ways across the two purchase methods, so combining them could add additional variation to net prices due to base price variability. Thus, we did not combine them. The same basic model can be used for both forward and formula pricing because AMS collects similar data for each purchase type. The models are constrained by data fields currently collected by USDA AMS.
Data collected by AMS on fed dairy steer and heifer purchases include purchase method (formula, forward contract, negotiated grid, or negotiated cash), pricing base (live or dressed), delivery status (Free-on-Board (FOB) from the feedlot or deliveredFootnote 4 ), state of origin, and packing plant that purchased the cattle. Also recorded are transaction date, net price paid, average weight, number of head, and overall net premiums or discounts paid for quality grade, yield grade, weight, and/or other attributes. Distributions of quality grade, yield grade, excessively light or heavy weights, or other attributes for each transaction are not collected by AMS.Footnote 5
Using available data, initial hedonic models were estimated for each week using transaction prices for each lot i on day t forward contract and formula transactions separately are specified as:
 $$\eqalign{ Pric{e_{it}} & = {\beta _0} + {\beta _1}Choic{e_{it}} + {\beta _2}LightW{t_{it}} \cr & + {\beta _3}HeavyW{t_{it}} + {\beta _4}Head{30_{it}} + {\beta _5}FO{B_{it}} + {\beta _6}Liv{e_{it}} \cr & + \mathop \sum \limits_l^{k = 1} {\beta _{6 + k}}Origi{n_{itk}} + {\gamma _1}Day{2_{it}} + {\gamma _2}Day{3_{it}} + {\gamma _3}Day{4_{it}} + {\gamma _4}Day{5_{it}} + {\varepsilon _{it}} \cr} $$
Variables included in equation (1) are defined in Table 2. The model was estimated during each week in the data set to determine its usefulness for reporting weekly market information. Given that cattle feedlots tend to schedule and market cattle on weekly time windows, weekly price reports match well with their decision frameworks. The models were also estimated including fixed purchasing packing plant effects to assess how including plant effects impact coefficient estimates of the other variables in the models. Plant coefficients would generally not be reportable due to confidentiality, and they are also correlated with cattle origin, but including them as fixed effects provides information for prevalence of price variation across plants beyond other factors included in equation (1).
Table 2. Definitions of variables used in the hedonic models
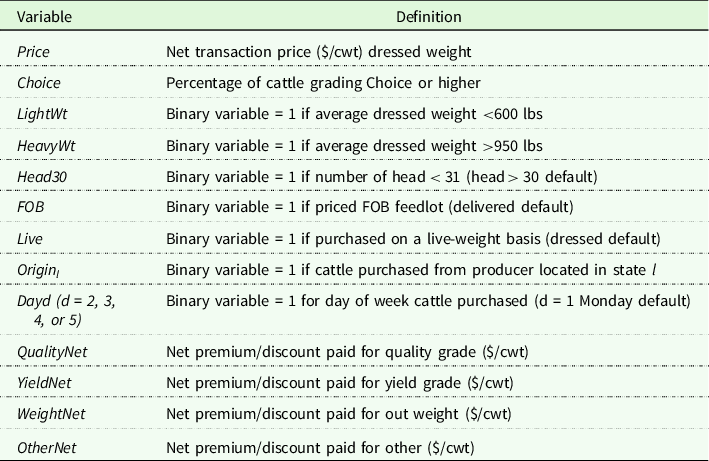
Note: The default transaction was for cattle weighing between 600 and 950 lbs; with 31 head or more; delivered to the plant; purchased on a dressed-weight basis, from originl = 1, purchased on day = 1.
The percentage of cattle grading Choice or higher (Choice) is the only quality grade indicator collected by AMS on fed dairy cattle. Just under 78% of fed dairy cattle purchased using formula pricing had some type of grid-base price adjustment. Somewhat surprisingly, 90% of forward contract purchases were associated with a grid price adjustment with quality grade associated price adjustments being the most common. We expect higher prices paid for transactions having greater percentages of cattle grading at least Choice, especially if the cattle are purchased using a quality grade grid. Light-weight or heavy-weight cattle are expected to be discounted as are smaller lot-size transactions. Cattle sold FOB from a feedlot are expected to receive a discount relative to purchases delivered to the packing plant and live purchases expected to be discounted relative to dressed weight.
A second model is estimated to assess the extent to which omitted relevant variables associated with cattle quality grade, yield grade, weight, and other characteristics affect explanatory power of the weekly models using equation (1). USDA collects net premium and discount information on each of these four categories for every transaction, but not distributions of the specific attributes present. Therefore, to assess how specific premiums and discounts affect net price variation, we estimate equation (2) including net premium/discount variables dropping Choice, LightWt, and HeavyWt variables, which would be captured in the net premium/discount variables (see Table 2 for variable definitions):
 $$\eqalign{ & Pric{e_{it}}\; = {\alpha _0} + {\alpha _1}Head{30_{it}} + {\alpha _2}FO{B_{it}} + {\alpha _3}Liv{e_{it}} + \mathop \sum \limits_l^{k = 1} {\alpha _{3 + k}}Origi{n_{itk}} + {\gamma _1}Day{2_{it}} \cr & \,\,\,\,\,\,\,\,\,\,\,\,\,\,\,\,\,\,\,\,\,\,\, + {\gamma _2}Day{3_{it}} + {\gamma _3}Day{4_{it}}\; + {\gamma _4}Day{5_{it\;}} + {\delta _1}QualityNe{t_{it}} + {\delta _2}YieldNe{t_{it}} \cr & \,\,\,\,\,\,\,\,\,\,\,\,\,\,\,\,\,\,\,\,\,\,\, + {\delta _3}WeightNe{t_{it}} + {\delta _4}OtherNe{t_{it}} + {\varepsilon _{it}} \cr} $$
Data
Fed dairy cattle purchase transactions data collected by USDA AMS under LMR from 2016 to October 22, 2021 were utilized. Transaction-level data are confidential and not publicly available, but we were granted restricted access for the purposes of this study. Transactions AMS excluded in market reports were dropped, including any having less than 11 head or more than 5,000 head. Only transactions reporting beef packers categorized as fed dairy steers and heifers from domestic origins were included in analysis. Furthermore, filters were included to remove obvious data errors and outlier transactions. As such, transactions that had dressing percentage less than 50% or greater than 70% were dropped. Transactions with live weight prices outside the range of $30/cwt to $200/cwt or dressed prices outside the range of $40/cwt to $320/cwt were excluded. Transactions with live weight outside the range of 800–2,200 lbs and dressed weight outside the range of 500–1,400 lbs. were dropped. Live prices and weights were converted to dressed equivalent prices by using the dressing percentage reported for each transaction.
A final filter was applied to the data when the hedonic models were estimated. Influential observations were identified by calculating the difference in model fit (DFFITS) when an observation was deleted for each observation in each of the two purchase method models using the most general models (equation (2)) including plant fixed effects and applying that data set to other models estimated to keep the same observation set across model specification. Transactions with DFFITS exceeding the cutoff suggested by Belsley et al. (Reference Belsley, Kuh and Welsch1980) of 2(p/n) 1/2 where p = number of parameters and n = the number of observations in each weekly model were removed and not used in the reported models.Footnote 6 For forward contract purchases, this filter removed 1.4% of the transactions and for formula trade it removed 2.6%. For our purposes of estimating weekly models to provide a way to improve market information reporting, one could debate whether removal of influential observations is warranted because they may reflect actual transactions. Our models suffer from omitted relevant variables, and as such, we cannot discern whether influential observations are due to potential data errors or model specification issues. We expect some of each could be at play in our models.
After applying filters, 62,342 formula transactions representing 5 million head and 84,543 forward contract purchases representing 4 million head were utilized in the hedonic models.Footnote 7 The average number of transactions per week was 206 (range of 63–379) for formula and 279 (range of 115–642) for forward contract purchases. Summary statistics of variables used in the hedonic models are reported in Table 3. The head-weighted average net forward contract price was $175.55/cwt with a standard deviation of $18.69/cwt, and the net formula weighted average was $179.66/cwt with a standard deviation of $17.07/cwt over the nearly 6-year period.
Table 3. Summary statistics of data used in hedonic models, 2016–October 21, 2021
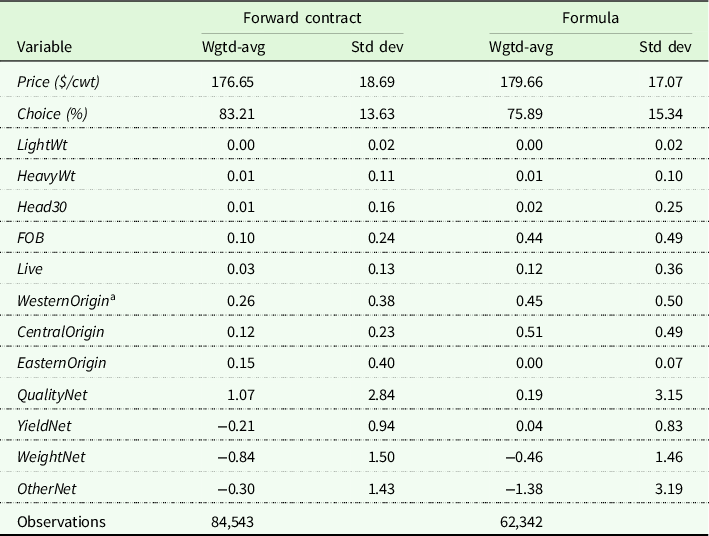
a Origin shares are reported in grouped regions as shown in Figure 3. In the models, individual states are used for each origin.
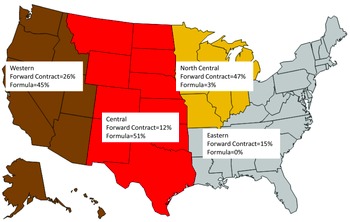
To preserve confidentiality, the states of origin cattle that were purchased from were grouped into four regions as shown in Table 3 and Fig. 3, but not in the hedonic models. States were grouped into Western, Central, North Central, and Eastern regions. Differences in how fed dairy cattle were purchased across regions are evident as 47% of forward contracted cattle originated in the North Central region which represented only 3% of formula trades. In contrast, 51% of the formula purchases originated in the traditional beef cattle feeding area of the Central region, where only 12% of forward contract purchases occurred. Popularity of formula fed dairy cattle pricing in the Central region is consistent with common use of formula pricing in this region for fed beef cattle purchases. That is, feedlots and packers located in the Central region may be more comfortable with formula trade in fed dairy cattle, since they use formulas for marketing beef cattle which represent a large majority of fed cattle in the region. In general, fed dairy cattle purchases in the Eastern region favor forward contracts and in the West formula pricing is much more prominent. This suggests if USDA used more regionally specific fed dairy price reporting, forward contract prices would be more useful in Eastern regions and formula would be more relevant in the West. This differs from regional prevalence of fed beef cattle reinforcing importance of separate reporting for fed dairy cattle.
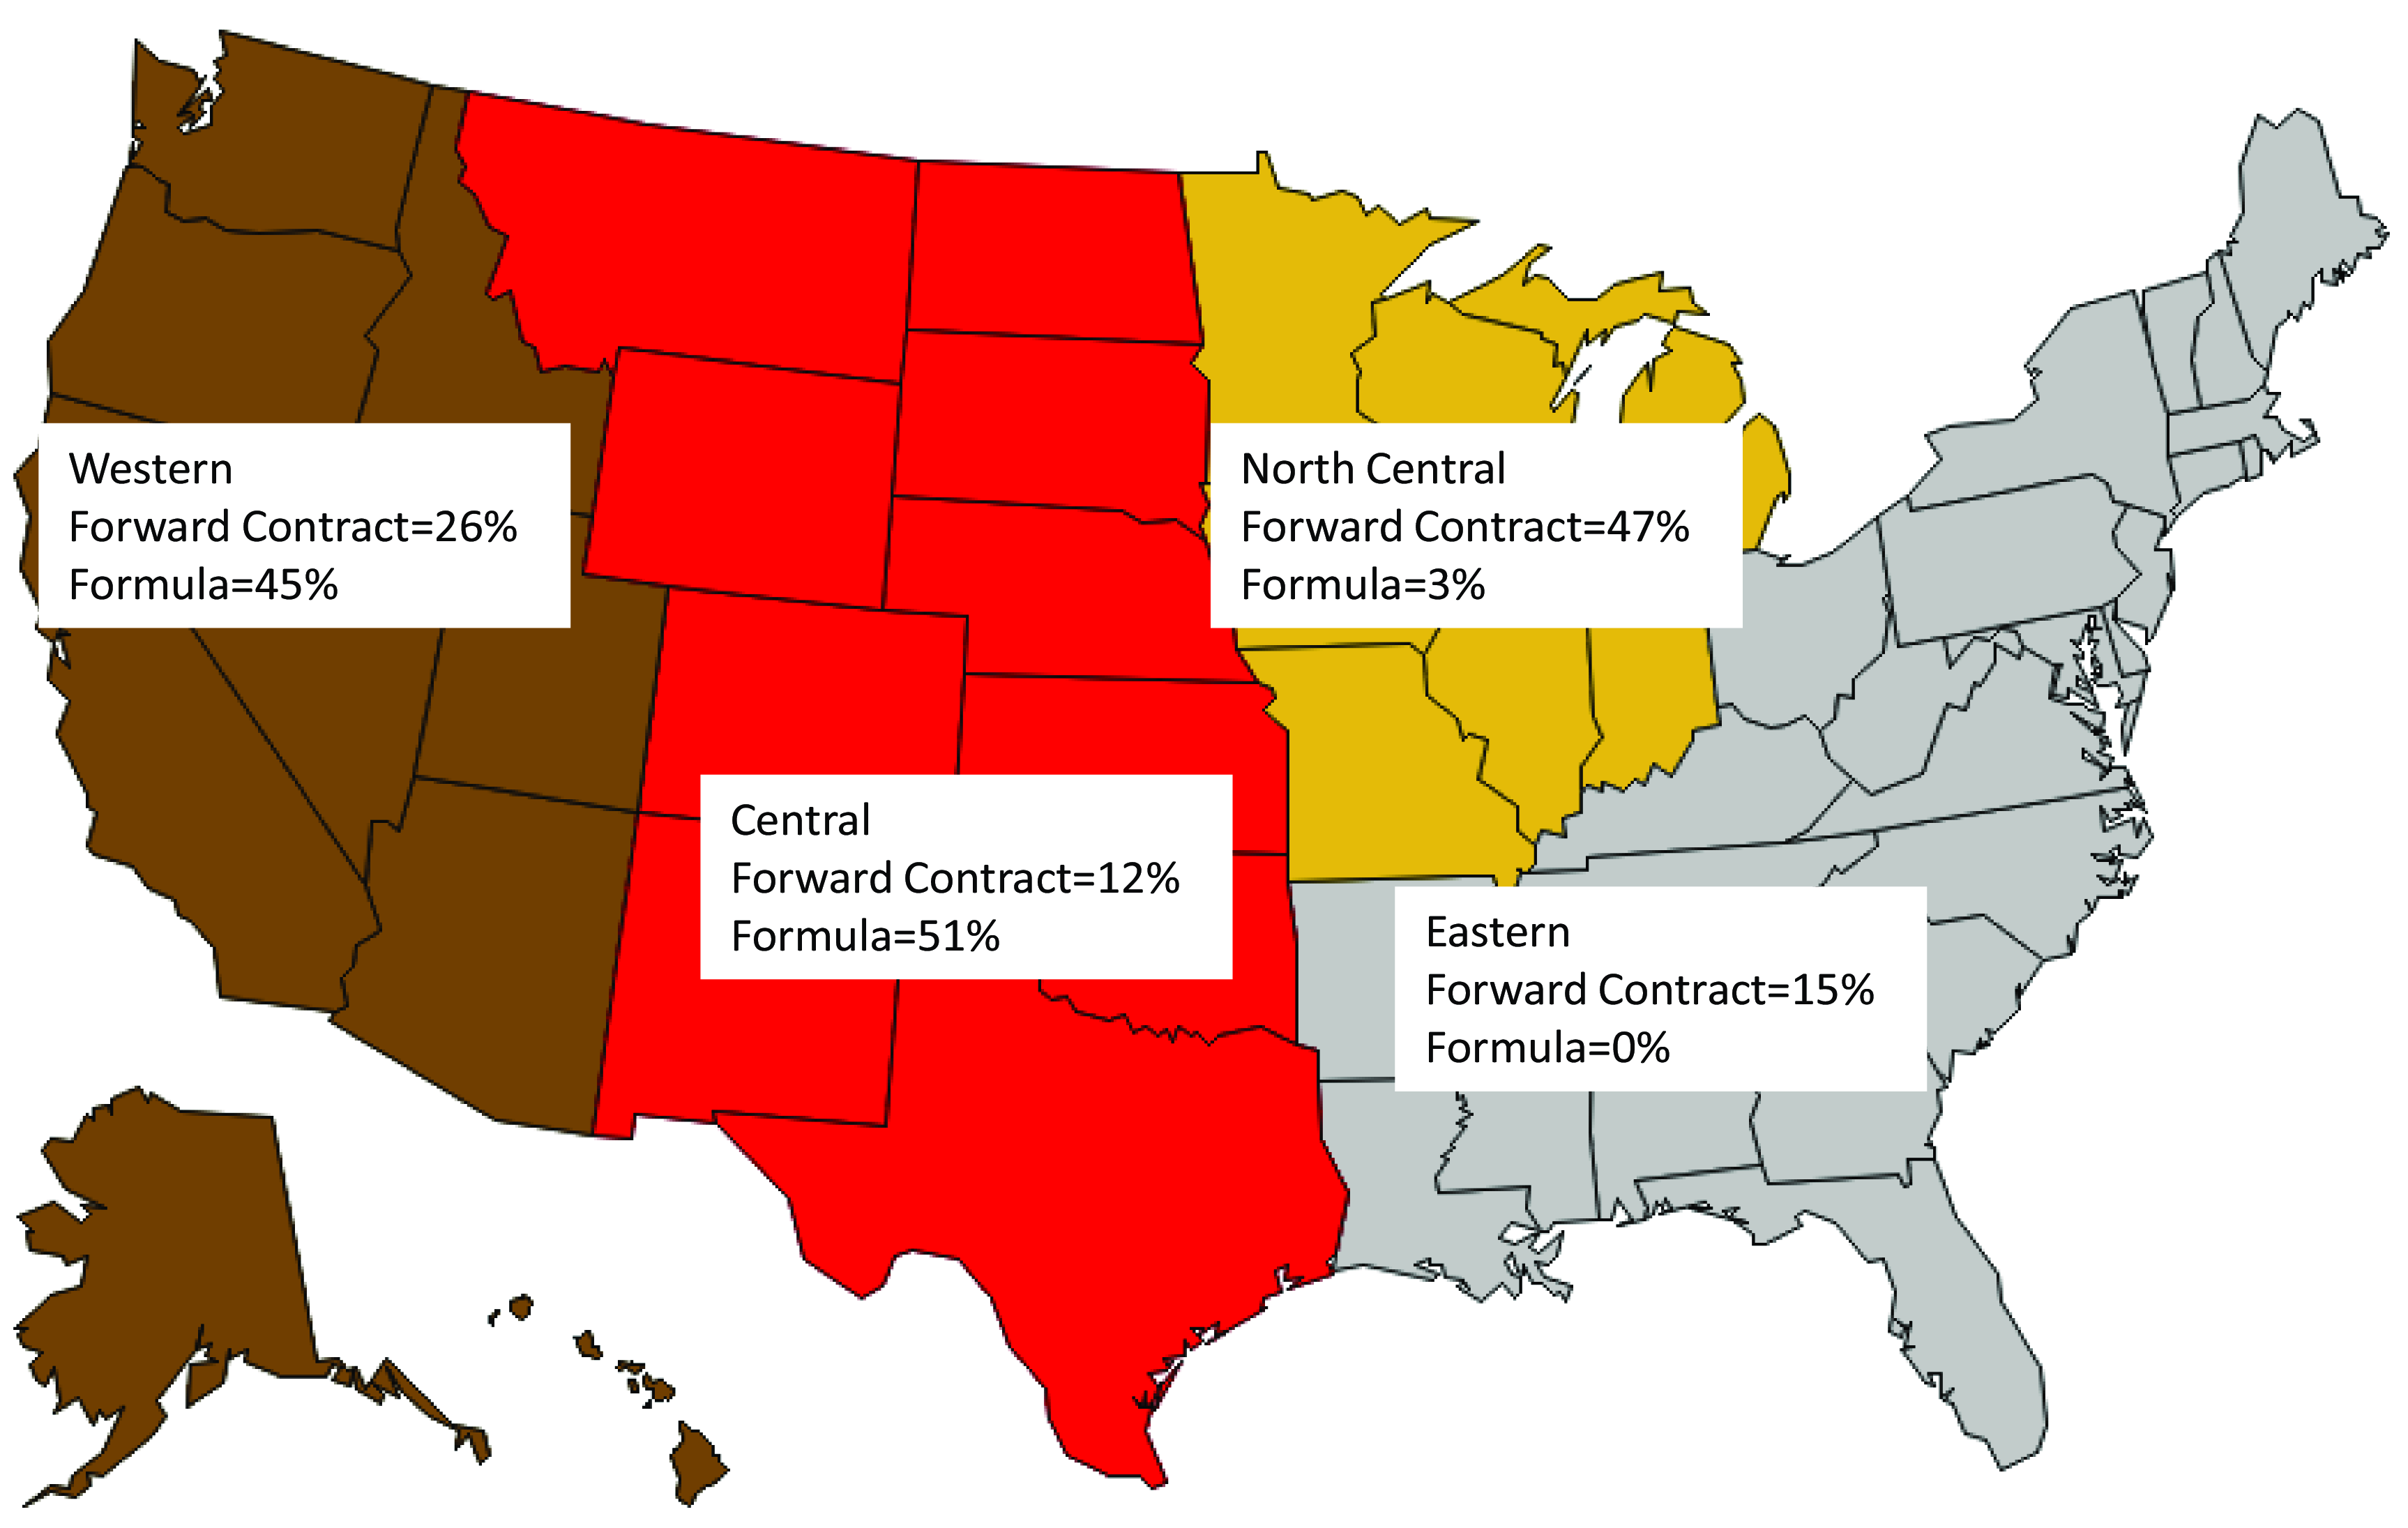
Figure 3. Transaction purchase origin regions and head-weighted shares of national forward contract and formula purchases. (Source: Data obtained from USDA, AMS (2021a), author’s calculation).
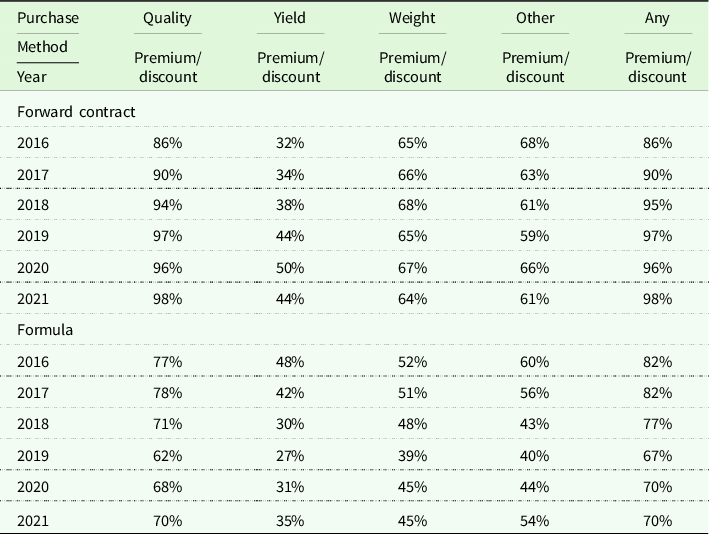
Both forward contract and formula fed dairy cattle are typically purchased with associated quality, yield, weight, or other premium/discount adjustments (Table 4). Nearly all (98%) fed dairy cattle bought using forward contracts and 70% under formula pricing had at least one premium or discount adjustment to the base price in 2021. Quality grade premiums or discounts were the most common base price adjustments for both forward contract and formula purchases. Yield grades had the least frequent premiums or discounts applied of the four categories with 50% or less of transaction prices across years and purchase methods being adjusted for yield grades. The frequency of Other price adjustments is noteworthy as generally more than 60% of forward contract and around 45% of formula purchases received premiums or discounts for Other attributes. We do not know what Other price adjustments were for making this another opportunity for data collection enhancement.
Results
Equation (1) was estimated using ordinary least squares for each of 303 weeks in the data set, mimicking how it could be used in market reporting. Each model was estimated twice with one model including, and the other excluding, purchasing packing plant fixed effects. The goodness-of-fit measures of the weekly models are summarized in Table 5. The average adjusted R-squared for the forward contract models were 0.42 when plant fixed effects were included and declined to 0.40 when plant fixed effects were excluded with similar 0.54 adjusted R-squared for formula including plant effects and declining to 0.49 when plant effects were excluded. Root mean squared errors (RMSEs) on forward contract models were relatively large averaging $9.79/cwt including plant effects and $9.89/cwt excluding plants reflecting the fact formula contract prices embed base prices established at different times. RMSEs for formula were less than 60% of that for forward contract at $4.61/cwt including plants and $4.85/cwt excluding plant effects.
Table 5. Goodness-of-fit statistics, 303 weekly hedonic models 1
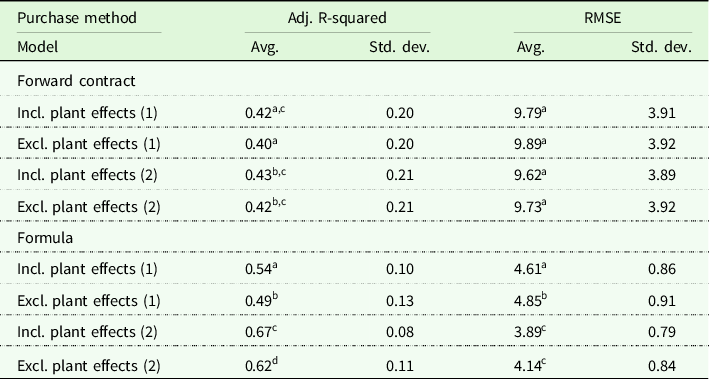
1 Within each purchase method, averages sharing the same superscript are not statistically different from each other at the 0.05 level using a Z test.
Goodness-of-fit measures for equation (2) including net premium/discount variables were similar to those for forward contracts using equation (1). This suggests knowing net premiums and discounts applied to forward contract prices is not informative in explaining differences in prices across transactions during a typical week. The implication is that using hedonic modeling effectively for forward contract market reporting likely requires collecting the date the forward contract base price is established. In this way, the hedonic model could include adjustments for when the contract was entered into using binary variables for date entered. Further, if the forward contract is a basis contract, we recommend the basis and associated futures contract month used also be included in data reported to AMS. Without adjusting price reporting for when the contract net price is set, reported forward contract prices are not particularly useful market information as typical weekly RMSE is 40% of the average price.
For formula purchases, equation (2) had better goodness-of-fit than equation (1). The adjusted R-squared increased from 0.54 for equation (1) to 0.67 for equation (2) excluding plant effects. Likewise, the RMSEs were modestly smaller for equation (2) relative to equation (1). Variation in net formula fed dairy cattle prices is associated with factors not available in the data collected by AMS. Furthermore, even if more data on quality grade, yield grade, weight distributions, and other factors were collected on forward contract and formula fed dairy cattle purchases, the ability of hedonic models to explain price variation appears limited. This is not a critique unique to hedonic modeling as the same issue persists in current weighted-average prices reported by AMS.
Forward contract and formula adjusted R-squared for equation (1) excluding fixed plant effects for the 303 weekly models are illustrated in Fig. 4. Forward contract model goodness-of-fit measures are notably worse than formula models because forward contract prices are established across a span of potentially several months. In contrast, formula prices are established over 1 to 2 weeks from the time delivery is scheduled and base price set until cattle are delivered and net price is determined. During periods with large price moves, forward contracts have notably smaller adjusted R-squared than formula models. For example, dressed fed dairy cattle prices went from $210/cwt early in 2016 down to $146/cwt by November, back up to $200/cwt by May 2017, and back down to $145/cwt in late 2017. As expected, this period of relatively high-price volatility coincides with low adjusted R-squared in Fig. 4 for the forward contract hedonic models. Because forward contract base prices are established on varying dates, a large range in forward contract net purchase prices often results in any particular reporting week. During 2018–2021, fed dairy cattle prices were more stable and correspondingly forward contract adjusted R-squared increased (except during May 2020 when markets were disrupted by Covid-19). Determining when forward contract prices are established and adjusting price reporting accordingly could enhance the information content of reported fed dairy cattle forward contract prices.
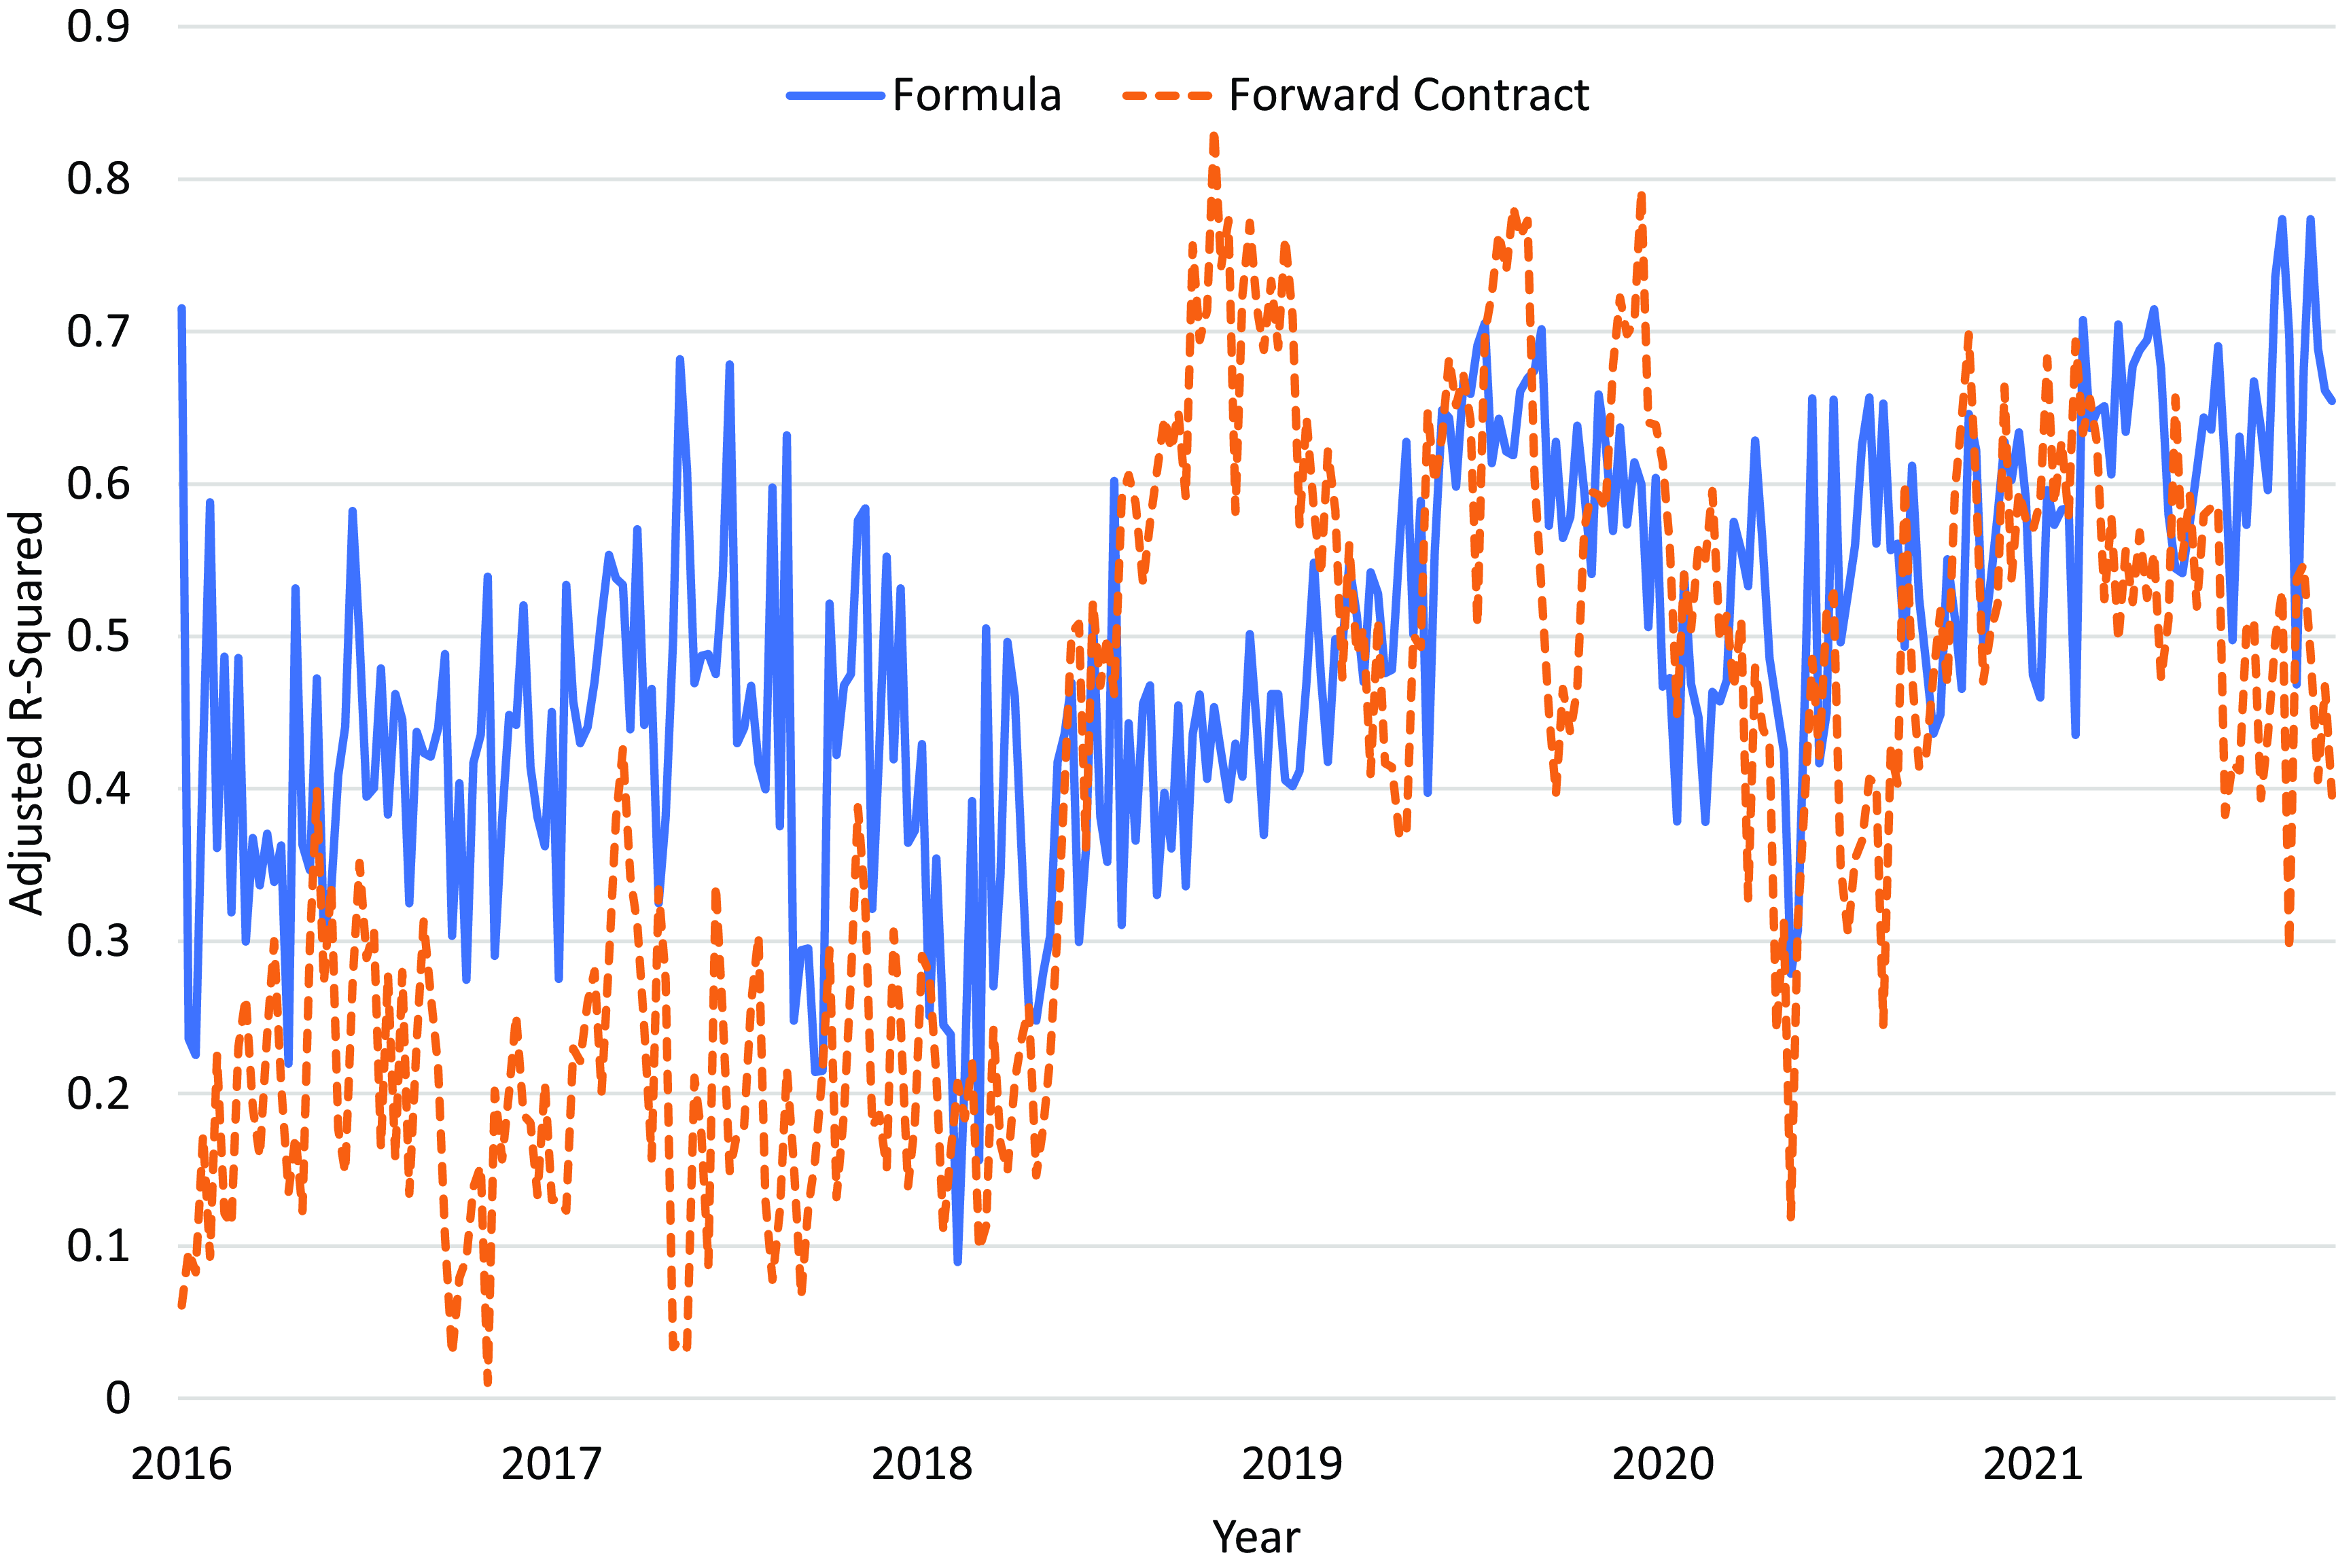
Figure 4. Weekly adjusted R-squared, forward contract and formula purchases (Equation (1), excluding plant effects), 2016–October 2021.
Upper 90th and lower 10th percentile residuals of the two models illustrated in Fig. 4 are reported in Fig. 5. The average range between the 90th and 10th percentile residuals for formula trade was $11.19/cwt. In contrast, the average range for forward contracts was more than double that at $24.59/cwt as expected given different points in time forward contract prices any given week were established. The residual ranges of the models provide a similar story to that of the adjusted R-squared. In particular, forward contract residuals had much greater ranges during times of trending fed cattle prices with $40/cwt ranges between the 90th and 10th percentile residuals common in 2016–2018. Formula trade residual ranges were relatively stable over the entire period remaining less than $20/cwt. This illustrates the magnitude of unexplained price variation during the typical week present using the hedonic models. Understanding factors contributing to the model residuals is key to developing hedonic models that will help increase transparency in the fed dairy cattle market.

Figure 5. Upper 90th and lower 10th percentile model residuals, forward contract and formula trade (Equation (1) excluding plant effects), 2016–October 2021.
Given the relatively poor fit of the forward contract hedonic models, especially during times of volatile cash prices, we focus further analyses on formula price hedonic modeling. Plant effects are notable in formula pricing transactions for fed dairy cattle even after adjusting for state of origin. However, the average RMSE only declined by $0.24/cwt (from $4.85/cwt to $4.61/cwt) when plant effects were included in the models for equation (1). Thus, since reporting plant effects would compromise confidentiality and plant effects have economically small impacts on the goodness-of-fit measures of the models, we exclude plant effects in additional analyses. Furthermore, fixed plant effects are related to cattle origin so including fixed plant effects in the model, but not reporting them, would partially mask regional cattle price differences captured in origin fixed effects.
The hedonic model estimates (equation (1)) using the weekly models excluding plant effects are reported in Table 6. The average coefficient and associated standard deviation across the 303 weeks and two weekly models for specific weeks in September and October 2021, toward the end of our data period and thus, most recent, are summarized.Footnote 8 The default transaction had carcass weight between 600 and 950 lbs., had more than 30 head in the transaction, was delivered to the plant on a dressed-weight basis, and originated from Origin1.
Table 6. Formula net price hedonic model estimates (Equation (1), excluding plant effects), average for entire period and two separate weeks in September and October 2021
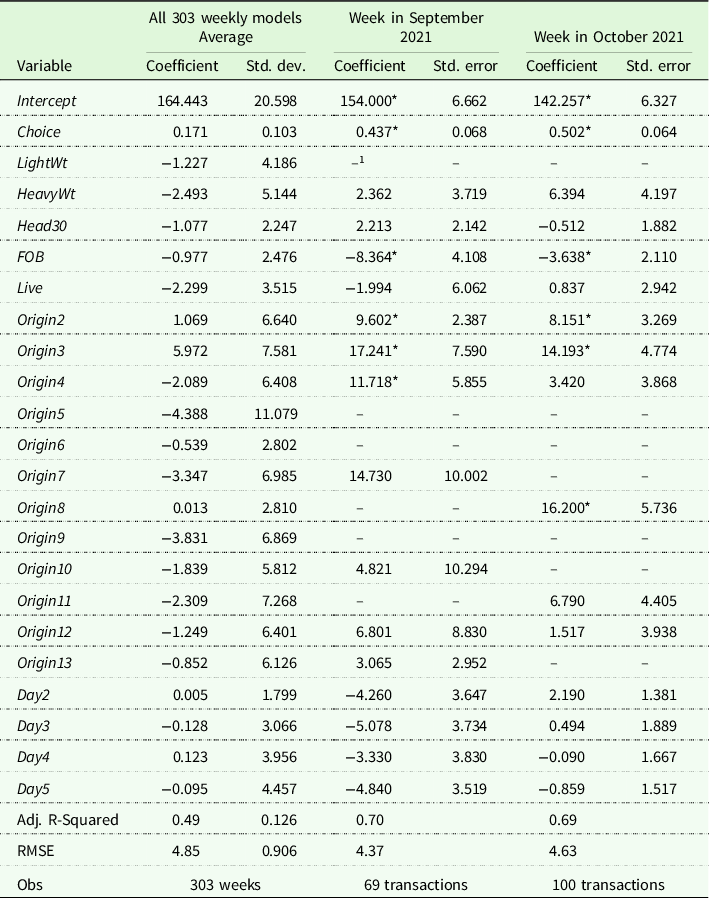
* Statistically different from zero at the 0.10 level.
1 Dashes, “–”, indicate no transactions with that variable occurred during that week.
Apparent in the entire period average in Table 6 is variation across weekly models. The standard deviation of most coefficients over the 303 weeks is often larger than the absolute value of the average coefficients. This is because coefficient estimates vary across time which also is why models are estimated each week for that week’s market reporting. We suspect estimated models reflect price variation because of unobserved factors due to data limitations.
On average, light weight (<600 lbs) lots received $1.23/cwt discounts and heavy weight (>950 lbs.) experienced $2.49/cwt discounts. Transactions with fewer than 31 head received a discount of about $1/cwt. Cattle purchased live had an average discount of over $2/cwt and those purchased FOB at the feedlot received a discount of about $1/cwt. Prices across cattle origin on average had a range of about $10/cwt in the typical week. We report state origins here without the states identified to preserve confidentiality. If models similar to those reported here were used to generate public reports, results could be aggregated to appropriate regions of states to maintain confidentiality requirements.
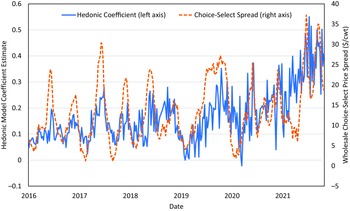
The Choice coefficient is the dollar per hundred-weight dressed price adjustment for each estimated percentage point of Choice and higher-grade cattle in a transaction. The Choice coefficient averaged 0.17 across the 303 models. Each weekly model estimated Choice coefficient is plotted against the 5-day rolling average of the boxed beef Choice-Select spread in Fig. 6. The coefficient estimates tend to follow similar patterns as the Choice-Select spread over the approximately 6-year period. The simple correlation of the two series is 0.58.
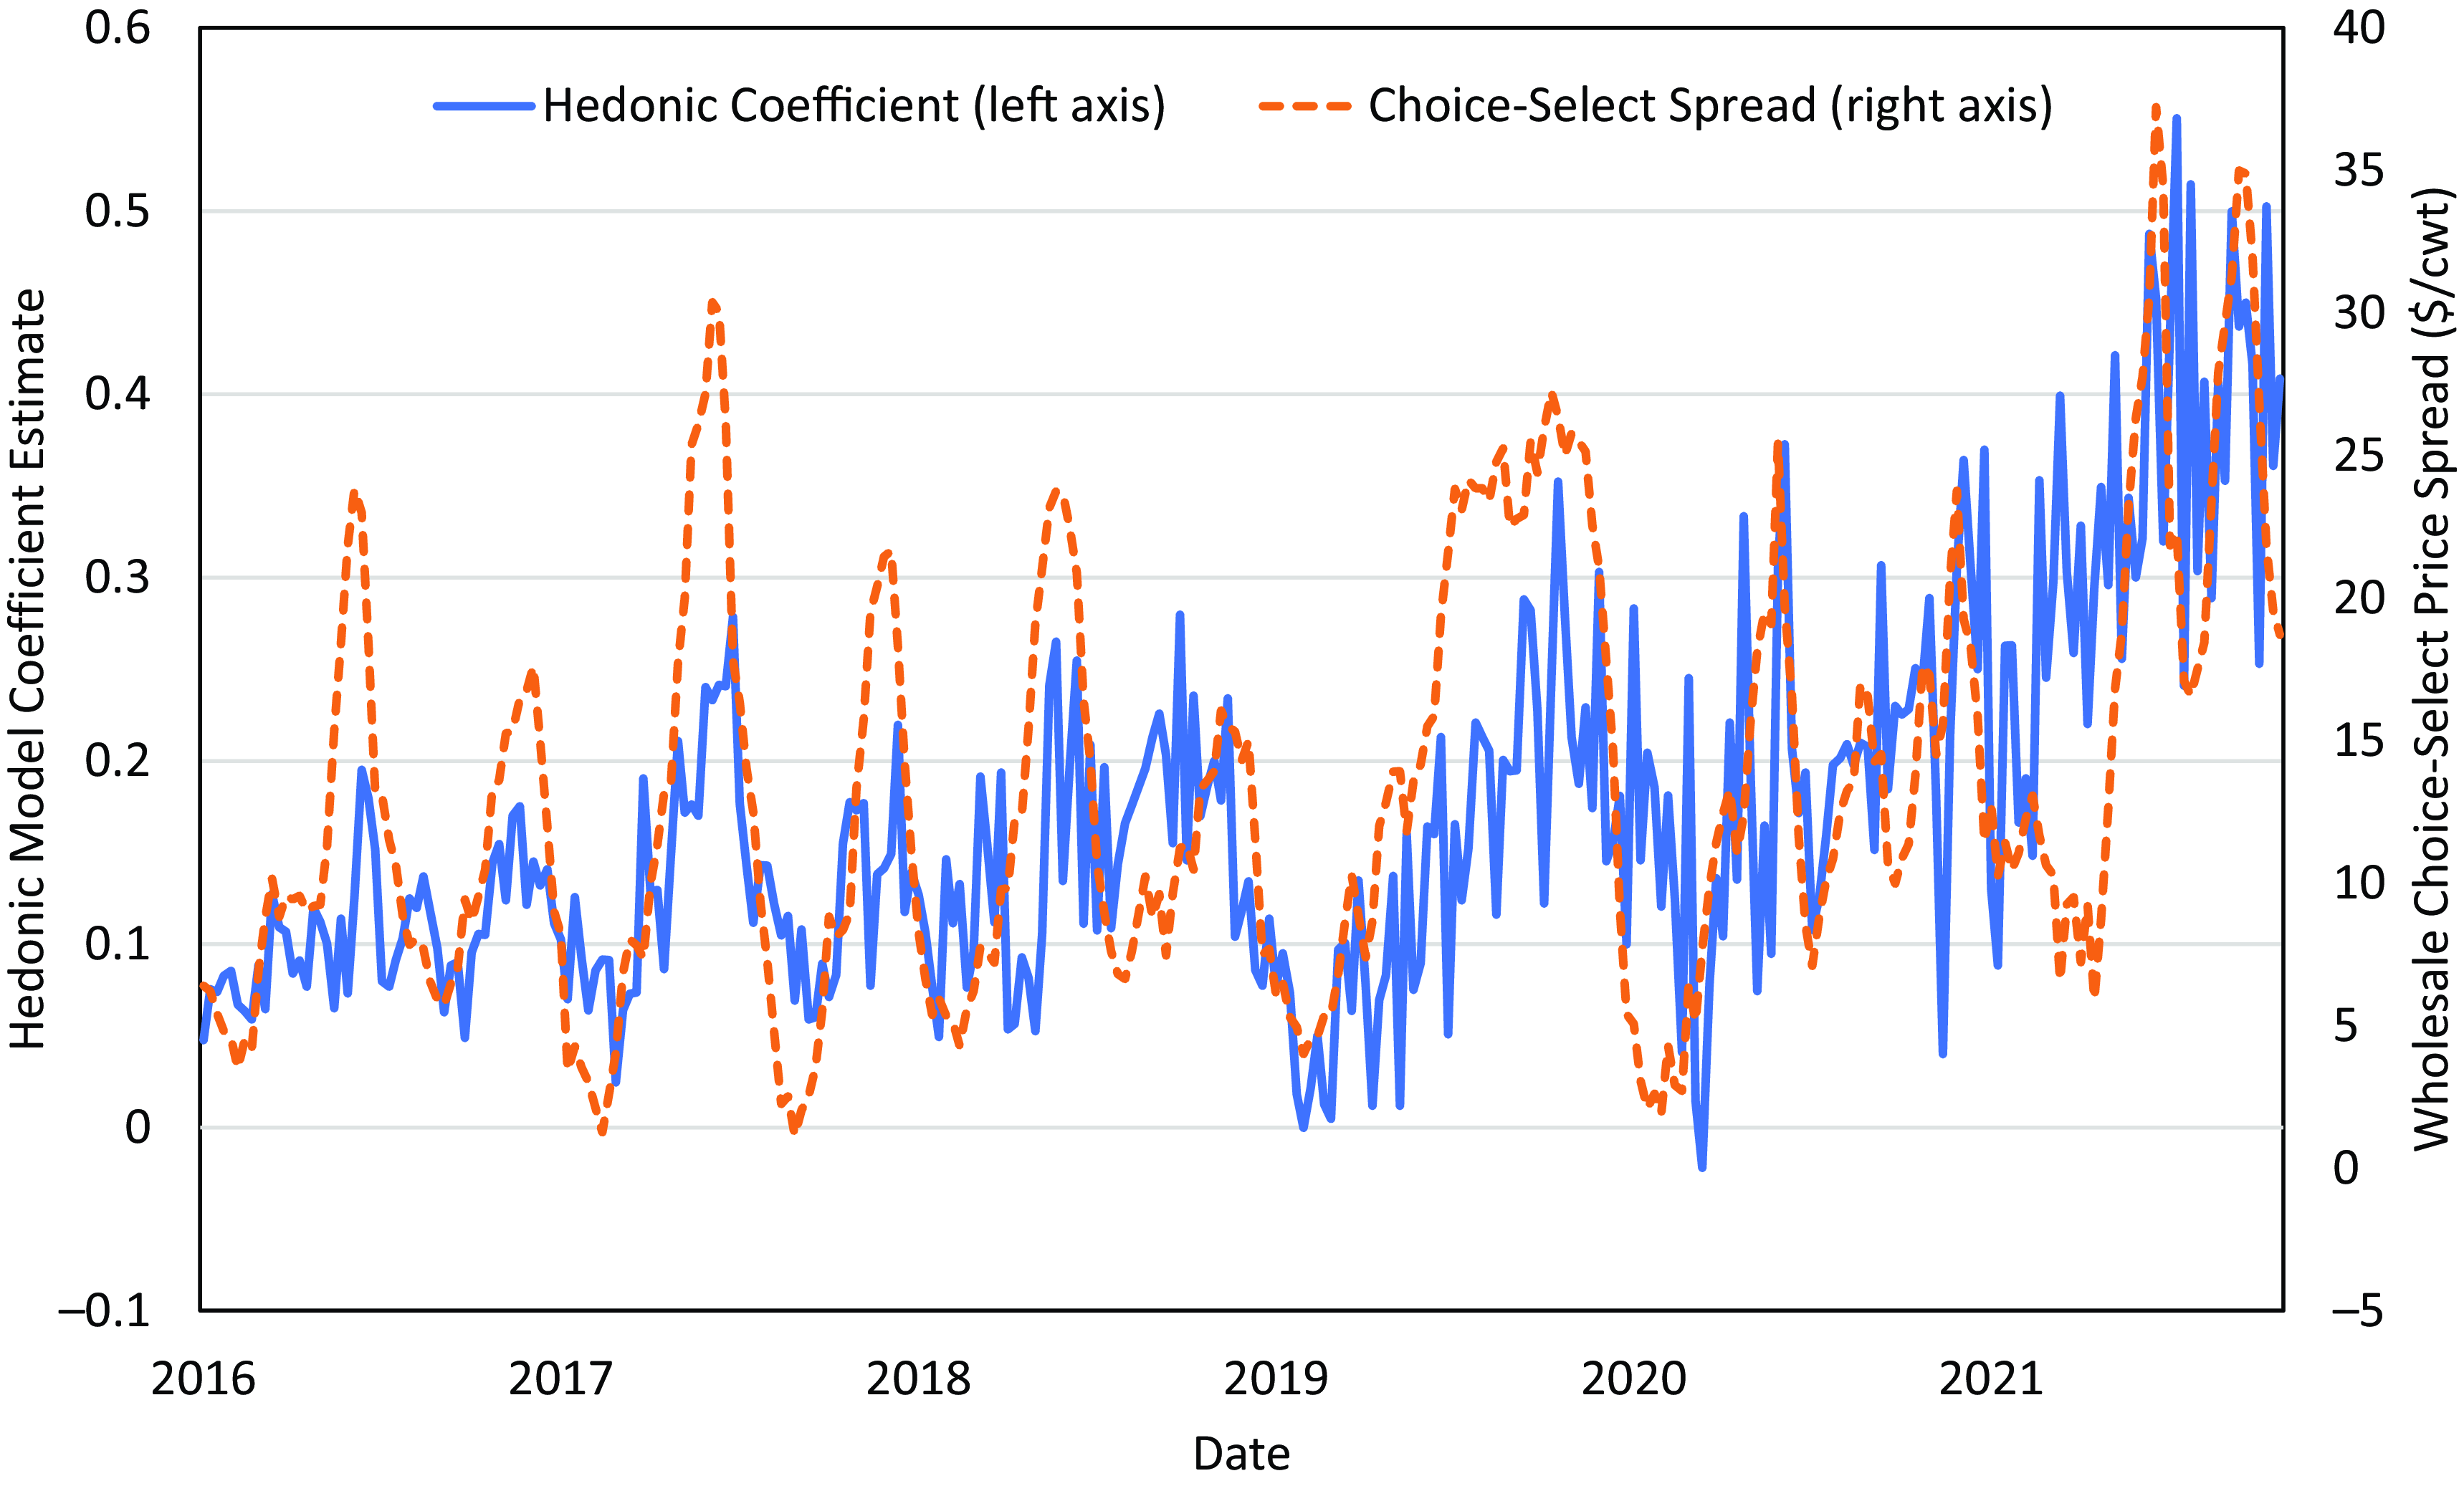
Figure 6. Weekly hedonic model Choice coefficient estimates and Choice-selected boxed beef price spread. (Source: Author calculations and USADA, AMS (2022)).
We focus next on the week in October model in our discussion (Table 6). The R-squared was 0.69 with an RMSE of $4.63/cwt dressed weight. Statistically significant (0.10 level) coefficients included Choice, FOB, Origin2, Origin3, and Origin8. As the percentage of Choice cattle increased one percentage point, the dressed price increased $0.50/cwt. Prices paid across origins varied by about $16/cwt from the lowest- to highest-priced state of origin.
The coefficient estimates for the October week are summarized in Table 7 (these prices are comparable to those reported in Table 1). During this time period, no light-weight pens as well as cattle from several origins were reported, so prices for these attributes are not available for this week. A premium of $6.39/cwt was paid for heavy-weight transactions, though it was marginally statistically different from zero (0.13 level). The information in Table 7 could be used to populate a dashboard type of price reporting system. Toggling the state of origin, percentage Choice grade, and so forth for each hedonic attribute, a price could be easily accessed from the dashboard for any particular type of transaction. The dashboard could be populated with price differentials for such transactions as they are available in a given week. Furthermore, though not illustrated here, a predicted confidence band (e.g., 15% and 85% percentiles) around the prices could be reported as well using the hedonic model predictions.
Table 7. Illustrative example of hedonic model estimated net formula prices for a week in October 2021
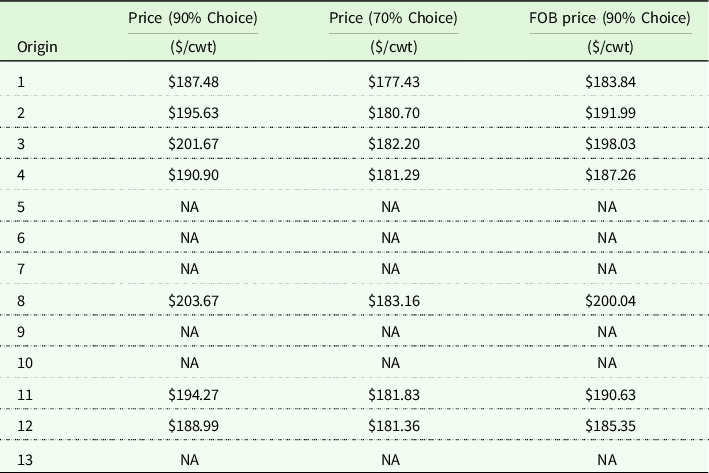
Note: dressed weight, delivered, origin 1, medium-weight default.
Discussion and conclusions
Fed dairy cattle represent an economically important segment of the U.S. fed cattle market that continues to evolve. However, little is known about how fed dairy cattle are purchased or what factors affect price variation across transactions. This is the first study we are aware of that has analyzed fed dairy cattle purchase transactions using USDA LMR data. Fed dairy steer and heifer prices have varied relative to fed beef steer and heifer prices notably over time. As such, fed dairy cattle prices merit separate reporting by USDA AMS, as is done today. This is the only study that has assessed ways USDA AMS market reporting for fed dairy steers and heifers could be enhanced.
Fed dairy cattle have rapidly transitioned from being mostly purchased on a formula basis a few years ago to forward contracting representing over half of all transactions in recent years. This contrasts with fed beef steers and heifers where more than 60% of transactions use formula purchase methods and generally less than 10% use forward contracts (Schroeder et al. Reference Schroeder, Coffey, Tonsor, Fischer, Outlaw and Anderson2021). In addition, fed dairy cattle formula and forward contract trade shares are dependent on region. Formula purchases tend to be more common in Western and Central states, whereas forward contracting is more common in North Central and Eastern regions.
With the importance of forward contracts in the fed dairy cattle market, additional information could be collected by USDA AMS from packers to improve forward contract price reporting. We illustrated during times when cattle prices are volatile, net prices for forward contract delivered cattle are volatile likely because of varied timing on when base prices were established. AMS could collect the date forward contract base prices were set and use that to adjust reported net prices accordingly. Reporting forward contract prices for cattle delivered in a given week conditional to when base price was established would be more informative than the current practice of combining them together in one weighted-average price for the delivery week. Another area for expanded data collection is the group of traits for which fed dairy cattle received premiums and discounts. In 2021, 61% (54%) of fed dairy cattle marketed via forward contract (formula) received premiums or discounts for Other. Discovering what traits are contained in this residual category could add understanding to fed dairy cattle prices and could enhance market reporting. Identifying traits on fed dairy grids and adjusting data collection accordingly could add value to fed dairy cattle market reports.
As expected, formula-type fed dairy cattle purchases are typically priced using grids that adjust prices for quality grade and often other attributes. This is consistent with beef steers and heifers (Schroeder et al. Reference Schroeder, Coffey and Tonsor2022). However, somewhat surprising is that nearly all forward contracted fed dairy cattle are also typically purchased with a grid pricing system. Grid-purchased fed cattle often result in relatively large ranges in reported prices across transactions, as is evident with fed dairy cattle purchases analyzed in this study. This is consistent with beef steers and heifers (Schroeder et al. Reference Schroeder, Coffey and Tonsor2022). Without having measures of factors causing potential differences in net prices paid, associated factors causing premiums or discounts are difficult to identify and measure. We recommend quality grade, yield grade, light- and heavy-weight carcass, incidence of liver abscesses, and other pricing factors, including a separate beef-dairy cross category, be collected by USDA AMS to facilitate more informative price reporting. The increasing prevalence of beef-dairy crossbreeding magnifies the importance of this suggestion.
Hedonic modeling could be used in fed dairy cattle net formula price reporting as we have illustrated. However, existing data collected by USDA AMS excludes potentially important price determinants making hedonic models mis-specified because of omitted relevant variables. That said, having premium and discount information did not appreciably help explain formula net price variation present during typical weekly hedonic models. Fed dairy steer and heifer net formula transaction prices vary for reasons we were not able to well explain using location, packing plant purchaser, quality grade, yield grade, weight, or other premiums and discounts. Other factors which are not identifiable using current LMR data are contributing to economically important fed dairy cattle price variation. More research is needed to identify transaction price determinants in the fed dairy cattle market.
Data availability statement
The data used in this study were provided by the U.S. Department of Agriculture, Agricultural Marketing Service under strict confidentiality. The data cannot be shared by the authors.
Acknowledgments
This research was supported in part by the U.S. Department of Agriculture, Office of the Chief Economist and Agricultural Marketing Service (Grant Number 58-0111-21-020). The findings and conclusions in this article are those of the authors and should not be construed to represent any official USDA or U.S. Government determination or policy. We acknowledge helpful comments from Shawn Arita, Peyton Ferrier, Rebecca Nemec, and two anonymous journal reviewers on earlier versions of this article. The authors are grateful to USDA AMS for supplying data used in this study.
Competing interests
The authors declare none.


 Open access