


Introduction
The research in Artificial Intelligent (AI) is advancing rapidly. Such advancement benefits the field of design-related research with the introduction of various new Natural Language Processing (NLP) frameworks. These NLP frameworks benefit the design field in various areas, especially in the education sector, where huge amounts of written documentation are collected throughout the span of design courses. This documentation is currently processed through mainly manual means, which are time-consuming and labor-intensive. The adoption of NLP frameworks in the processing of textual documentation can make the whole assessment process quicker and more efficient and enable some form of quantification of design progress.
One application of NLP frameworks in design education is the ability to map out feedback diagrams representing progress made by students as they experience the course. Most design courses start with a brief (Koronis et al., Reference Koronis, Silva and Kang2018, Reference Koronis, Casakin and Silva2021) and students are to evolve this brief in the form of a design statement periodically as they proceed through the course. Such evolving design statements may contain critical information that provide a window into the students’ cognitive thought process at any instantaneous point of time as they document the project. With the collection of this textual data in the form of design statements from individual students periodically, the NLP models are able to pick up keywords and produce quantitative graphs that may represent a sort of path of mental thoughts for each student. The path of thoughts mapped through the capturing of written textual data from the students is often referred to as the divergence/convergence traits (Chiu et al., Reference Chiu, Silva and Lim2022). It appears in various design thinking frameworks including the 4D Double Diamond Framework (4D Framework) (Camburn et al., Reference Camburn, Auernhammer, Sng, Mignone, Arlitt, Perez, Huang, Basnet, Blessing and Wood2017; UK Design Council, 2019; Lauff et al., Reference Lauff, Wee, Teo, Swee, Png, Collopy, Vargas and Wood2021).
Although there are several existing papers on the topic of NLP models, most papers focus on the stage of text mining or project data interpretation. There is scarce literature looking at graphical visualization of such data for the purpose of quantitative feedback on the teaching and learning environment. Furthermore, several different types of NLP approaches exist to produce similar path diagrams representing individual or team design progress. One common approach is the use of Latent Semantic Analysis (LSA; Landauer et al., Reference Landauer, Foltz and Laham1998), which captures the frequency of occurrence of particular word throughout the design course and is often paired with the use of Cosine similarity to measure distance between points of capture. On the other hand, a more recent combination developed to visualize project divergence is the use of Word-to-Vector (Word2Vec; Mikolov et al., Reference Mikolov, Chen, Corrado and Dean2013) which creates a corpus word cloud that allows distances representing divergence to be measured through Euclidean distance (Jones et al., Reference Jones, Ashby, Momin and Naidoo2010; Chiu et al., Reference Chiu, Silva and Lim2022). This paper aims to look deeper into these four above-mentioned NLP approaches and to evaluate their suitability in producing design process diagrams throughout a design course, before making a recommendation for the future AI-driven learning environments.
Literature review
Backgrounds of divergence and convergence model in design
The divergence and convergence framework was initially proposed by Banathy (Banathy, Reference Banathy2013), which represents a process model for New Product Development (NPD) as shown in Figure 1. This model was later adopted by the UK Design Council (UK Design Council, 2019) into the currently known 4D Framework (Camburn et al., Reference Camburn, Auernhammer, Sng, Mignone, Arlitt, Perez, Huang, Basnet, Blessing and Wood2017; Lauff et al., Reference Lauff, Wee, Teo, Swee, Png, Collopy, Vargas and Wood2021) which accounts for the divergence and convergence in a stage-gate (Cooper et al., Reference Cooper, Edgett and Kleinschmidt2002) relationship during the NPD process. Despite the existence of several different types of Design Thinking frameworks, most involve the concept of framing and reframing which “transits” from one stage into another with more insights uncovered. Such transition creates mental divergence and convergence which may resemble the model of the 4D Double Diamond framework proposed by the UK Design Council. This divergence and convergence relationship often remains a design feature during the NPD process, which is not usually measured in most educational environments. The iconic double diamond shape often exits as an ideal framework, but it would be interesting to study such divergence and convergence in an organic manner.

Figure 1. The dynamics of divergence and convergence (Banathy, Reference Banathy2013).
Furthermore, projects in design classes often require students to work in a team-based environment, where constant communication among the team members is crucial to the mutual understanding and setting of common goals (McComb et al., Reference McComb, Green and Compton1999; Hill et al., Reference Hill, Song, Dong and Agogino2001) is required. To foster this communication, current education belief is to encourage the use of journal logging for both internal and external communication in order for the course instructor to be updated on the teams’ latest development, which often exists in the form of an assignment. These assignments are often processed manually and are useful for a short period of time before getting discarded when the next assignment comes in. This leads to the rise in the opportunity of applying AI algorithms such as the NLP frameworks which specialize in text mining and context understanding to create a better quantitative learning environment and provide a path of learning that connects all these assignments together.
Application of NLP in a design course
The use of text-based data mining processes in attempt to understand the conversations about projects and to produce summaries through various NLP techniques are widely adopted through various means (Dong et al., Reference Dong, Hill and Agogino2004; Chiu et al., Reference Chiu, Silva and Lim2022; Ferguson et al., Reference Ferguson, Cheng, Adolphe, Van De Zande, Wallace and Olechowski2022). Design as a process at its various stage revolves around tons of text documentations such as internal reports, design concepts, discourse transcripts, and technical publication where tools like NLP and AI can be utilized gather insights or predict recommendations (Koh, Reference Koh2022; Siddharth et al., Reference Siddharth, Blessing and Luo2022). However, most of such data mining processes crawl through untargeted data source such as communication chat groups or general documents revolving around the project such as emails or reports. Despite the relevance of such text documentation, the large amount of impurities may interfere with the result as the NLP models are context-sensitive and maps the relationships of words based on how words are used within the collected sample data.
To minimize impurities on the collected data, Chiu et al. has come up with a framework to harvest textual information on a singular design statement from every member of the design team that focuses on the actionable goal at the end of every weekly class as a form of reflection (Chiu et al., Reference Chiu, Silva and Lim2022). The data collected in this approach are precise and is immediately representative of the intention of each student without a complicated data cleaning process. Such information that each student writes on a regular interval which is then converted into numerical data. The numerical data of each interval is then compared with the numerical data from the initial design statement (the control) to create a distance per interval of time that represents the divergence (moving away from the control) or convergence (moving closer to the control) of thought, also known as “divergence-convergence” or deviation. The deviations across intervals are eventually plotted onto a graph for visualization purposes. Such graphs can be read on an individual basis, a group setting and even as a cohort as shown in Figure 2.

Figure 2. The spike and synergy diagram (Chiu et al., Reference Chiu, Silva and Lim2022).
The entire visualization process is further split into two phases, the “upstream” and the “downstream” phases. The upstream phase involves the recognition of words used from the collected design statements and how these words are harvested from the initial statements. The downstream phase performs distance indication to calculate the deviation of words used in any subsequent interval with respect to the words used in the initial sentence. To incorporate the upstream and downstream processes, four data processing methods are involved namely the latent semantic analysis, the Word-to-Vector, the Cosine similarity, and the Euclidean distance which will be briefly individually introduced below.
Latent semantic analysis (LSA)
The LSA is an upstream method for topic modeling in NLP which is often used to conduct coherence prediction by analyzing a body of text to another body of text to determine the degree of similarity (Foltz et al., Reference Foltz, Kintsch and Landauer1998). There are two major steps involved in LSA. First, is to calculate the term frequency in term-document (n × m) matrix form, where n is the column of the terms and m is the row of the documents. Every entry in the matrix is the frequency of a term occurring in the corresponding document (Naili et al., Reference Naili, Chaibi and Ghezala2017). To calculate the frequency of terms used, the frequency of each word used is measured against all words within a small corpus which is made up of a collection of all words tokenized and lemmatized by NLTK libraries (Hardeniya et al., Reference Hardeniya, Perkins, Chopra, Joshi and Mathur2016). For example,
-
d1 = “I see a kite flying in the sky”.
-
d2 = “This is my first time seeing the aeroplane flying above me”.
The term-document matrix will generate the term frequencies as shown in Table 1 (Naili et al., Reference Naili, Chaibi and Ghezala2017; Van Der Heijden, Reference Van Der Heijden2022).
Table 1. Sample output of LSA

The second step is to perform a matrix decomposition using truncated singular-value decomposition (SVD). This reduces the dimension of the matrix without any significant information loss from the original document (Naili et al., Reference Naili, Chaibi and Ghezala2017). The result of the SVD is then being transformed so that the LSA model could be fit into the term-document matrix and its dimension could also be reduced (Van Der Heijden, Reference Van Der Heijden2022). The result will be in the form of a dense array. This form of dense array will then be used as an input argument to compute for the Cosine similarity and Euclidean distance.
Word-to-Vector (Word2Vec)
Another method in the upstream phase is the Word-to-Vector (Word2Vec) framework proposed by Mikolov et al. (Reference Mikolov, Chen, Corrado and Dean2013). The Word2Vec framework works with an available large corpus and is able to calculate the relationships of all words within the corpus, depending on how the words are used in relation to its neighboring words in the corpus. This means that with the selection of domain-specific corpuses, the accuracy of prediction can be improved, and is largely flexible simply by changing the corpus selected. The Word2Vec framework is able to conduct its word prediction based on the surrounding context largely due to its two distinct models of Continuous Bag of Words (CBOW) and Skip-Gram, respectively (Mikolov et al., Reference Mikolov, Chen, Corrado and Dean2013; Naili et al., Reference Naili, Chaibi and Ghezala2017). However, result produced by Word2Vec at this stage is hardly understandable as the data produced is in high dimension. To overcome such constraint, a t-Distributed Stochastic Neighbor Embedding (t-SNE) (van der Maaten and Hinton, Reference Van der Maaten and Hinton2008) model is adopted to convert high-dimensional data into lower dimensions to be visualized, while preserving the key neighboring relationship between words within the corpus (Smetanin, Reference Smetanin2019). The t-SNE model eventually formed the two-dimentional Wordcloud through the neighboring relationship as shown in Figure 3, which clusters similar words together within close proximity.

Figure 3. A sample t-SNE wordcloud which is produced from a high-dimension data from Word2Vec (each dot represents a unique word in the corpus).
Cosine similarities
Cosine Similarity is a popular framework that is widely used in text mining and various applications of NLP (Li and Han, Reference Li and Han2013). This framework is classified here as a downstream method that measures the difference between words used based on their distances calculated from the cosine of an angle. It is a very useful technique in calculating the similarity degree between two topics by considering the orientation but disregarding the magnitude. It measures the cosine angle between two vectors. When the angle is 0 degree, then the Cosine similarity is 1, indicating that the two topics are perfectly identical (Case 1). When the angle is 90 degrees, then the Cosine similarity is 0, meaning that the two topics have no correlation to each other (Case 2). When the angle is 180 degrees, then the Cosine similarity is −1, indicating that the two topics approach the same context in an opposite manner (Case 3) (Oduntan et al., Reference Oduntan, Adeyanju, Falohun and Obe2018). To elaborate,
• Case 1: User A and User B both study for Math exam exactly in the same kind of environment.
• Case 2: User A and User B are not linked to any Math exams.
• Case 3: User A and User B both study for Math exam in an opposite way. User A likes to study in a quiet environment, while User B likes to study in a noisy environment.
Euclidean distance
Another way to measure similarity is by using Euclidean distance, another downstream method. Euclidean distance is standard metric for geometrical point findings and is the square root of the differences between two vectors that are summed together. It gives the magnitude but disregards the orientation and it always results in an absolute value (Oduntan et al., Reference Oduntan, Adeyanju, Falohun and Obe2018). Euclidean distance is also useful for text clustering.
The Euclidean distance between X and Y vectors can be defined as (Huang, Reference Huang2008):
 $$d( {x, \;y} ) = \sqrt {\mathop \sum \limits_i^n {( y_i-\;x_i) }^2}.$$
Before generating the Euclidean distance, a centroid of a cluster is being calculated first as statements of different intervals may contain the different number of words as shown on the left of Figure 4. After the centroid has been calculated, then the Euclidean distances between the first week and the rest of the weeks are performed sequentially on the right of Figure 4.

Figure 4. A representation of Centroid determination (left) and Euclidean distance computation (right).
Methodology
A study is conducted to apply the above-mentioned NLP frameworks in a graduate design class in the Singapore University of Technology and Design (SUTD) over a 14-week period. This study is in collaboration with a term long multidisciplinary design class under the Master of Innovation by Design (MIbD) where 25 students with diverse backgrounds are split into groups of 3 to 5 to solve real-life corporate problems using the 4D Framework. The problem statements addressed by the teams span across engineering products, consumer products, medical, and aerospace industries. Furthermore, as the students are given the freedom to pitch and recruit talents at the team formation stage, each student is able to bring their professional expertise and perspective into the team. As such, the study focuses on data collection on the weekly design statement written by the individuals in the teams instead of obtaining a singular group writeup. The individual writeups are then processed through an NLP workflow similar to Design Progress Dashboard (Chiu et al., Reference Chiu, Silva and Lim2022) to convert text to numbers before graph plotting. Instead of a singular process, this paper evaluates two NLP upstream methods to break down text into numerical data which is then fed into the two downstream distance-producing frameworks. The data are then plotted as a graph representing the mental progress representing divergence and convergence made through the course.
Throughout the full duration of 14 weeks, only 7 of design statement interactions were collected which started from week 3 and ends at week 10 as students are focused on submitting their final deliverables for the modules beyond that; with week 7 being the recess week thus no data was collected during that week. The design statement is collected in three parts to capture (1) what intervention is the student working on, (2) who the intervention is designed for, and (3) why is the intervention done, according to Chiu et al. (Reference Chiu, Silva and Lim2022). Only the results collected in the “why” section are processed through a series of data cleaning involving Tokenization (Webster and Kit, Reference Webster and Kit1992), Lemmatization (Kutuzov and Kuzmenko, Reference Kutuzov and Kuzmenko2019), Removal of Stop-words (Dong et al., Reference Dong, Hill and Agogino2004), and Parsing (Manders and Klaassen, Reference Manders and Klaassen2019) to extract keywords as tokens that may suggest the original design intent at that given point in time (Chiu et al., Reference Chiu, Silva and Lim2022). At this stage, the tokens extracted are now ready to be tested between the two text harvesting frameworks which are LSA and Word2Vec, respectively.
These tokens are then processed by the two upstream NLP frameworks separately to compare and obtain the degree of differences in the form of “token coordinates” in a two-dimension space. Beyond this, the token coordinates per interval are then further processed via the two downstream NLP frameworks by comparing the tokens collected at every interval to the tokens at the inception, as a form of control shown in Figure 5 to obtain a distance which represents divergence. A detailed overall flowchart containing the relationship between the upstream and downstream frameworks can be found in Figure 6. The purpose of comparing tokens to the inception interval is to allow for an opportunity to have a downward graph pattern since distances obtained are always positive. For example, if the distance of divergence between the first interval is larger than the second, the graph will show a downward trend after having a local maximum during the first interval. On the other hand, if the distance obtained is compared to the previous interval instead of the control, the graphical observation will only be an uptrend graph since the distances are non-negative.

Figure 5. An image representing how tokens are compared.
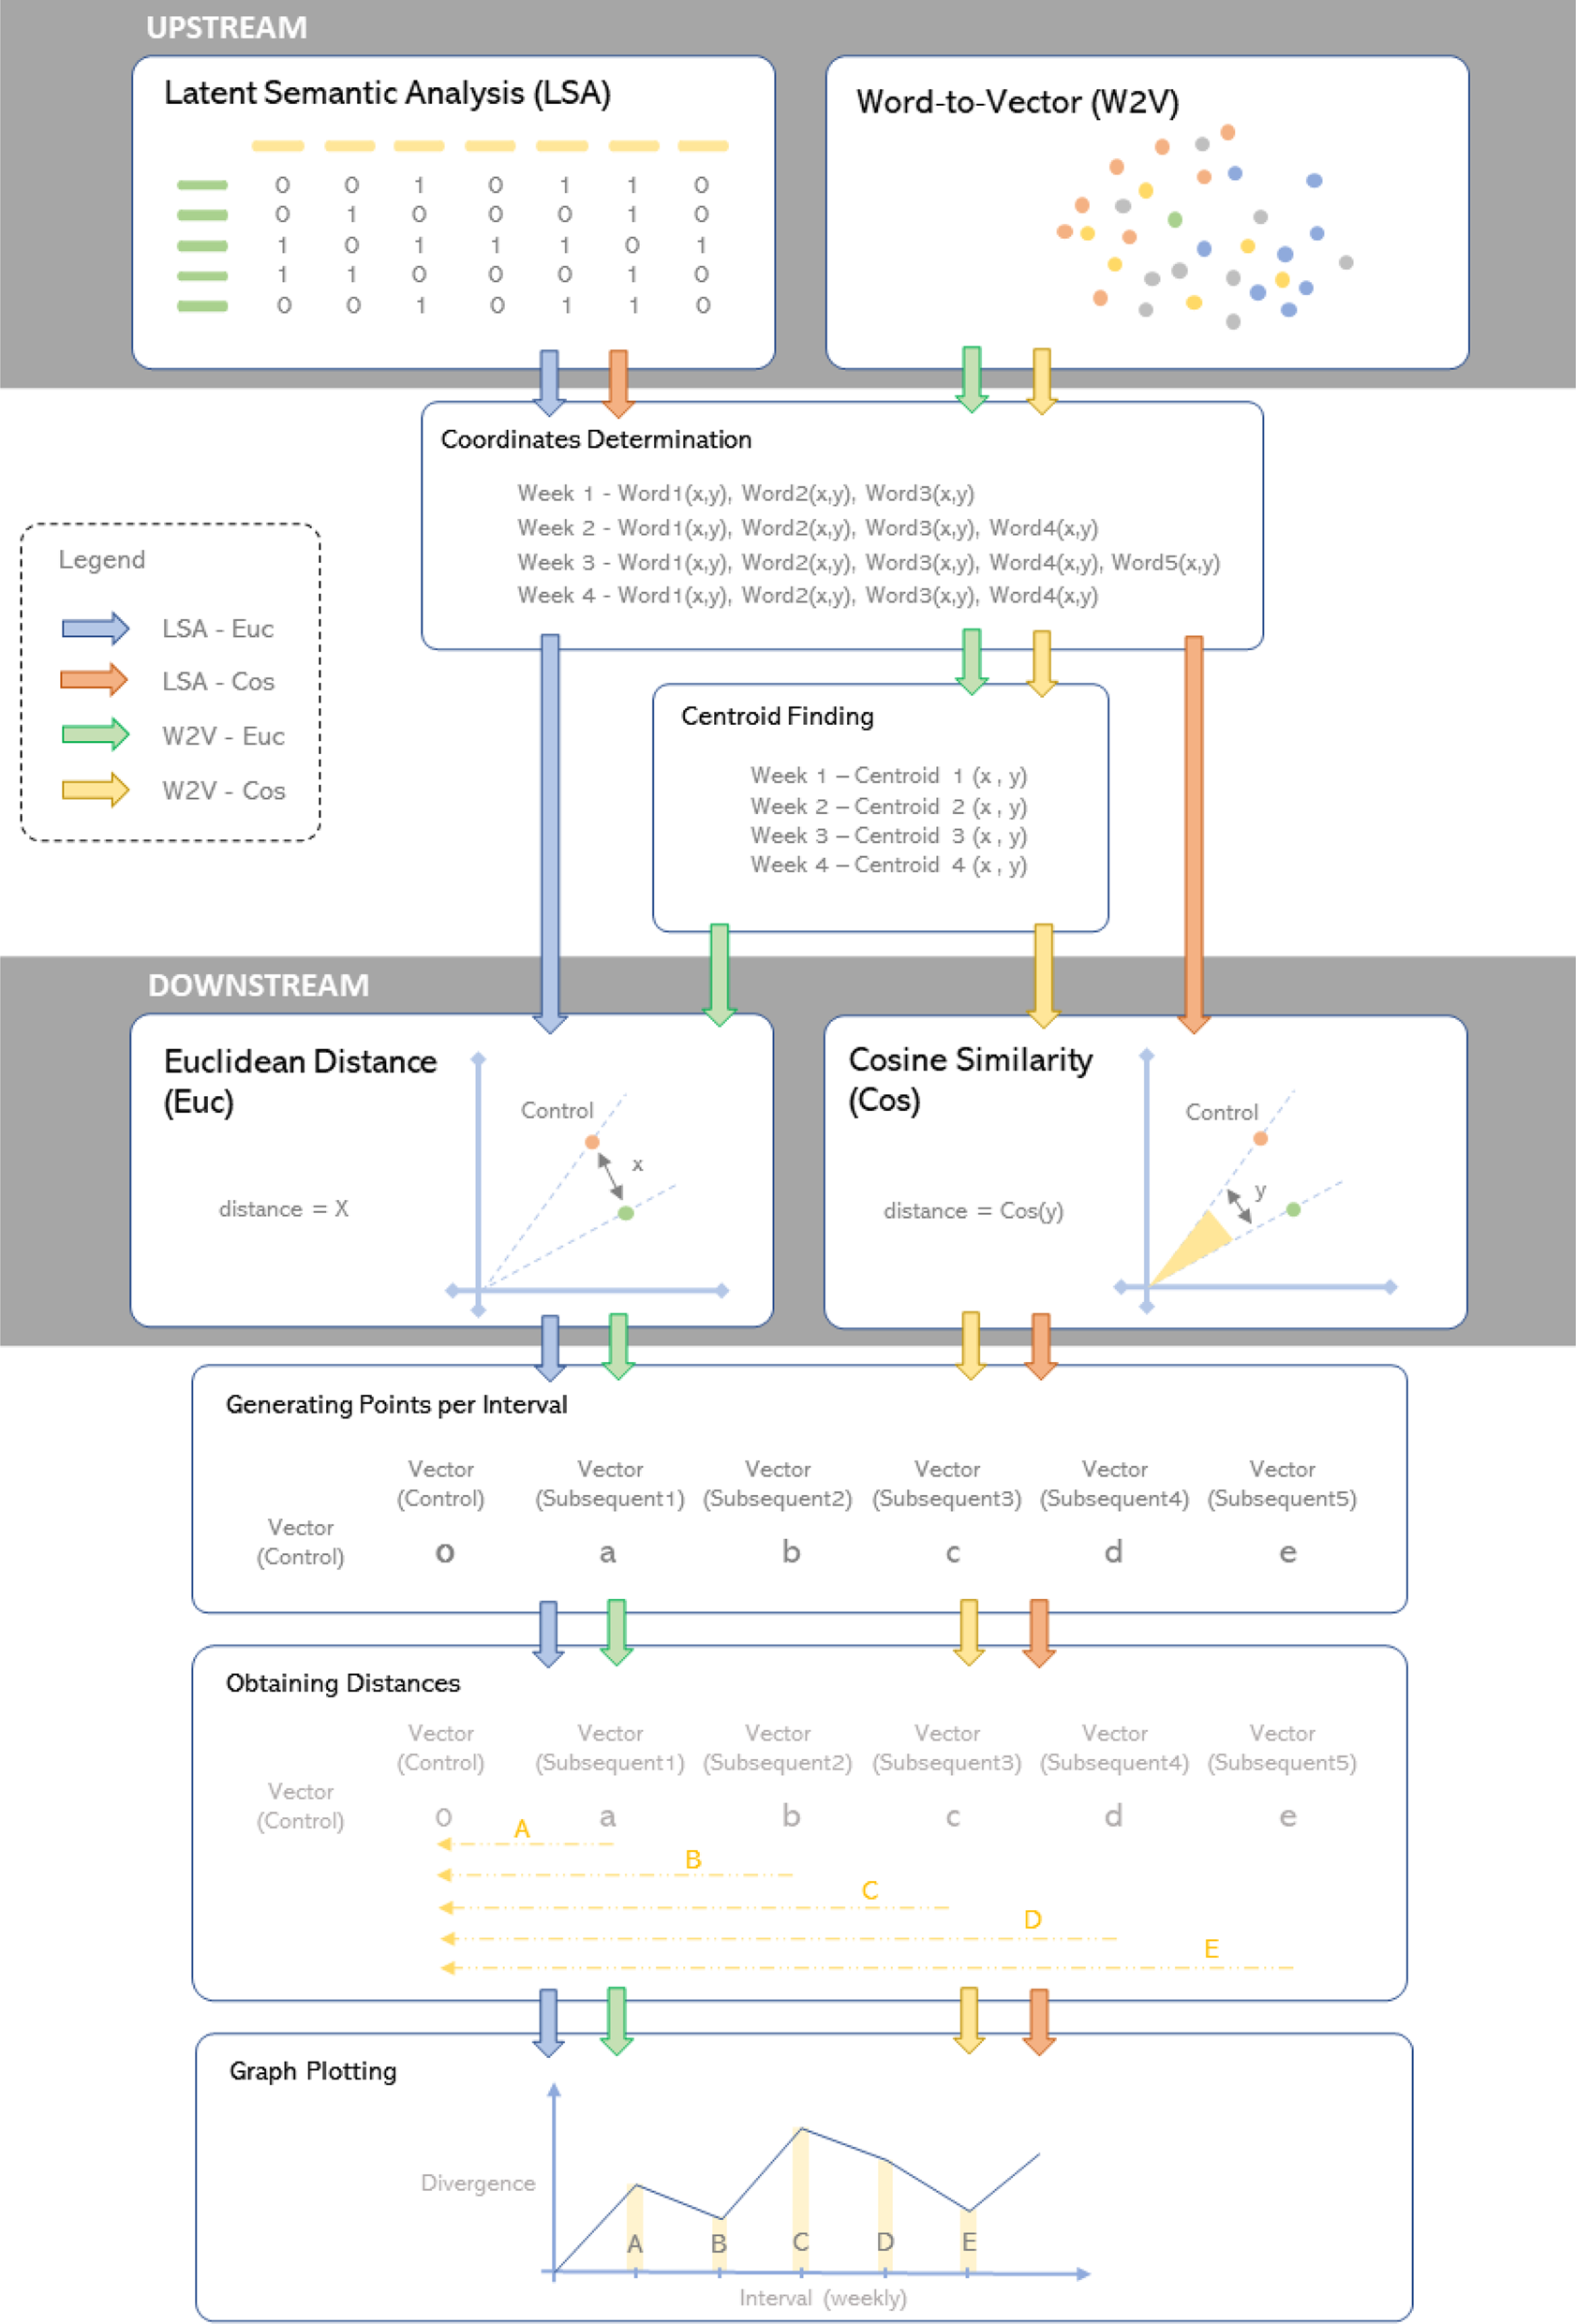
Figure 6. Overall NLP process flowchart.
As mentioned in the Literature Review section, the NLP frameworks used to visualize design team progress reviewed in this paper generally consists of two upstream and two downstream methods. To make a fair experiment using the models, four different combinations were tested using the same data collected in this class to explore which combination may be the most suitable to perform such design team progress tracking in class. The four combinations used are (1) LSA–Cosine similarity (LSA-Cos), (2) LSA–Euclidean distance (LSA-Euc), (3) Word2Vec–Cosine similarity (W2V-Cos), and (4) Word2Vec–Euclidean distance (W2V-Euc), respectively.
Case study
As mentioned in the Methodology section, the design statement collected typically comes in three parts on (1) “what is this intervention”, (2) “who will be the user of the created intervention”, and (3) “why is the intervention in this manner”, respectively. Table 2 contains the result of three sample students and their extracted design statement. The figure contains both their original statement and the tokenized format.
Table 2. Sample of data collection done in the MIbD class for three participates

The data collected in class including the ones used in Table 2 are then processed through the four above-mentioned NLP workflows as shown in Figure 6. Figure 7 contains the result of all four different combinations. Each of the graphs in Figure 7 represents the average score of the teams. The figure showcases two distinct types of graphs that can be used to infer divergence of students’ thoughts through the course with the use of Euclidean distance and Cosine similarity. The graphs (in blue and green) representing the Euclidean distance tend to progress in an upward trend from the ground zero, while the graphs produced using Cosine similarity (in yellow and orange) fall within a band of values between −1 and 1. While the Euclidean measures show clearly distinct values across the various weeks, the Cosine measures can be read like this: a value of “zero” or “near-zero” reveals an “orthogonal” relation between the consecutive weeks (which means they are not similar). whereas a value close to unity means a similarity between statements in consecutive weeks. The graphs in Figure 7 also demonstrate the possibility of visualizing the divergence of student thoughts through each of the four combinations.

Figure 7. Result of MIbD class with four different NLP combinations using the same dataset (plotted with interval against divergence).
In order for the data to be comparable as the number of students in each team differs, an overall group average of the result is presented. These graphs represent each teams’ divergent–convergent behavior as they experience the course on a weekly interval. Since each of the four NLP frameworks evaluate different input parameters (e.g. LSA measures frequency of words used, Word2Vec measures contexts of how words are used, while Cosine similarity focuses on the angular distance where the Euclidean distance focus on the linear distance), the absolute magnitudes of their graphs are not comparable. The only common aspect between the four graphs is the intervals where the data are collected, thus the four graphs can be visualized using the same horizontal axis, but their magnitudes in the vertical axis do not necessarily have to agree with each other.
Comparing the upstream processes graphically with Euclidean distance
To have a better comparison between the upstream phase, the LSA-Euc and W2V-Euc combinations were selected as a comparison by keeping the Euclidean distance as the consistent downstream framework. The graphs in Figure 8 showcase the side-by-side comparison of the original LSA-Euc (in blue) and the original W2V-Euc (in green). Graphically, it can be seen that both processes are picking up junctions of divergence and convergence to a relatively large degree, although they differ in magnitude. They show a general tendency to diverge although occasionally one diverges more than the other. This must have to do with the way in which the distance is computed. By simple observation, the LSA-Euc graph seems to have a large degree of deviance as compared with the graph produced by the W2V-Euc which allows changes to be more noticeable from a glance. Overall, it is somewhat clear that the “organic” divergence and convergence pattern produced by students in the real project does not resemble the iconic two diamonds in the established 4D framework.

Figure 8. LSA versus W2V using Euclidean distance (plotted with interval against divergence).
Comparing the upstream processes graphically with Cosine similarity
Similarly, the graphs in Figure 9 showcase the comparison of the two upstream methods using Cosine similarity as the downstream counterpart. It is observed in Figure 7 that the graphs produced by the Cosine similarity resulted in an upside-down pattern as compared to the graphs of the Euclidean distance; thus, the graphs in Figure 9 were intentionally flipped to allow easier comparison while keeping the relationship of magnitude constant between Figures 7 and 9. Similar to the results above, the tracking of divergence and convergence using Cosine similarity approach tends not to produce the double-diamond established pattern as well. Despite the differences between the magnitude of the graphs between LSA-Cos and W2V-Cos, the general behavior in which how the graphs proceed in all five teams tends to be largely related. At the same time, most of the key junctions which have drastically altered the direction of the curves within each team can be observed in both graphs such as Week 9 in Team 1 and Week 5 in Team 3 for example.

Figure 9. LSA versus W2V using Cosine similarity (plotted with interval against divergence).
Discussion
Comparing LSA and W2V
To evaluate on the technical aspect, both LSA and Word2vec are similar where they perform word embedding methods in a vector space and transform higher-dimensional data to lower-dimensional data (Naili et al., Reference Naili, Chaibi and Ghezala2017). However, in the case of LSA, it computes the similarity degree between one word to another based on the frequency and visualizes the frequency of a word in a sentence by document matrix (Dong et al., Reference Dong, Hill and Agogino2004; Naili et al., Reference Naili, Chaibi and Ghezala2017). In general, LSA is a tool that is suitable to sort the relationship of words used in a small pool of data, which sorts the relationship of words based on the words used within a local document (Altszyler et al., Reference Altszyler, Sigman, Ribeiro and Slezak2016; Eligüzel et al., Reference Eligüzel, Cetinkaya and Dereli2021). This means although LSA is great in computing the similarity degree, the calculation is confined within a small corpus of words used by one individual student such as the example shown in Table 3. Should the corpus be expanded to account for words used by more than one individual, the frequency of appearance of calculation used by the LSA model will not work and create an inaccurate result.
Table 3. Sample of LSA distribution table using responses from one student (P1)

On the other hand, Word2vec computes the similarity degree between one word and another based on the neighboring words with its skip-gram and CBOW (Continuous bag-of-words) models. Word2vec performs very well for large datasets as it first establishes the relationship of words used with a global corpus, such as a dictionary. This gives Word2vec a wider knowledge ability to map the relationship of words through a bigger context than the ones with LSA, which allows Word2vec to outperform LSA (Altszyler et al., Reference Altszyler, Sigman, Ribeiro and Slezak2016). As discussed in Chapter 2.2.2, Figure 3 showcased an example of mapping a large corpus accounting for the relationship of words used in an entire document. Therefore, the words used by each student each week are searched against the entire corpus which was previously created taking account of relationship of words within the used document, giving a more accurate representation.
In the context of this research, Word2vec outperforms LSA because of its ability to process large corpuses. As the field of design requires constant innovation, there is no clear boundary to words that this process may require, and tools such as the LSA which is limited by the corpus size are not as ideal comparatively. On top of that, by considering all neighboring relationships between one word and another, Word2vec considers more than just frequencies of appearance of each word. Therefore, the Word2vec-Euc NLP framework seems more favorable in the context of design education to assess divergence and convergence.
Comparing Euclidean distance and Cosine similarity
Euclidean distance, in particular when associated with W2V seems to yield the best results in terms of divergence and convergence behavior. They seem particularly suited for analyzing distances in very large corpuses. Cosine similarity, on the other hand, is able to measure angles between vectors that connect words from two sentences to a known origin. Although it does not say anything about the distance between the words, it does seem to capture some form of divergence or convergence through a sense of “orthogonality” of the vectors. Two vectors that are orthogonal would have a “zero” cosine which can be seen as two sets of words that are very dissimilar. This approach is proving to be harder to analyze because of the potentially limited information that can be extracted. In fact, looking back to Figure 7 we can see that combining W2V with Cosine similarity yields a very stable graph of which nothing much can be deducted – this means that this particular combination may not have the necessary sensitivity to analyze this kind of problem. Combining LSA with Cosine similarity seems to yield a graph that is more sensitive to changes in words (a new word will automatically open up the possibilities of combination under LSA, hence Cosine similarity will also be more sensitive to this).
Conclusions
In conclusion, after evaluating the four different approaches, the W2V-Euc is found to be, on a preliminary analysis, the most appropriate in an educational learning environment. This approach captures some form of divergence and convergence in a way that seems reasonable and works well with the current group size in a typical educational environment. LSA, which seems more sensitive than W2V in Figure 8, may derive this higher sensitivity from the way that words are counted and how new words influence this frequency of counting.
In summary, the LSA does not seem to work well with large corpus sizes. Furthermore, LSA creates individual small corpuses from each of the student's writeups, thus there exist many small sub-corpuses for the entire class as a whole. With the increase of class size, the corpuses increase. Each of these corpuses becomes loosely correlated, and two sentences that are very dissimilar for one student may be very similar for another student, because they have independent corpuses. On the other hand, Word2Vec is capable of handling large corpus datasets (which are constant across all the students) in a relatively fast manner and associate all relationships of words into a single wordcloud. Therefore, with this single wordcloud, distances between any two given points can be calculated reliably, quickly, consistently, and comparably. Thus, any difference in the class size would not affect the distance calculation in the Word2vec model.
Future works
On the downstream procedures, both the Euclidean distance and the Cosine similarity approaches are capable of measuring divergence and convergence, although they are not directly comparable. They each capture a slightly different element of the difference between tokens with the Euclidean distance measuring the point-to-point magnitude, while the Cosine similarity measures the direction of the deviation. In future works, the authors see a potential in not comparing but integrating both downstream approaches to create a system that captures both the magnitude and direction from the data that is produced by the upstream approach. This also has the potential to capture a pattern of thought that is inherently iterative, twisting and turning as time progresses and new sentences are collected from the students.
Data availability statement
Authors will make the data available upon request.
Funding
The first author is funded under the SUTD PhD Fellowship Scholarship.
Competing interests
The author(s) declare none.
Matt Chiu Po Heng is a 3rd year PhD Candidate in Singapore University of Technology and Design at the Architecture and Sustainable Design pillar. His area of ongoing research includes data-driven design methodology, AI-enabled learning environment, data visualisation in design and strategic decision making.
Siska Kristanti Lim is a Design Innovator in Singapore University of Technology and Design at the DesignZ department. Her area of research interests includes data-driven innovation, data analysis, and artificial intelligence in education.
Arlindo Silva is an Associate Professor in Singapore University of Technology and Design at the Engineering Product Development pillar. His current research interest rests on design methods and techniques, product design and development, engineering education, creativity, materials selection methodologies, renewable composites, cost modeling and management of uncertainty in design.


 Open access