


 , major anions and cations, insoluble dust and tritium were performed every 4-6 cm along the Hercules Névé (northern Victoria Land, Antarctica) 22 m firn core. Concentration/depth profiles for H
 and dust records to obtain a reliable identification of successive annual snow layers. The time-scale obtained from the seasonally varying signals was confirmed by an absolute date obtained from the 1965 thermonuclear atmospheric bomb test tritium peak. Around 70 years (1926-94) of annual accumulation rate data were obtained from the core.
  variations recorded along the core may be ascribed to seasonal variations of this parameter related to temperature variations.
Introduction
Accumulation rate is one of the most important parameters for the evaluation of the Antarctic mass balance. Meteorological data for Antarctica belbre the International Geophysical Year (1957 58) are generally unavailable, but variations of the past accumulation rate can be obtained from seasonal records of stable isotopes, chemical species and atmospheric dust from firn and ice cores. Firn and ice cores are also one of the few tools available with which to reconstruct the past temperature variations required for evaluation of climatic changes induced by the greenhouse effect.
Reference Pourchet, Pinglot and LoriusPourchet and others (1983) observed a general increase of 30% in the accumulation rate at 14 Antarctic sites (including Vostok, Dome C, South Pole and Ross Ice Shelf) in the period 1960—75. This general trend was also observed some years later in the South Pole area, with an increase of 32% between 1960 and 1990 (Reference Mosley-Thompson, Bradley and JonesMosley-Thompson and others, 1995). Reference Peel, Bradley and JonesPeel (1992) observed an accumulation increase of 20% since 1950 at Dolleman and James Ross Islands, Antarctic Peninsula, together with a general warming of 0.07°C a−1.
In contrast, on Law Dome, Wilkes Land, East Antarctica, Goodwin (1991) and Reference Morgan, Goodwin, Etheridge and WookeyMorgan and others (1991) found a decrease in accumulation rate from 1955 to 1960, with an increase during the following period. Isaksson and others (1996) observed an accumulation-rate decrease, from 1932 to 1991, in an ice core drilled in the coastal area of Dronning Alaud Land. For the same period an increase in ![]() of 0.036‰ a−1 was measured.
of 0.036‰ a−1 was measured.
During the Ninth Antarctic Expedition of the Italian Research Programme (Programma Nazionale Ricerche in Antartide; PNRA) a 22 m deep firn core was drilled on the Hercules Névé plateau (100 km inland, 2960 m a.s.l.), 150 km north of the Italian station of Tèrra Nova Bay (fig. 1). The main characteristic of the site is the absence of katabatic winds from the plateau (personal communication from B. Stenni, 1997). Firn temperature was measured, by PT100 probe after 24 hours stabilisation, at 10 and 15 m depth. The measured values, -33.0°C and -33.1 °C, respectively, can be considered close to the mean annual air temperature of the site.
Because of the poor quality of the upper firn cores, samples for the top 1 m were taken from a 3.5 m deep snow pit dug 50 m south of the firn-core site.
The aim of this work has been to evaluate snow accumulation-rate trends in the last 70 years in the context of understanding the influence of phenomena related to global change in the northern Victoria Land area.
Methodology
The firn cores (diameter 100 mm, length 0.5-0.9 m) were recovered using a fibreglass SIPRR drilling system fitted with stainless-steel cutters. Density measurements and bulk visual stratigraphy were carried out in the field. Individual cores were scaled in polyethylene plastic bags for transport to the Laboratoire de Glaciologie et Géophysique de l'Environnement du Centre National de la Recherche Scientifique, Grenoble, France, for sample preparation. in the sample preparation, the external 1-1.5 cm of the core was removed in a mechanical lathe with a stainless-steel tool. The inner part (80-70 mm diameter) was cut every 40-60 mm in a laminar flow hood (class 100). Three subsamples were cut for analysis of chemical species (35-60 ml of melt water), stable isotope and tritium (15 35 ml of meltwatcr) and atmospheric dust (15—35 ml of meltwater). The 3.5 m snow-pit was sampled by inserting pre-clcaned polypropylene vials (18 mm diameter) in the vertical snow wall. Sample resolution in the pit is of the order of 20-25 mm (compared to 40 R0 mm in the core).
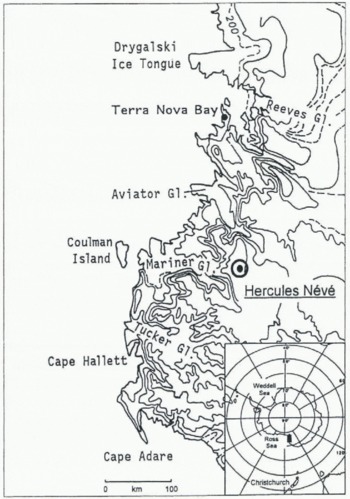
Fig. 1. Map of northern Victoria Land, showing the drilling-site location at Hercules Névé and the Terra Nova Bay Italian station.
The tritium analyses were carried out by direct liquid scintillation counting using a 1220 Quantulus© apparatus. Tritium values are given in tritium units (TU), where ITU corresponds to T/H = 10 −18 calculated at the date of the sampling (January 1994). Errors vary from 2 TU (2σ) at the background level to 6 TU at the level of 40 TU. The measurements were carried out at 0.2-0.5 m increments along the entire core length. The sampling frequency for the tritium measurements was of the same order as the annual layer thickness.
Sampling for the isotopie analysis was carried out at the same time as the chemical and dust analysis in order to compare the records. Samples were kept frozen and melted just before analysis. Measurement of the oxygen isotope composition was carried out according to the Reference Epstein and MayedaEpstein and Mayeda (1953) technique of isotopie equilibration of CO2 with water using an automatic equilibration device (Isoprep 18) on line with an Optima © VG mass spectrometer. The results are reported as δ units per mil (‰) with respect to the Vienna Standard Mean Ocean Water (V-SMOW) isotopie standard. The standard error is on average ±0.10‰(1σ) for the automatic preparation device.
The chemical samples were filtered on a pre-cleaned 0.45 mm Teflon membrane immediately after melting. A system of three Dionex ion chromatographs (4000i, 4500i and DX 500), equipped with gradient pump, low-volume conductivity detector and eluent degas module, were used to analyze the samples in The shortest possible time after melting (generally 30 min). For each sample, three ionization-cham-bcr separations were made: cations (Na+ , NH4 +, Κ+, Mg2+, Ca2+), anions (Cl− , Br−, NO3- , PO4 3- , SO4 2-) and fluoride plus organic anions (acetate, propionate, formate and methane sulphonic acid (MSA). The separation columns used for anions were Dionex AS12A (inorganic anions) or ASllA (organic anions plus fluoride). A Dionex CS12A was employed for the cations. The conditions of chromatographic separation, detection limit, range of linearity and blank control procedures are reported in Reference Piccardi, Udisti and CasellaPiccardi and others (1994), Udisti and others (1994) and Udisti (1996). H2O2 was determined by spectrofluorimetric (low analysis. The measurements were performed with an RF-551 Shimadzu spectrofluorimetric detector connected to a peristaltic pump system. Reference Hwang and DasguptaHwang and Dasgupta (1985), Piccardi and others (1994) and Udisti (1996) describe the method in detail.
Fig. 2.
Records of atmospheric dust content, the, normalized sum of trace chemical levels, ![]() and tritium level. The tritium horizon in 1965 is used as a reference for the time-scale shown on the right axis.
and tritium level. The tritium horizon in 1965 is used as a reference for the time-scale shown on the right axis.
Dust concentration and size classification were measured by liquid counting using a Coulter Counter TA2. Each sample was measured 3-5 times, and mean values were used to consti net the profile shown in Figure 2. Particle counts were split into 16 size classes (channels) of 0.3-12 μm radius. Data from the first channel, which is subject to electronic noise, were rejected. After counting, samples were filtered on Nucleopore polycarbonate filters (0.45 μm hole diameter) and kept for future analyses.
Results and Discussion
The final time-scale for the firn core was obtained by combining seasonal signal data observed in the isotopie, chemical and dust profiles, and the thermonuclear atmospheric bomb test tritium peaks were used to provide absolute dating for confirmation. The use of different seasonal parameters together with the tritium measurements has allowed us to reduce the uncertainty in the dating of the core.
Relativ e dating was obtained from three seasonal chemical indicators: HO2 as a photochemical indicator, and non-sea-salt sulphate (nssSO4 2-) and MSA as biogenic markers (Udisti, 1996). All these parameters show summer maxima and winter minima. HO2 is principally produced by photochemical processes originating from the photolysis of Os The maximum concentration of HO2 in the atmosphere is reached during the period of maximum solar radiation, i.e. late spring to late summer (Reference Sigg, Steffelbach and NeftelSigg and others, 1992). The nssSO4 2- concentration is the part of the sulphate in the ice that does not originate from sea spray. It is calculated using the formula: [nssSO4 2-] = [SO4 2-]tot, - 0.253 [Na+]. in the Antarctic summer, the principal contribution to nssSO4 2- comes from the atmospheric oxidation of dimethyl sulphate (DMS) into SO2 (Reference Legrand, Feniet-Saigne, Saltzman, Germain, Barkov and PetrovLegrand and others, 1991; Reference DelmasDelmas, 1994; Reference Saltzman and DelmasSaltzman, 1995). The nssSO4 2- annual concentration maximum is related to the period of phytoplanktonic bloom and the immediately following period (January-February). MSA is also derived from oxidative processes involving phytoplanktonic DMS, and it is an unequivocal indicator of biological marine activity (Reference Ayers, Ivey and GilletAyers and others, 1991; Legrand and others, 1991; Piccardi and others, 1994; Udisti, 1996). in order to facilitate the chemical dating, we applied a multipara-mctric method based on a linear combination of the normalised profiles of HO2 nssSO4 2- and MSA. This produces a new record (normalised sum) that amplifies the annual signal fig. 1. Well-resolved summer peaks can be observed over the full depth of the firn core, with higher values when the three parameters are in phase (normalised sum = 3).
The ![]() of both liquid and solid precipitation is essentially related to the evaporation and condensation temperatures (Reference DansgaardDansgaard, 1964) and to the isotopie composition of the atmospheric water vapour at its origin. The isotopie composition of the initial vapour, in turn, depends on the temperature, humidity and wind in the source area (Reference Merlivat and JouzelMerlivat and Jouzel, 1979). Seasonal cycles in the
of both liquid and solid precipitation is essentially related to the evaporation and condensation temperatures (Reference DansgaardDansgaard, 1964) and to the isotopie composition of the atmospheric water vapour at its origin. The isotopie composition of the initial vapour, in turn, depends on the temperature, humidity and wind in the source area (Reference Merlivat and JouzelMerlivat and Jouzel, 1979). Seasonal cycles in the ![]() profile of a core can thus be used as a dating tool by detecting summer (less negative δ values) and winter (more negative δ values) layers.
profile of a core can thus be used as a dating tool by detecting summer (less negative δ values) and winter (more negative δ values) layers.
Isotopie seasonal variations recorded in the Hercules Névé firn-core profile are well preserved despite the low accumulation of this site. Incipient isotopie homogenisation processes were observed in only a few sections of the core.
Unlike the stable-isotope and chemical records, the evaluation of seasonal cycles in the dust record is difficult. The atmospheric dust record shows two zones of relatively high concentration, 10-13.5 and 15.5-19 m fig. 2. These episodes are discussed in detail by Maggi and Petit (1997) who observe a relationship with drought events in South America. Winter-spring dust peaks were observed only in the top 10 m and from 20 to 22 m.
For most of the Hercules Névé record the normalised sum of chemical contributions and the isotopie profiles were used to provide dating. At specific points where these records fail, comparison with the dust profile was helpful in determining the year. As already observed from South Pole snow-pit data by jouzel and others (1979) and from atmospheric precipitation at Halley Bay (IAEA, 1971,1973, 1975), maximum tritium concentrations occurred during 1965-73 and 1967-73. This allows the use of these levels as reference horizons for the core time-scale.
Because the upper section of the core is missing, we fill in the top 1 m of the record with data from the snow pit. ![]() shows the good agreement between the core and pit data in the overlapping section between 1 and 3.5 m. It is possible to observe a sequence of four consecutive
shows the good agreement between the core and pit data in the overlapping section between 1 and 3.5 m. It is possible to observe a sequence of four consecutive ![]() summer peaks which correspond fairly well in the two records.
summer peaks which correspond fairly well in the two records.
Fig. 3.
Comparison between the Jim-core and snow-pit ![]() records. The good correlation between 1 and 3 m validates the use of the pit data to extend the record up to the surface.
records. The good correlation between 1 and 3 m validates the use of the pit data to extend the record up to the surface.
The high ![]() values in the top 0.5 m are taken as the 1994 summer. A visual count of the seasonal cycles gives 67±2 summer peaks in the record, corresponding to an accumulation period from 1928 to 1993.
values in the top 0.5 m are taken as the 1994 summer. A visual count of the seasonal cycles gives 67±2 summer peaks in the record, corresponding to an accumulation period from 1928 to 1993.
The quite high tritium activities (up to about 45TU) found in the core sections between 5.8 and 8.5 m are assumed to result from input to the atmosphere of artificial tritium as a consequence of the atmospheric thermonuclear explosions that occurred in the 1960s. The first marked increase of the tritium concentration at 8.4 m is assumed to correspond to 1965-66 in accordance with observations by IAEA (1971, 1973, 1975) andjouzel and others (1979). This dating also fits with the further increase around 7 m, since the atmospheric concentration from 1968 onwards, particularly between 1966 and 1973, also tends to increase. If the highest tritium value at 6.7 m is taken as 1965-66 it is difficult to reconcile the rapid decrease in the following years with the known atmospheric record.
According to the counting of seasonal peaks, however, the first tritium maximum should be referred to 1968. The discrepancy of 2 years cannot be easily reconciled and should be accepted as an uncertainty in the absolute dating of the core.
Visual stratigraphy and density profiles were made in the field during the drilling operation. The density profile shows a two-step gradient which is typical of this area (Maggi, 1996). Density values range from 340 kg m −3 at the surface to a maximum of 630 kg m−3 at the bottom of the core. The upper 10 m is characterised by a gradient of 20 kg m −15 a−1 and reaches a density of 500 kg m−3. The gradient in the bottom 12 m is 5 kg m −3a−1, reaching the maximum density at the bottom. The gradients originate from packing processes in the upper 10 m and sintering processes between 10 m and the bottom (Palerson, 1994; Maggi, 1996).
The annual accumulation-rate record from 1928 to 1993 is shown in Figure 4. The mean annual value for the entire period is 160.4 kg m −2 a−1 (table 1).
Ten-year mean accumulation rates were also calculated. These values show a progressive decrease from 206.7 kg m a−1 during the period 1931-40 to 133.4 kg m −2 a−1 during the period 1971-80. The accumulation trend shows a slight increase in the last 15 years, reaching a mean value of 147.0 kg m 2 a−1 in 1981-90. A second-order regression line was calculated in order to reduce the annual scattering. The line, shown in Figure 4, confirms the continuous decrease from the late 1920s to the 1970s and the slight increase up to the present. The comparison between snow pit and firn-core annual accumulation rates (fig. 1) shows a good correlation, not only in the shape of curve but also in the mean accumulation values: 147.0 and 148.0 kg m −2 a−1, respectively, for the 1981-90 firn core and the 1986 93 snow pit (table 1).
Fig. 4. Record of annual accumulation rate from the firn core (thin line, left and lower axes) and The snow pit ( thick line, right and upper axes). The second-order correlation line shows the general variability in the accumulation trend.
Table 1.
Mean accumulation rale and mean ![]() value for the firn core (for the entire period and decades) and the snow pit
value for the firn core (for the entire period and decades) and the snow pit
The ![]() values obtained along the 22 m firn core range between -40.5‰ and -27.6‰, with an overall mean value of -34.5‰, while the
values obtained along the 22 m firn core range between -40.5‰ and -27.6‰, with an overall mean value of -34.5‰, while the ![]() values from the snow pit range between -43.9‰ and 27.9‰, with an overall mean value of -33.9‰.
values from the snow pit range between -43.9‰ and 27.9‰, with an overall mean value of -33.9‰.
The smoothed ![]() record (11-point moving average) of the Hercules Névé core (fig. 1) suggests an increasing trend in
record (11-point moving average) of the Hercules Névé core (fig. 1) suggests an increasing trend in ![]() values toward the upper part of the record. Assuming that the
values toward the upper part of the record. Assuming that the ![]() values reflect the condensation temperatures of the precipitation, the observed increase may be related to a warming at the drilling site. The
values reflect the condensation temperatures of the precipitation, the observed increase may be related to a warming at the drilling site. The ![]() increase seems to have been fairly constant even though some fluctuations are apparent in the record. Taking into account only the overall mean annual
increase seems to have been fairly constant even though some fluctuations are apparent in the record. Taking into account only the overall mean annual ![]() values (fig. 1), there is an increase
values (fig. 1), there is an increase ![]() for the entire period (1928-93). Isaksson and others (1996) calculated a similar value (0.036 ‰a−1) for the period 1932-91 in a coastal core at Dronning Maud Land, and Peel (1992) calculated a slightly larger value (0.046 ‰ a−1) for a considerably shorter period (1958-80) at the Antarctic Peninsula. It is worth considering the peculiar shape of the curve in Figure 6 from the bottom of the core (about 1930) to the beginning of the 1960s. Two pulses in the evolution through time of the isotopie values may be observed, with minima at 1941-42 and 1959-61, re-spectively, and a quasi-sinusoidal evolution. These periodical episodes may be worth more attention, particularly in the case of recent firn cores for which the environmental conditions may be directly compared with quantitative meteorological data. Similar temporal patterns were observed in firn cores reported in a review paper by Mosley-Thomp-son (1992).
for the entire period (1928-93). Isaksson and others (1996) calculated a similar value (0.036 ‰a−1) for the period 1932-91 in a coastal core at Dronning Maud Land, and Peel (1992) calculated a slightly larger value (0.046 ‰ a−1) for a considerably shorter period (1958-80) at the Antarctic Peninsula. It is worth considering the peculiar shape of the curve in Figure 6 from the bottom of the core (about 1930) to the beginning of the 1960s. Two pulses in the evolution through time of the isotopie values may be observed, with minima at 1941-42 and 1959-61, re-spectively, and a quasi-sinusoidal evolution. These periodical episodes may be worth more attention, particularly in the case of recent firn cores for which the environmental conditions may be directly compared with quantitative meteorological data. Similar temporal patterns were observed in firn cores reported in a review paper by Mosley-Thomp-son (1992).
Fig. 5.
![]() profile (thin line) of the fun core with an 11-point moving average (thick line).
profile (thin line) of the fun core with an 11-point moving average (thick line).
Fig. 6.
Mean annual ![]() record of thefirn-care and snow-pit data with the five-point moving average (thick line).
record of thefirn-care and snow-pit data with the five-point moving average (thick line).
Conclusions
The multiparametric approach, using seasonal variations and absolute markers, provides reliable ice-core dating with low uncertainty.
The Hercules Néve firn core was dated with seasonal variation of ![]() , trace-chemical concentrations (sum of HO2, MSA and nssSO4
2-) and dust concentration, and controlled by reference to a tritium reference horizon. It has been possible to recognise 66 ± 2 years of accumulation in the record, corresponding to the period 1928-93. A 30% decrease in the annual accumulation rate has been observed from the late 1920s to the 1970s, while a 10% increase is calculated for the last 20 years.
, trace-chemical concentrations (sum of HO2, MSA and nssSO4
2-) and dust concentration, and controlled by reference to a tritium reference horizon. It has been possible to recognise 66 ± 2 years of accumulation in the record, corresponding to the period 1928-93. A 30% decrease in the annual accumulation rate has been observed from the late 1920s to the 1970s, while a 10% increase is calculated for the last 20 years.
The ![]() profile shows an increase of 0.036‰ a−1 for the time period covered by the core, suggesting a (moderate) relative temperature increase. Further studies, however, are necessary to evaluate the relationship between
profile shows an increase of 0.036‰ a−1 for the time period covered by the core, suggesting a (moderate) relative temperature increase. Further studies, however, are necessary to evaluate the relationship between ![]() and temperature in this area where deposition is characterised by high topographic variability (high altitude related to the Transantarctic Mountains) and local inputs (nearness to the coast).
and temperature in this area where deposition is characterised by high topographic variability (high altitude related to the Transantarctic Mountains) and local inputs (nearness to the coast).
Acknowledgements
The research reported here was carried out in the framework of a project on glaciology and palaeoclimatology of the PNRA, and supported by Ente Nazionale Energia e Ambiente. The authors thank the Italian Antarctic Project (PNRA) and the Ninth Antarctic Expedition logistics people for help during the drilling operations.


