Introduction
A thorough understanding of past climate is necessary to assess present-day and possible future climate changes. Valuable information about previous climate and the past composition of the atmosphere is stored in ice cores from the large ice sheets of Greenland and Antarctica. During recent decades, different deep drillings have been carried out in Greenland and Antarctica that led to substantial progress in palaeoclimatology. In the framework of the European Project for Ice Coring in Antarctica (EPICA), two deep ice cores are being drilled at present, one at Dome C (75˚06' S, 123˚21' E) and one at Kohnen station in Dronning Maud Land (DML) (75˚00' S, 0˚04' E).
One of the crucial ice-core properties for climate studies is the stable oxygen isotope ratio of the snow/ice, δ18O, since it is directly related to air temperature at the deposition site of the snow (Reference DansgaardDansgaard, 1964) and is thus used for climatic interpretation of ice cores. However, as well as air temperature, several other factors can considerably influence the annual mean δ18O value of snow and ice, such as changes in seasonality of accumulation (Reference Noone and SimmondsNoone and Simmonds, 1998; Reference Noone, Turner and MulvaneyNoone and others, 1999; Reference SchlosserSchlosser, 1999; Reference Schlosser and OerterSchlosser and Oerter, 2002a), the strength of the inversion layer, and changes in the moisture source area (Reference JouzelJouzel and others, 1997). A direct calibration of δ18O from ice cores against measured air temperature is possible only in a few exceptional cases (Reference Van Ommen and MorganVan Ommen and Morgan, 1997) due to a lack of measured air-temperature data at most (remote) drilling sites. Thus the δ18O–T relationship is usually derived spatially from measurements of the 10m firn temperature and mean δ18O values of the upper firn layers for different locations, as was done for DML by Reference GrafGraf and others (2002).
In this study, we focus on the influence of precipitation origin on the δ18O–T relationship. Changes in precipitation origin mean a change in the initial δ18O value of the evaporated water vapour and a change of transport paths of the air masses and thus of evaporation, condensation and mixing processes on the way from the oceanic source to the deposition site of the snow.
In recent years, atmospheric general circulation models (AGCMs) and trajectory models have been used to study the origin of Antarctic precipitation. Reference Delaygue, Masson and JouzelDelaygue and others (1999, Reference Delaygue, Masson, Jouzel, Koster and Healy2000) estimated the origin of Antarctic precipitation using an AGCM from the NASA/Goddard Institute of Space Studies (Reference HansenHansen and others, 1983). They investigated possible changes in moisture origin for different climatic conditions and found that during the Last Glacial Maximum (LGM) the precipitation origin was not significantly different from today, neither annually nor seasonally. The main moisture source area was calculated to lie between 30˚ and 60˚ S; a slightly increased contribution of lower latitudes during the LGM due to larger temperature gradients was found.
Reference Reijmer and vanReijmer and Van den Broeke (2001) used a trajectory model to study the origin of precipitation for the European Project for Ice Coring in Antarctica (EPICA) drilling site in DML. In particular, they calculated 5 day-backward trajectories for days with and without snowfall at arrival. Their results suggest that the most likely source region of precipitation in DML is the Atlantic Ocean between about 40˚ and 60˚ S. Reference Reijmer, van den Broeke and ScheeleReijmer and others (2002), using the same trajectory model, also investigated moisture sources for five deep-drilling locations in Antarctica. The trajectories show that the oceans closest to the corresponding site contribute most moisture.
In this study, stable-isotope data (δ18O, δ2H) from the vicinity of the German Antarctic base, Neumayer station, on the DML coast (70˚39' S, 8˚15' W), in combination with a three-dimensional trajectory model, were used to investigate the origin of precipitation in this area and its influence on the δ18O–T relationship. The station was built in 1981 and provides more than two decades of detailed glaciological and meteorological measurements. In particular, data from samples of freshly fallen snow that have been taken after major snowfall events enabled us to study for the first time the δ18O–T relationship on a time-scale of precipitation events.
The influence of different synoptic weather situations on the δ18O values of the snow at Neumayer station was investigated by Reference PfaffPfaff (1993) using a special weather-type classification for all days with snowfall. He found no significant influence of different weather types on the δ18O values of the snow, but a high correlation between the sea-ice extent and the isotope ratio. Reference WyputtaWyputta (1994) used a two-dimensional trajectory model to investigate the transport pathways of trace gases and sea-salt particles at Neumayer station.
Precipitation at Neumayer station is closely connected to cyclonic activity in the circumpolar trough (Reference Knig-Langlo, King and PettréKnig-Langlo and others, 1998). Depending on the place of cyclogenesis, air advection occurs from regions that can differ considerably for the same local wind direction. Thus a trajectory model was used to calculate the pathways of the air masses that brought precipitation to Neumayer station. Different trajectory classes were defined for three different arrival levels. The influence of precipitation origin on the quality of the δ18O–T relationship was investigated. In particular, the influence of sea-ice coverage along the transport paths was considered.
Data
Snow samples
Fresh-snow samples have been taken after major snowfall events (fresh-snow height several centimeters) since 1981. In total, 342 samples were taken between 1981 and 2000. The data density is highly variable, because sampling strategies changed over the years. Whereas originally samples were taken only after snowfall events with negligible wind influence, in order to avoid snow mixing due to snowdrift, in later years samples were also taken when snowdrift was observed during the snowfall. It was found that the wind strongly influences accumulation rates, but not the isotope ratios of the snow (Reference Schlosser and OerterSchlosser and Oerter, 2002b). The samples were stored under frozen conditions at Neumayer station and in the following summer shipped to the Alfred Wegener Institute (AWI), Bremerhaven, Germany. The isotope analyses (both δ18O and δ2H) for the years 1981– 99 were carried out at the National Research Centre for Environment and Health (GSF), Neuherberg, Germany, and for 2000 at AWI. The accuracy of the isotope measurements is 0.1% for the δ18O and 1% for the deuterium. Figure 1 shows the δ18O values of all fresh-snow samples together with the daily means of the 2 m air temperature at Neumayer station. The variability of the δ18O values is fairly high, but they show clear seasonal variations. The highest data density is found in 1997, the lowest in 1983. The δ18O data are available at www.pangaea.de.
Fig. 1. δ18O values (%Standard Mean Ocean Water) of fresh-snow samples from Neumayer station, 1981–2000, (circles) and daily means of measured 2 m air temperature (personal communication from G. Knig-Langlo, 1999) (line).
Meteorological data
Neumayer station is a meteorological observatory, where all important meteorological variables, including upper-air soundings, are measured on a routine basis. The data are available at the Meteorological Information System at AWI (MISAWI) via awi-bremerhaven.de/MET/.
In order to know the weather situations representative for each trajectory class, European Centre for Medium-Range Weather Forecasts (ECMWF) analysis fields were studied, namely surface pressure and 500 hPa geopotential height.
Sea-ice data
Information about Antarctic sea-ice concentrations is available from the National Snow and Ice Data Center/World Data Center for Glaciology (NSIDC/WDC), University of Colorado, USA (Reference Comiso, Maslanik and StroeveComiso, 1990). For our purpose, sea-ice concentrations measured by Nimbus-7 Scanning Multichannel Microwave Radiometer (SMMR) and Defense Meteorological Satellite Program Special Sensor Microwave/Imager (DMSP SSM/I) were mainly used. These data are available from October 1978 until the present with a temporal resolution of 1 day and a spatial resolution of 25 km (true at 70˚ latitude).
Trajectory Study
The trajectory model
The trajectory model used in this study was developed by the Royal Netherlands Meteorological Institute (Reference Scheele, Sigmund and van VelthovenScheele and others, 1996; Reference Reijmer and vanReijmer and Van den Broeke, 2001; Reference Stohl, Heimberger, Scheele and WernliStohl and others, 2001; Reference Reijmer, van den Broeke and ScheeleReijmer and others, 2002) to calculate air-parcel backward trajectories. The three-dimensional displacement of an air parcel during a time-step Δt is calculated using an iterative scheme:
with Δt being the iteration time-step, X 0 the position vector of the parcel at time t, Xn the nth iterative approximation of the position vector at time t + Δt and v(X,t) the wind vector at position X and time t. An iteration step of –10 min was chosen. The iteration stops when the horizontal distance between Xn and X n+1 is <300m and the relative vertical pressure difference defined as (Pn+1 – P)/Pn+1 is <0.0001.
The model can calculate isentropic, isobaric or fully three-dimensional trajectories. We use the fully three-dimensional trajectories, since they best simulate atmospheric transport processes (Reference Stohl, Wotawa, Seibert and Kromp-KolbStohl and others, 1995; Reference Kottmeyer and FayKottmeyer and Fay, 1998). As input for the trajectory model, analyses from the ECMWF numerical weather-prediction model are used. For the period 1981–93, data from the 15 year re-analysis (a uniform analysis using the same model version for the whole time period) (ERA15) are used, and for the period 1994–2000 data from the 40 year re-analysis (ERA40). Data are chosen based on their availability during calculation of the trajectories. The resolution of the input data is kept constant at 1.5˚ horizontally and 6 hours in time. Vertically, resolution changes from 31 levels for the ERA15 period to 60 levels for the ERA40 period. It is necessary to interpolate the data in time and space. The spatial interpolation is bilinear in the horizontal, and linear with log (pressure) in the vertical. The time interpolation is quadratic. For each day with fresh-snow samples available, a 5 day-backward trajectory was calculated, starting at 1200 h GMT on the last precipitation day.
Errors in the wind fields, particularly the vertical wind component, and in the interpolation of the data are the main reasons for uncertainties in the calculated trajectories. Numerical truncation errors seem to be of minor importance (Reference Stohl, Heimberger, Scheele and WernliStohl and others, 2001). However, especially in areas with low data density, as in and around Antarctica, trajectory errors can be large. After 5 days, the error can be in the order of 1000 km (Reference Kahl, Harris and HerbertKahl and others, 1989; Reference Stohl, Heimberger, Scheele and WernliStohl and others, 2001). Average errors of approximately 20% of the travel distance may be considered typical (Reference Stohl, Heimberger, Scheele and WernliStohl and others, 2001). The calculated trajectories were also cross-checked using ECMWF surface pressure maps and 500 hPa geopotential height fields. Despite these uncertainties, it is usually possible to clearly determine whether the moisture sources are located in the South Polar ocean or at lower latitudes, and whether the transport took place over ice (sea ice or inland ice) or across the open sea. Thus, if used cautiously, the trajectories are a useful tool for investigating the transport of air masses to the deposition site of precipitation.
Distribution of trajectory classes
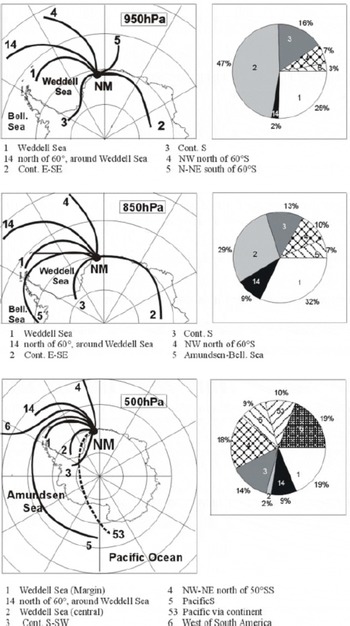
Three arrival levels were chosen, for which trajectory classes were defined by grouping trajectories dependent on the predominant flow direction: 950 hPa, the level closest to the ground (the mean surface pressure at Neumayer is 960 hPa); 850 hPa (about 1500 m), because this is supposed to be close to the condensation level; and 500 hPa (about 5 km) to get an idea of the general atmospheric flow (in meteorology, the pressure is often used as a variable to express the vertical dimension). For each arrival level, six classes were defined. For the 500 hPa level, two more classes were added. Stress was laid on differences between continental and maritime air masses and between high- and mid-latitude origins. Another important difference occurred between advection from the Weddell Sea and from the coastal areas towards the east. Trajectories that showed kinks or very sharp bends were excluded. Figure 2 shows the different trajectory classes with typical pathways for each class and arrival level. Note that the given pathways in the figure are only typical examples for each class, whereas all the trajectories of each class cover a broader range. In Figure 3 the distribution of these classes is shown. Here only days for which fresh-snow samples are available were taken into account.
Fig. 2. Trajectory classes for three arrival levels, 950, 850 and 500 hPa, and their corresponding frequency distributions. NM: Neumayer station.

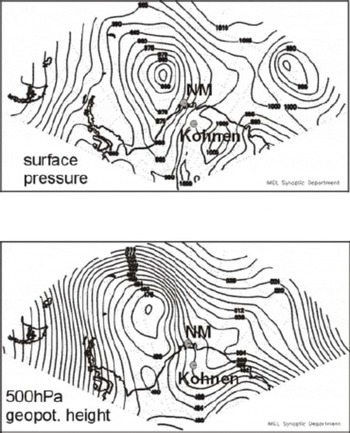
Fig. 3. Example of synoptic situation of trajectory class 4 (all levels): height of 500 hPa geopotential level and surface pressure for 2 November 1997. A low-pressure system with the corresponding deep trough at the 500 hPa level is situated to the west of Neumayer station (NM) with a strong meridional flow from northwest. ‘Kohnen’ marks the EPICA deep-drilling site in DML at Kohnen station (operated only in austral summer).
For arrival level 950 hPa, the most frequent class is class 2, connected to low-pressure systems passing north of Neumayer station, which leads to easterly winds at the base. Class 2 includes trajectories from the eastern part of the continent (still relatively close to the coast) as well as pathways from an easterly direction along or north of the coast. Trajectories of class 1 come from the Weddell Sea. Often cyclogenesis occurs east of the Antarctic Peninsula, with formation of low-pressure systems above the Weddell Sea that slowly move eastwards. Flow from the interior of the continent (class 3) is the third largest group. Class 4, a strong southward flow, has only 7% of all trajectories, but this group is important because it represents advection of warm, moist air from lower latitudes, that often can intrude deep into the interior of the continent. Class 14 is a mixture of classes 1 and 4. The air does not come from latitudes north of 50˚ S, but nor does it come from the Weddell Sea. Figure 4 shows the typical weather situation for trajectory class 4 (all arrival levels): (a) the surface pressure, and (b) the 500 hPa geopotential height. A low-pressure system is situated to the northwest of Neumayer station, combined with a deep trough at the 500 hPa level. Warm, moist air is advected from lower latitudes across Neumayer towards the interior of the continent. This class should be kept in mind, especially for the deep EPICA ice-core drilling in DML, because it can bring a large amount of the annual precipitation at the drilling site (Reference Reijmer and vanReijmer and Van den Broeke, 2001). Class 5 brings air of more local origin but does not occur very frequently.

Fig. 4. Correlation of δ18O values of fresh-snow samples and 2m air temperature at Neumayer station, 1981–2000.
At arrival level 850 hPa, the class numbers correspond to similar trajectories, except class 5, which describes trajectories originating from the Amundsen–Bellingshausen Sea. For arrival level 500 hPa, two additional classes were defined: class 6 describes pathways that start west of South America and then move south and around the Weddell Sea towards Neumayer; class 53 is a mixture of class 5 (Pacific origin) and class 3 (continental air masses from the south), which means an origin in the Pacific Ocean but then a transport right across the continent. Caution is needed in considering this class, since dynamically it is not very likely that the air is really transported over the continent, although it does happen sometimes (Reference SinclairSinclair, 1981). The more likely transport is class 5, air transport with the west-wind band around the Antarctic continent.
δ18O–T Relationship
δ18O–T relationship and its dependence on trajectory class
Figure 4 shows the correlation between the δ18O values of all fresh-snow samples and the daily mean 2 m air temperature. The correlation coefficient of r = 0.69 indicates the physically based relationship between temperature and stable-isotope content. Clear differences in the quality of the correlation were found for the different classes. Table 1 shows the correlation coefficients between δ18O values and air temperature and the corresponding δ–T gradients for all trajectory classes and arrival levels, respectively. For classes that occur less frequently, the correlation is usually low and statistically not significant (given in parentheses).
Table 1. Correlation coefficients r of δ18O values and 2 m air temperature and the corresponding δ–T gradients for the various trajectory classes and the three arrival levels 950, 850 and 500 hPa
The δ–T gradients vary between 0.43 and 0.75%K–1. The mean δ–T gradient calculated for all samples is 0.57%K–1. Lower gradients correspond to trajectories above the ocean, higher ones to trajectories mostly over sea or land ice. To be specific, maxima occur for all three arrival levels for class 3 (air masses arriving from the continent in the south), minima for class 6 (arrival level 500 hPa) and class 4 (arrival level 850 hPa)which both represent a maritime precipitation origin. For arrival level 950 hPa, only three classes show statistically significant correlations between δ18O and temperature.
Highest correlation coefficients are found for class 3 at 500 hPa and class 2 at 850 hPa, which is from the continental areas to the southwest and the east, respectively. Class 5 at 950 hPa, which corresponds to a local moisture source, also shows a high correlation coefficient. The lowest correlation coefficients are found for long trajectories, namely class 4 for all arrival levels and classes 1 and 6 for arrival level 500 hPa. Class 4 means transport from lower latitudes, thus mainly above open ocean. Classes 1 and 6 at 500 hPa are long transports from beyond the peninsula (class 1) and from west of South America (class 6).
These results imply that the amount of open water underneath the trajectory plays a role in the quality of the correlation between δ18O and temperature. During long transports above the open ocean, additional evaporation and condensation occurs that complicates precipitation history. Thus, as a next step, the sea-ice distribution along the trajectory paths was investigated.
Sea-ice distribution
The sea-ice distribution was considered for each day for which fresh-snow samples are available. δ–T correlation coefficients were calculated for different sea-ice coverages underneath the trajectories. The 850 hPa level was chosen to define different groups of the 5 day trajectories: (1) 80–100% transport over open water, (2) 80–100% transport over land or sea ice, (3) mixed sea/land ice and open water, and (4) a very typical and interesting group consisting of cases in which the trajectories started above the open water somewhere in the ocean, then crossed the Antarctic Peninsula and from there on led over the completely frozen Weddell Sea. This last group showed the highest correlation of δ18O and temperature (r = 0.69, significant at the 99% level), no matter where the trajectory was situated before the peninsula was crossed. In these cases, both the 850 and 500 hPa trajectories always originate over the open ocean and stay entirely above sea ice east of the peninsula. The correlation coefficient for group 2 (mostly over land or sea ice) is 0.61 (significant at the 99% level); for group 1 (trajectory mostly above open water) no significant correlation between isotope ratio and temperature was found.
Deuterium excess
To further investigate if there are systematic differences between the trajectory groups, for each trajectory class we calculated the mean deuterium excess d, a second-order parameter calculated according to d = δD – 8δ18O, which provides information about the precipitation origin and the meteorological conditions there, namely sea surface temperature, air humidity and wind speed (Reference Jouzel and MerlivatJouzel and Merlivat, 1984; Reference Johnsen, Dansgaard and WhiteJohnsen and others, 1989; Reference Ciais, White, Jouzel and PetitCiais and others, 1995; Reference Delmotte, Masson, Jouzel and MorganDelmotte and others, 2000; Reference StenniStenni and others, 2001; Reference Vimeux, Masson, Delaygue, Jouzel, Petit and StievenardVimeux and others, 2001). The results are shown in Table 2. Independent of the arrival levels, maximum values of the deuterium excess were found for class 3, which is connected to air advection from cold areas in the interior of the continent, whereas the minima occur for trajectory class 4, meaning a relatively warm, northern and oceanic moisture source (for arrival level 500 hPa, classes 4 and 14 show similar values, the deuterium excess being slightly lower for class 14 than for class 4). The excess values for class 2, which represents a mixture of continental and maritime air from easterly directions, lie in between the values of classes 3 and 4.
Table 2. Mean deuterium excess d and its standard deviation (SD) calculated for the various trajectory classes for the three arrival levels 950, 850 and 500 hPa

Water vapour in air that is advected from the south has, after the first evaporation in an unknown ocean area, had a long transport path with orographic lifting above the continent and finally back towards Neumayer where dynamical atmospheric processes lead to precipitation. This means that most likely it has undergone a considerably higher number of condensation processes than air that has come directly from some oceanic source, with only dynamical, but no orographic, lifting to coastal Neumayer station. The deuterium excess values are in accordance with this scenario. Compared to air masses from the ocean, air masses from the continent have lost more water vapour before arriving at Neumayer station, so 18O and 2H contents of precipitation are lower and the excess is higher. The latter can be inferred from the d–2H relationship in recent Antarctic snow (Reference Petit, White, Jouzel and KorotkevichPetit and others, 1991). In other words, more condensation processes produce higher d values. This could explain the high d values in precipitation of trajectory class 3 as well as the fairly low values for classes 4 and 14. However, the standard deviation of d is relatively high (see Table 2), so the results presented here should be treated with care.
Discussion and Conclusion
Generally, a high, statistically significant correlation was found between the δ18O value of snow and the air temperature at the deposition site using exactly dated fresh-snow samples from the vicinity of Neumayer station. The trajectory model is a useful tool for studying precipitation origin since it enables us to clearly distinguish the principal air-advection directions. The 5 day back-trajectory can show a combination of katabatic flow before the approach of a cyclone and the transport with the low-pressure system or trough, respectively, in the days immediately before and during the snowfall. For longer transports with a prevailing strong zonal flow (small meridional component), moisture transport along the whole trajectory is connected to the respective snowfall event. Thus in cases where we had to decide between two possible trajectory classes, stress was laid on the last 3 days before arrival. The calculated trajectory may not always be representative for the snowfall event and the related moisture transport. If the snowfall event occurred well before or after the start time of the calculation (1200 h GMTon the last precipitation day) in a fast-changing synoptic situation, the trajectory cannot represent the true transport path.
However, the different trajectory classes show clear differences in the δ18O–T correlation coefficients as well as the corresponding δ18O–T gradients and the mean deuterium excess values. The sea-ice coverage below the trajectory plays an important role for the evolution of the moist air mass. Between the evaporation from the ocean surface in the source area and the formation of precipitation at the measuring site, many processes can alter the isotope ratio of the moist air. Above the open ocean, it is more likely than over sea or land ice that additional evaporation occurs and the original air mass becomes enriched with new vapour. This changes the isotopic composition of the air mass and thus the δ18O–T relationship at the deposition site. Therefore for transports mainly above land or sea ice the correlation coefficients are higher than for trajectories that run mainly above open water. The very high δ–T correlation for transports over the frozen Weddell Sea could be explained by cyclogenesis above or at the edge of the sea ice with no significant additional entrainment of moist air during the movement of the cyclone towards Neumayer. The non-existent correlation for trajectories that lead entirely above open water is due to the complex precipitation history with repeated evaporation and condensation processes above ocean areas with different sea surface temperatures. When averaging over long time periods, the errors described above normally tend to cancel each other and will not have major implications for ice-core interpretation. However, when systematic changes in atmospheric circulation occur (e.g. at the transition between a glacial and a warm period), such errors are no longer negligible. In particular, for relatively warm periods with sea-ice extents equal to or smaller than today, the δ18O–T relationship found for a certain site might not be valid anymore. In the future, we will further investigate the origin of precipitation at Neumayer using the deuterium excess data in a modelling approach. The results of the presented study will be used to create a dataset consisting of the mean isotope values (δ18O, δ2H, and d) for each trajectory class, which is smooth enough to be used in a relatively simple isotope model without losing the synoptic information for the high-time-resolution isotope data.
Acknowledgements
We thank H. P. Scheele and the Royal Netherlands Meteorological Institute (KNMI) for providing the trajectory model, G. Knig-Langlo (AWI Bremerhaven) for the meteorological data, A. Schaffhauser and G. Mayr (University of Innsbruck) for the ECMWF maps, and H. Meyer (AWI Potsdam) for some isotope analyses. A. Kamelger (University of Innsbruck) helped greatly with creating software for the combined trajectory–sea-ice study. Sea-ice data were kindly provided by the National Snow and Ice Data Center, Boulder, CO, USA. Thanks are due to all winterers who did the fieldwork in Antarctica. We also thank our reviewers, B. Stenni and K. Kreutz, as well as the scientific editor, M. Frezzotti. This study receives financial support from the Austrian Science Fund (FWF; grant No. P15983-N06).