


Introduction
An understanding of glacier motion can be gained from deductions of the balance of forces in existing glaciers (Reference Whillans and van der VeenWhillans and Van der Veen, 1993, Reference Whillans and van der Veen1997). Here we conduct such an analysis of an outlet glacier in Antarctica using a dataset derived largely from repeat Landsat thematic mapper (TM) satellite images. An additional objective is to determine whether the existing dataset is adequate by considering propagation of measurement uncertainties through the force budget.
The particular application concerns the outlet glacier Jutulstraumen in Dronning Maud Land, East Antarctica. Information on its mechanics is needed for numerical modelling of ice-divide migration, and as part of the effort to provide a depth-age scale for the deep ice core to be drilled in 2000–05 for the European Project for Ice Goring in Antarctica (EPICA). Grounding-line position and ice dynamics on the seaward margin of a marine ice sheet are the most important unknowns when modelling divide migration at the interior of an ice sheet (Reference Alley and WhillansAlley and Whillans, 1984). The main discharge from Dronning Maud Land is through Jutulstraumen (Fig 1), which drains 124 000 km2. This basin constitutes about 1 % of the Antarctic ice sheet (Reference Van Autenboer and DecleirVan Autenboer and Decleir, 1978). There exist few glaciological data for the glacier. In this paper we address the dynamics between the grounding-line area and 65 km up-glacier of Jutulstraumen.

Fig. 1. Jutulstraumen, Dronning Maud Land (75°30′S, 17 ˚E to 70° S, 5° W,fwm 100–3500 ma.s.L). Elevations are from radar-altimeter data (Reference Bamber and BindschadlerBomber and Bindschadler, 1997). Contour interval is 200 m. Thick lines are boundaries of the drainage basin and the square is ERS-1 coverage (G phase, Frame 5679; orbit 13847, 10 March 1994 and orbit 13804, 7 March 1994). The grey area is where a velocity field was derived from Landsat-TM images (173/111–860124,175/ 110-850119,175/111-850119), approximately at 72°30′ Sfrom 1500 ma.s.l. to the ice shelf at 100 ma.s.l.
Data on the glacier derive from satellite imagery and field measurements. Available data are velocities obtained by tracking of crevasses in repeated Landsat-TM satellite images. Strain rates were calculated from this velocity field and from interferometric synthetic-aperture radar (SAR). Bedrock was mapped using a ground-penetrating radar (Reference Melvold, Hagen, Laumann and RolstadMelvold and others, 1997; Reference NaslundNaslund, 1997) along a longitudinal profile (profile 3, Fig. 2), and two transverse profiles (profile 1 and 2, Fig. 2). Profile 1 is located on the grounded part of the ice and profile 2 is near the grounding line. Precise global positioning system (GPS) measurements were used to collect four points of surface elevation along longitudinal profile 3. The force budget was carried out for the three sections between these four points. Some velocity measurements are available from prior work. Reference Orheim and LucchittaOrheim and Luchitta (1987) manually identified identical features in a Landsat multispectral scanner (MSS) scene from 1975 and a Landsat-TM scene from 1985 covering the coastal areas of jutulstraumen. Reference HøydalHoydahl (1996) measured stakes along profile 1 and obtained similar results to Reference GjessingGjessing (1972).

Fig. 2. Location of boxes and radar profiles, and surface elevations and glacier speed in the coastal area ofj utulstraumen. Flow direction is from left to right. All sections show the same area at the same scale. Coordinate axes in stippled lines in all sections are for a Lambert map projection. East (E) and north (N) coordinates are shown in the upper section. Boxes for calculations of force budget are drawn in all sections. The upper section labels boxes A, B and C. Ground-penetrating radar profiles are drawn with thick lines. Nunataks are shown with thin lines. The second section shows surface-elevation contours for each 100 m derived from radar-altimeter data (Reference Bamber and BindschadlerBomber and Bindschadler, 1997). The two lower sections shows × and y components of glacier velocity derived from crevasse tracking in Landsat-TM images, with isotach interval each 50 ma−1.
Forge Budget
Force-budget equations have been derived by many authors, including Reference Van der Veen and WhillansVan der Veen and Whillans (1989) who partitioned full stresses into lithostatic and resistive components. In this project, we use a simplified version by Reference Whillans and MerryWhillans and Merry (in press). In this approach the forces acting on an imaginary large box in the glacier are assessed to find the relative importance of the forces in controlling ice flow in the box. The simplification is made that strain rates are equal to surface values at all depths, but that associated stresses are important only in the upper cold portion of the glacier. Force balance of a column through the glacier can be written for a righthand coordinate system were the y axis is in the flow direction and the × axis is in the transverse direction as:

where τ dy represents driving stress, τhy is the basal drag, H’ is the mechanically-effective ice-thickness, Ryx is the lateral shear-stress and Ryy is longitudinal tension. Stresses are considered for a box of dimensions W, width transverse to flow direction and L, length along flow. Integrating Equation (1) over the width and length, the budget of forces becomes

where Fdy is driving force;
and Fhy is basal force. In subscripts are words indicating to which side of the box the quantities apply.
The stresses and forces on the sides of the box are calculated from strain rates derived from measured surface velocities. Glen’s flow law is used in the simple format (without considering effective strain rates). Lateral shear stress acting on the along-flow sides is calculated from
In the shear margin, this simple formula is a good approximation, because the effective shear stress is dominated by shearing. Longitudinal stress across the up- and down-glacier ends of the block is calculated using
Here, lateral stretching, ![]() is taken to be negligible, and indeed
is taken to be negligible, and indeed ![]() The neglect of the role of effective strain rate leads to values for Ryy
that are too small, but we learn below that these stresses play a very small role so inclusion of their effects is not a serious omission.
The neglect of the role of effective strain rate leads to values for Ryy
that are too small, but we learn below that these stresses play a very small role so inclusion of their effects is not a serious omission.
Strain rates derive from repeat satellite position measurements. Shear strain rate is calculated from
noting that ∂Ux/∂y ≪ ∂Uy/∂x so one may set ∂UZ/dy = 0. Longitudinal strain rate is

Equations (4)-(7) are the expressions needed to calculate stresses from strain rates.
The driving stress is calculated from

where ρ is ice density, g is the acceleration of gravity and h is surface elevation. The driving force is

where ![]() is average ice thickness.
is average ice thickness.
Uncertainties in strain rates, stresses and forces were estimated using the theory of error propagation for statistical uncertainties (Reference Bevington and RobinsonBevington and Robinson, 1992). Estimated errors and inaccuracies in measurements are given as the standard deviation, a, of the measurement.
Data
Velocity and strain rates are derived from satellite images. Ice thickness and surface elevations were measured during the Norwegian Antarctic Research Expedition 1996–97.
Landsat: velocity measurements by feature tracking on repeat images
The measurement method requires repeated observations of the same area. The displacement of a surface feature in the period between acquisition of the images is measured. The images must be geometrically correct, co-registered, and scaled to measure the exact displacement that has occurred on the ice surface.
Rectification of Landsat images
For Landsat-TM scenes the central projection along the scan lines places surface points with an elevation above sea level away from the projection centre in the image, and the displacement, AR, increases with an increased incidence angle (Reference Rolstad, Amlien, Hagen and LundénRolstad and others, 1997). The displacements were calculated as AR = (R/Z)AZ, where R is radial distance to the terrain nadir, Z is satellite elevation above a reference plane and AZ is terrain elevation above the reference plane.
For the Landsat-TM scenes, 16 well-distributed ground-control points (GCP) from the Norwegian Polar Institute’s geodetic reference network were registered in the images to determine a transformation from image to map, involving scale, rotation and translation. The GCP image positions were reduced according to their elevation, and displacements as large as 7 pixels were calculated. The rms error of the transformation was reduced from 2.6 pixels to 0.9 pixels (28.5 m pixel size) by this approach. The image position for ground coordinates XYZ in the SCAR Antarctic digital elevation model (DEM) was calculated using the estimated transformation, together with the calculated image distortion due to elevation as obtained from the SCAR DEM. The images were then resampled to a 20 m pixel size. Locations on nunataks with known ground coordinates not used in the adjustment could be found in the resampled scene with an accuracy of ≤ 1 pixel (20 m pixels).
An image-to-image transformation for the oriented scene to an adjacent scene, covering the ice shelf without nunataks, was determined from 16 tie points in the overlap area (rms = 0.3, 28.5 m pixel size). The adjacent scene was resampled according to the image-to-image and the image-to-map transformation, and calculated image distortions.
The one-year-separated image pair was coregistered using 10 well-distributed tie points on nunataks. Coregistration between the image pair improved significantly after the rectification, resulting in an rms error of 0.43 pixels (20 m pixels).
Landsat image-to –image cross correlation
A cross-correlation analysis was conducted on the pair of rectified coregistered Landsat-TM images from 1985–86 (Fig. 1). The correlation was estimated on a statistical basis using IMCORR software (Reference Scambos, Dutkiewicz, Wilson and BindschadlerScambos and others, 1992). Correlation estimates were conducted on TM band 4 (near-infrared). The crevasse pattern was similar from year-to-year, yielding >1000 successful matches. Mismatched vectors were identified as those with a low correlation coefficient and these were excluded automatically in the IMCORR software. Vectors that deviated in direction or length from the surrounding vectors were identified on a monitor, and the mismatched vectors were removed (Reference Bindschadler, Vornberger, Blankenship, Scambos and JacobelBindschadler and others, 1996). The vectors remaining were interpolated to a grid using inverse-distance weighting interpolation.
Results of the Landsat-determined velocity field
The correlation of Landsat-TM images (from 1985 and 1986) was successful in the crevassed areas because the crevasse pattern had not changed during the period. Isotachs of speed, derived from the interpolated grid, are shown in Figure 2. The speed increases down-glacier, up to a maximum of 830 m a"1 on the west side of Fimbul Ice Shelf. Near profile 2 the fastest speed, 800 m a"1, is on the east side of the glacier. Reference Orheim and LucchittaOrheim and Luchitta (1987) mapped 22 velocity vectors and also found the highest speed (for 1975–85) near the eastern side of profile 2, but the speed was only 744 ma−1. The difference in speed in the two studies suggests a speed-up, but it can also be due to poorer spatial resolution in the multispectral-scanner image (120m/pixel) that used by Orheim and Luchitta.
Comparison of Landsat results with stake measurements and expected accuracy of velocity field
Reference HøydalHøydal (1996) conducted GPS measurements of stakes with a 14 day repeat interval along transverse profile 1 (Fig. 3). The error in velocity was estimated to be 0.1 % for the slowly moving stakes.

Fig. 3. Icethickness (heavy line) and surface speed at transverse profile 1, between nunataks Futulrora and Nashornkalvane. Speed derived from Lands at-TMintages, and stake measurements by Reference HøydalHøydal (1996); the differences between these datasets are plotted. Ice thickness is from ground-penetrating radar. The Up–glacier side of box C is in stippled lines.
Our results along the profile were compared to Høydal’s 19 stake measurements. The maximum discrepancy is –74 m a"1, the mean value of the velocity differences is –21 m a"1 and a = 39 m a"1. From crevasse tracking we measured a maximum of 383 ma"1 at profile 1, which is somewhat less than Høydal’s maximum of 419 m a"1. The standard deviation of the differences with Høydal’s measurements represents 10% of the fastest Landsat-TM velocity (∼400ma−1) along this profile. There are few crevasses in the profile 1 area. Gridded velocities are obtained by interpolation from up to 2.5 km away. Høydal measured large short-scale velocity variations on three strain nets on this profile, therefore large discrepancies between the datasets can be expected. This comparison to stake measurements leads to a standard error for the Landsat-TM-denved and interpolated velocity field of 39 m a"1 where there are no crevasses.
Systematic errors are caused by inaccurate coregistration of the images. A systematic error does not affect the budget of force calculation which is based on gradients in velocity but we include the assessment here for completeness. We achieved rms = 10 m when determining the transformation for the coregistration. If recording geometries of images differ there will be an unsystematic error from inaccurate coregistration due to topographic distortions in the images, but because we have corrected the images geometrically this error should be zero. Other errors from the crevasse-tracking method are changed crevasse patterns and inaccurate sub-pixel determination of the position of the correlation peak, which in other studies have been found to contribute by 0.5–2 pixels (Reference Whillans and TsengWhillans and Tseng, 1995; Reference Bindschadler, Vornberger, Blankenship, Scambos and JacobelBindschadler and others, 1996). Reference Orheim and LucchittaOrheim and Luchitta (1987) were able to conduct feature tracking in an image pair over a 10 year period. Our crevasse pattern seemed unchanged during the lyear period. We consider the standard deviation of this error to be σu - 0.5 pixel/epoch-interval (σu
= 14.25 ma−1). The absolute error is ![]() , where crevasses are present.
, where crevasses are present.
Ice thickness from radar
Bedrock was mapped from a helicopter flying 30–50 m above the surface along a ∼250 km longitudinal profile (profile 3, Fig. 2) and two transverse profiles (profile l is 75 km long and profile 2 is 23.5 km long) (Reference Melvold, Hagen, Laumann and RolstadMelvold, 1997; Reference NaslundNaslund, 1997). A ground-penetrating synthetic-pulse continuous-wave radar (Reference Hamran and AarholtHamran and Aarholt, 1993) that transmits and receives electromagnetic waves in steps of 210 frequencies was used. Frequencies are evenly distributed over an adjustable bandwidth that can be set on the range from 300 kHz to 3 GHz. The following information about the radar measurements is taken from Reference NaslundNaslund (1997). Output signal was amplified to 150 W, and dipole antennas with centre frequency of 158 MHz were used. To map bedrock, the bandwidth was set to 5 MHz (157–162 MHz), so that the signal theoretically could reach 3400 m deep. The sampling interval was 0.8–1.0 s on the longitudinal profile and 0.4 s on the transverse profiles. A flying speed of 70–100 knots gave samples every 40–50 m for profile 3 and every 20 m for profiles 1 and 2.
Helicopter positions derive from kinematic GPS measurements, conducted and processed by the Department of Mapping, Norwegian Polar Institute (Reference Barstad, Eiken, Finnes and ØvstedalBarstad and others, 1997). Dual-frequency Ashtech Z-XII geodetic GPS receivers were positioned on two ground-control points on the surrounding nunataks Brekkensta and Sorhausane, which yielded a baseline never φ100 km from the closest reference and a maximum of 140 km from the most remote reference during the flight. A third receiver was mounted on the helicopter. After data processing, the radar profiles were positioned with 1 m accuracy (Reference NaslundNaslund, 1997).
GPS-navigation results and radar profiles were linked using relative time. Positions of the bed in the digital-radar data were determined by Reference MelvoldMelvold (1999) and there was little ambiguity. He estimated the ice-thickness error at 50 m.
Results from radar measurements are shown in Figures 3 and 4. For profile 1 the maximum ice thickness is 2800 m in a deep trough between the nunataks Nashornkalvane and Jutulrora. East of the deep trough is a plateau approximately 1000 m deep (Fig. 3). Along profile 2 the bed is deepest on the west side, with a maximum ice thickness of 1300 m. Thickness decreases about 200 m towards the east side (Fig. 4).

Fig 4. Ice thickness (heavy line), strain rates and surface speed at transverse profile 2, close to the grounding line. Speed is derived from Landsat-TMimages, strain rates from interferometric SAR and ice thickness from ground-penetrating radar. The up–glacier side of box A is in stippled lines.
Surface elevation
The glacier-surface elevation points were measured by GPS as described for the radar measurements. Each point was measured over a 10 s interval at a sampling rate of 1 s. The standard deviation of elevation error after processing is 0.05 m. In addition there is a 0.19 m uncertainty in antenna height on the helicopter relative to the snow surface. The total uncertainty is 0.2 m.
Application of Force Budget
Reference HøydalHøydal (1996) calculated temperature throughout the ice thickness based on surface measurements of temperature and modelling along profile 1. His example for a 900 m thick section is representative for sections in our boxes. The temperature is much higher in the lowest 150 m (std error 85 m). This warm ice is weaker and less likely to contribute substantially to the budget of forces. The mean temperature of the ice above the lowest 150 m thick ice is –19°C.
The rate factor at –19°C is B = 500 (50) kPa a1/3 (Reference HookeHooke, 1998). We increase the uncertainty to 100 kPa a1/3 to account for uncertainty in temperature.
The effective ice thickness was calculated as H’ = H - 150 m, based on the work by Reference HøydalHøydal (1996). The uncertainty in H’ comes from uncertainty in ice thickness and in determining the thickness of the soft bottom layer. This leads to a total uncertainty of effective thickness of 100 m.
Selection of boxes
Several criteria were included in selecting boxes. The boxes should be placed where there are sufficient measured strain rates to estimate the mean value of the stress on each side. Boxes should cover sections that are glaciologically interesting. Accurate elevations are necessary for the boxes, since incorrect surface slopes give large errors in the driving stress, and therefore inaccurate determination of the relative role of the driving and basal forces. The boxes were placed in along-flow positions where accurate GPS measurements of elevation and length of the box, L, were available.
Our three boxes cover from one-third to one-half of the eastern side of the glacier (Fig. 2); the grounding-line area and ∼ 6 5 km further up-glacier.
The east and the west sides of the boxes are placed where ![]() are well determined. The western sides of the boxes are placed along the central flowline because the shear strain rates,
are well determined. The western sides of the boxes are placed along the central flowline because the shear strain rates, ![]() are zero. The central flowline was determined from the velocity field from Landsat and the fringe pattern in the interferogram. The eastern sides of boxes A and B were placed within the high shear zone as identified in the interferogram and in the coherence image (Fig. 5).
are zero. The central flowline was determined from the velocity field from Landsat and the fringe pattern in the interferogram. The eastern sides of boxes A and B were placed within the high shear zone as identified in the interferogram and in the coherence image (Fig. 5).

Fig. 5. Forces calculated for boxes A, B and C The units of the numbers are 1012 N Background is the coherence image processed from ERS-1 data.
Strain rates
Strain rates were calculated from the gridded Landsat-TM velocity data (spacing 0.5 km). The longitudinal strain rates, ![]() were calculated over distances of 20 km and shear strain rates,
were calculated over distances of 20 km and shear strain rates, ![]() over distances of 10 km. We assume the poorest accuracy of the velocity (39 ma−1) when calculating errors. Along each side of the boxes, 10–20 values (each ∼2.5 km) of strain rates were derived from the appropriate grid, and average strain rates
over distances of 10 km. We assume the poorest accuracy of the velocity (39 ma−1) when calculating errors. Along each side of the boxes, 10–20 values (each ∼2.5 km) of strain rates were derived from the appropriate grid, and average strain rates ![]() and
and ![]() are listed for all boxes in Table 1.
are listed for all boxes in Table 1.
Table 1. Measurements and average strain rates for sides of boxes (with uncertainties in parentheses)
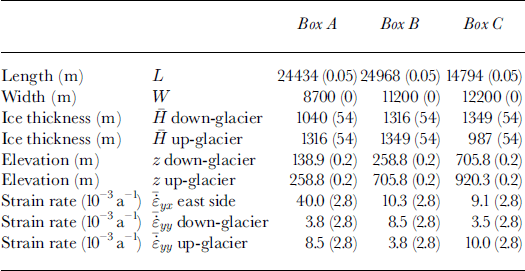
A different approach was taken for the along-flow side of box A. Since the Landsat-TM velocity data do not cover the shear margin in that area, we used a European Remote-sensing Satellite (ERS)-l three-day repeat-pass interferogram (Fig. 1) to derive ![]() along profile 2 (Fig. 4), which is the down-glacier part of box A. The interferogram was processed by the Norwegian Defence Research Establishment (Reference Andersen, Aksnes and SkonnordAndersen and others, 1998; Reference EldhusetEldhuset and others, 1998). From the interferogram we found
along profile 2 (Fig. 4), which is the down-glacier part of box A. The interferogram was processed by the Norwegian Defence Research Establishment (Reference Andersen, Aksnes and SkonnordAndersen and others, 1998; Reference EldhusetEldhuset and others, 1998). From the interferogram we found ![]() at the down-glacier side, and
at the down-glacier side, and ![]() was extrapolated from the Landsat-TM data for the up-glacier side. Since the entire length of box A is placed in the high-shear margin (Fig. 5), we assume that the shear stress increases linearly down-glacier and therefore can be described by two values.
was extrapolated from the Landsat-TM data for the up-glacier side. Since the entire length of box A is placed in the high-shear margin (Fig. 5), we assume that the shear stress increases linearly down-glacier and therefore can be described by two values.
Results from force budget
Stresses given by Equations (4), (5) and (8) were calculated from all the measured strain rates. Average stresses were used when calculating forces, and the stresses with uncertainties are listed in Table 2. Basal drag, τhy, was calculated from the force budget, Equation (2), and the results in Table 3.
Table 2. Stresses computed from numbers in Table 1 (with estimated uncertainties in parentheses)
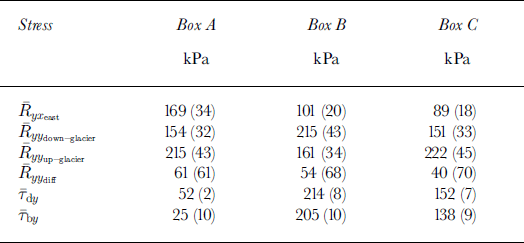
Table 3. Calculated forces (with estimated uncertainties in parentheses). Comparison to driving force is given as per cent of driving force. Negative values indicate resistance to the driving stress

Table 3 lists the values calculated using the force budget (Equation (2)). Forces are also given as percent of Fdx. Results from the force budget are illustrated in Figure 5.
The role of the lateral drag is important for section A where it represents 38 (17) % of Fdy but for the grounded sections B and C it represents only 5 (2)% of Fdy. Basal friction supports only half the driving stress in section A, where surface slope and driving stress are small. This section of the glacier must be partly floating, basal friction is small and flow is controlled by lateral drag from the shear margins. The force balance in section A is similar to that found for the ice streams feeding Ross Ice Shelf Reference Jackson and KambJackson and Kamb, 1997; Reference Whillans and van der VeenWhillans and van der Veen, 1997), since ice is sliding on a low-friction bed and flow is controlled by shear stresses exerted from the margins. The cases differ since basal drag at Ice Stream B is ∼ 2 kPa, compared to ∼ 2 5 kPa atjutulstraumen.
Differential longitudinal forces play a small role for all sections, and especially for both of the grounded upper sections. Calculated differential forces are small and smaller than the uncertainties. Considering estimated uncertainties and forces, there is confidence in longitudinal forces being 9 (6) % of Fdy for box A and 0 (4) % of Fdy for grounded sections B and C. Small differential longitudinal force compared to the basal drag is in agreement with what has been modelled for ice sheets by Reference AlleyAlley (1984) and Reference Lingle and TroshinaLingle and Troshina (1998). Alley found that longitudinal stresses increase towards the coast, yet are less than 1 % of the basal shear stress.
Driving stress and basal shear are large for both grounded sections B and C, but largest for the midsection B. Surface slope in section B is 1 and average ice-thickness is 1332 m, and for section C slope is 0.8 and average ice thickness is 1168 m. The large basal friction found in the mid-section may be due to a ∼ 3 0 0 m peak in the bed topography in the middle of section B in flow direction.
The grounding-line position has not been determined accurately for Jutulstraumen. Where the glacier is floating the basal friction must be zero. We found τhy = 25 kPa for section A, but this is an average value for the entire section. Since the results show some basal friction in section A, we suggest that the grounding line is in the section, but farther up-glacier than profile 2.
Contributions to uncertainties
The relative importance of the forces for a box determines which measurement uncertainty is critical to the calculations. For the grounded sections (box B and C) more than 95% of the driving force is balanced by basal friction. Driving stress and driving force are described by Equations (8) and (9). The measurement uncertainties involved in these equations are in average ice thickness and surface elevation. Error propagation of the driving force showed that uncertainty in average ice thickness contributed >97% of the estimated uncertainty in the basal force.
For box A, 38% of the driving force is balanced by lateral force. In this floating section, the main contribution to the uncertainty in the basal force is from the lateral force. Lateral force and stress are given by Equations (2) and (4). Measurement uncertainties are from the velocities used for strain rates and the rate factor in Glen’s flow law. The error propagation showed that the rate factor contributed >85% of the uncertainty in the basal force.
The largest uncertainty in basal force is found for box A, representing 19% of the driving force, whereas the uncertainty is only 5% for box B, and 6% for box C. Repeat measurements will reduce the mean uncertainties of the forces calculated from stresses. Uncertainty in shear stresses can be reduced by more observations of the strain rates in the interferogram. This would reduce the uncertainty in the basal force in particular for section A. More GPS elevation and ice-thickness measurements are necessary to reduce the mean uncertainty of the driving stresses for all boxes.
Position and dimensions of boxes
Because stresses vary over the glacier, the results can be sensitive to the position and size of the boxes selected. Forces were calculated from the range of measured stresses Ryx
and Ryy over the sides for each box. We found that stress variation over the sides would yield force variation representing a maximum of 8% of Fdy for each box. The final result can therefore be somewhat different if the section was separated into smaller boxes where ![]() and
and ![]() have other values. Additional measurements of surface elevations for driving stress are needed to conduct a force budget for smaller boxes.
have other values. Additional measurements of surface elevations for driving stress are needed to conduct a force budget for smaller boxes.
Conclusions
The strain rates calculated from remotely sensed velocity data are sufficiently accurate for a large-scale force budget, and can be used for a detailed study of the mechanics of Jutulstraumen. The accuracy of the dataset as a whole is adequate to determine that longitudinal and lateral forces play a minor role in controlling ice flow for the grounded part of jutulstraumen studied. For the floating part, lateral drag is important as resistance to flow. The main limitation of the dataset lies in the uncertainty of ice thickness for determining driving stress for the grounded part, and uncertainty in the rate factor for determining lateral stresses for the floating part. Since average stresses are considered for the large-scale force budget, uncertainties given by the mean error of the stresses can be reduced by repeating necessary measurements. For lateral stress this can be done by deriving more strain rates from the interferogram. For the driving stress, accurate GPS measurements of glacier-surface elevations and ice thickness are necessary.
Acknowledgements
G.J. van der Veen contributed with helpful comments on the manuscript. We thank the Norwegian Defence Research Establishment for processing of the ERS-1 SAR data. The "Monitoring Ice Velocities in Jutulstraumen, Antarctica" project was funded by the Norwegian Research Council.


