Introduction
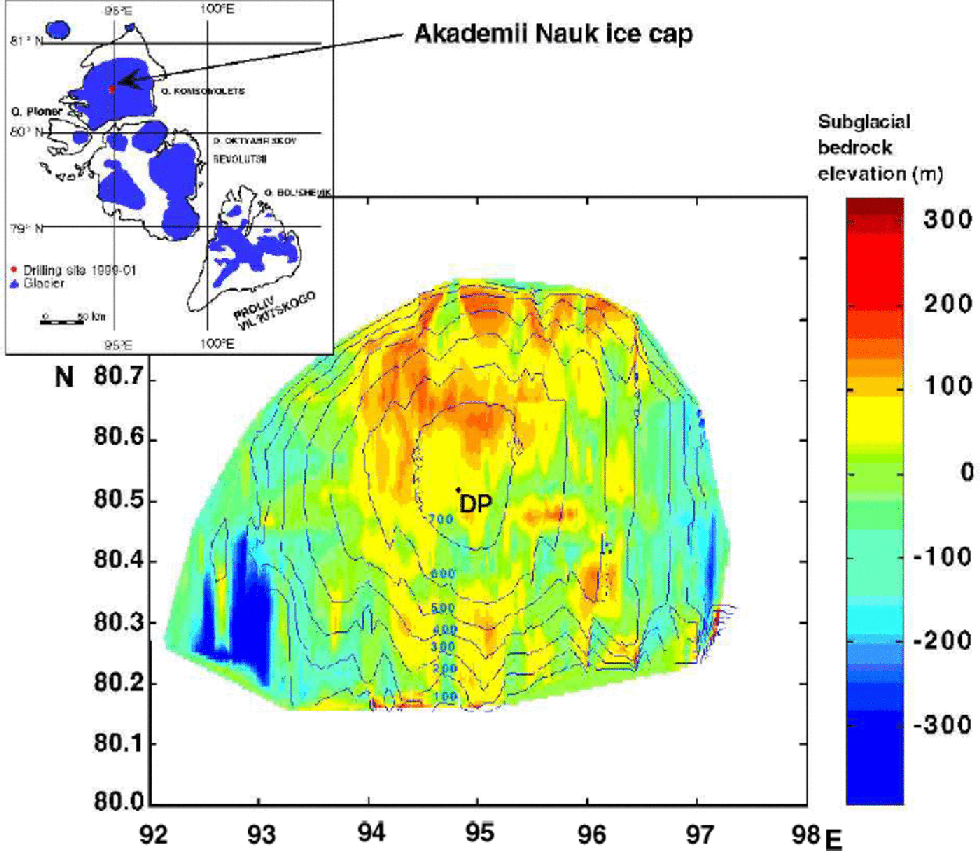
In the Eurasian Arctic, Severnaya Zemlya is the most eastern archipelago that is covered by a considerable ice cap. Akademii Nauk ice cap on Komsomolets island is the thickest and coldest on Severnaya Zemlya. Some earlier ice-core studies show that a continuous climate record covering the whole Holocene period could only be obtained on Severnaya Zemlya from this ice cap (Reference Klement’yev, Potapenko, Savatyugin and NikolaëvKlement’yev and others, 1991). In 1986/87 the first and only ice core (761m) was drilled to bedrock on Akademii Nauk ice cap (Reference Klement’yev, Korotkovand and NikolayevKlement’yev and others, 1988; Reference Savatyugin and ZagorodnovSavatyuginand Zagorodnov, 1988). Investigations were carried out on this core with relatively low data resolution, and the potential of time resolution of the proxy data was uncertain. for this reason, a new ice-core drilling was started in May 1999 as a joint project of the Alfred Wegener Institute, Germany, the Arctic and Antarctic Research Institute, Russia, and the Mining Institute, Russia. the device used is the KEMS electromechanical ice-core drill, the same type used at Vostok station, Antarctica. A suitable drilling site was found at 80˚31’N, 94˚49’ E (Fig. 1) with the help of airborne radio-echo sounding data and synthetic aperture radar interferometry studies (Reference DowdeswellDowdeswell, 1999). the radar-measured ice thickness is approximately 720m in this location. In 1999, the first 53.95 mof core were drilled, in 2000 the project was continued to 504.77 m, and in 2001 the drill reached the moraine at 723.91 m depth. A temperature of –10.2˚C was measured in April 2000 at 10 m depth.

Fig. 1 Map of Akademii Nauk ice cap with surface and subglacial bedrock elevation and drilling site DP (ice thickness after Reference DowdeswellDowdeswell, 1999).
137Cs and 210Pb Radioactivity
Analyses of 137Cs and 210Pb radioactivity have been carried out by Pinglot on samples of chips from the cutters retrieved from each run of the first 54m of the 1999 drilling (weight 1–2 kg). In April 2000 a 13.83m shallow core (SZ 2000-1) was drilled for determination of the radioactivity at a higher depth resolution. the samples for the radioactivity measurement were melted. After chemical preparation, the meltwater was filtered through ion exchange filters. Each filter sample was analyzed by low-level g-spectrometry. Final values of the radioactivity were calibrated using international standards. Details of the technique were published in Reference Pinglot and PourchetPinglot and Pourchet (1995).
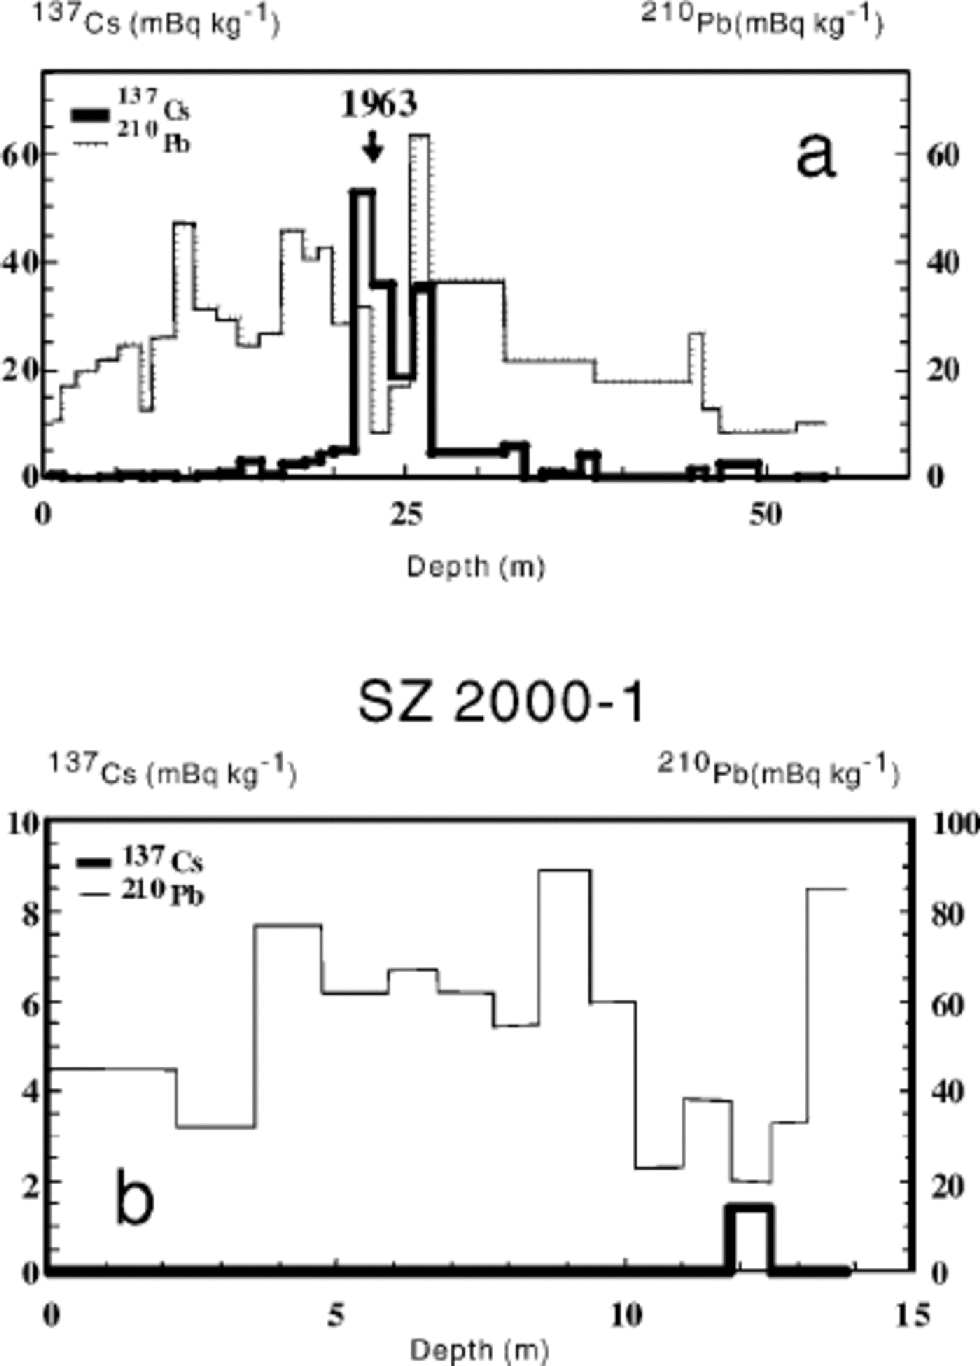
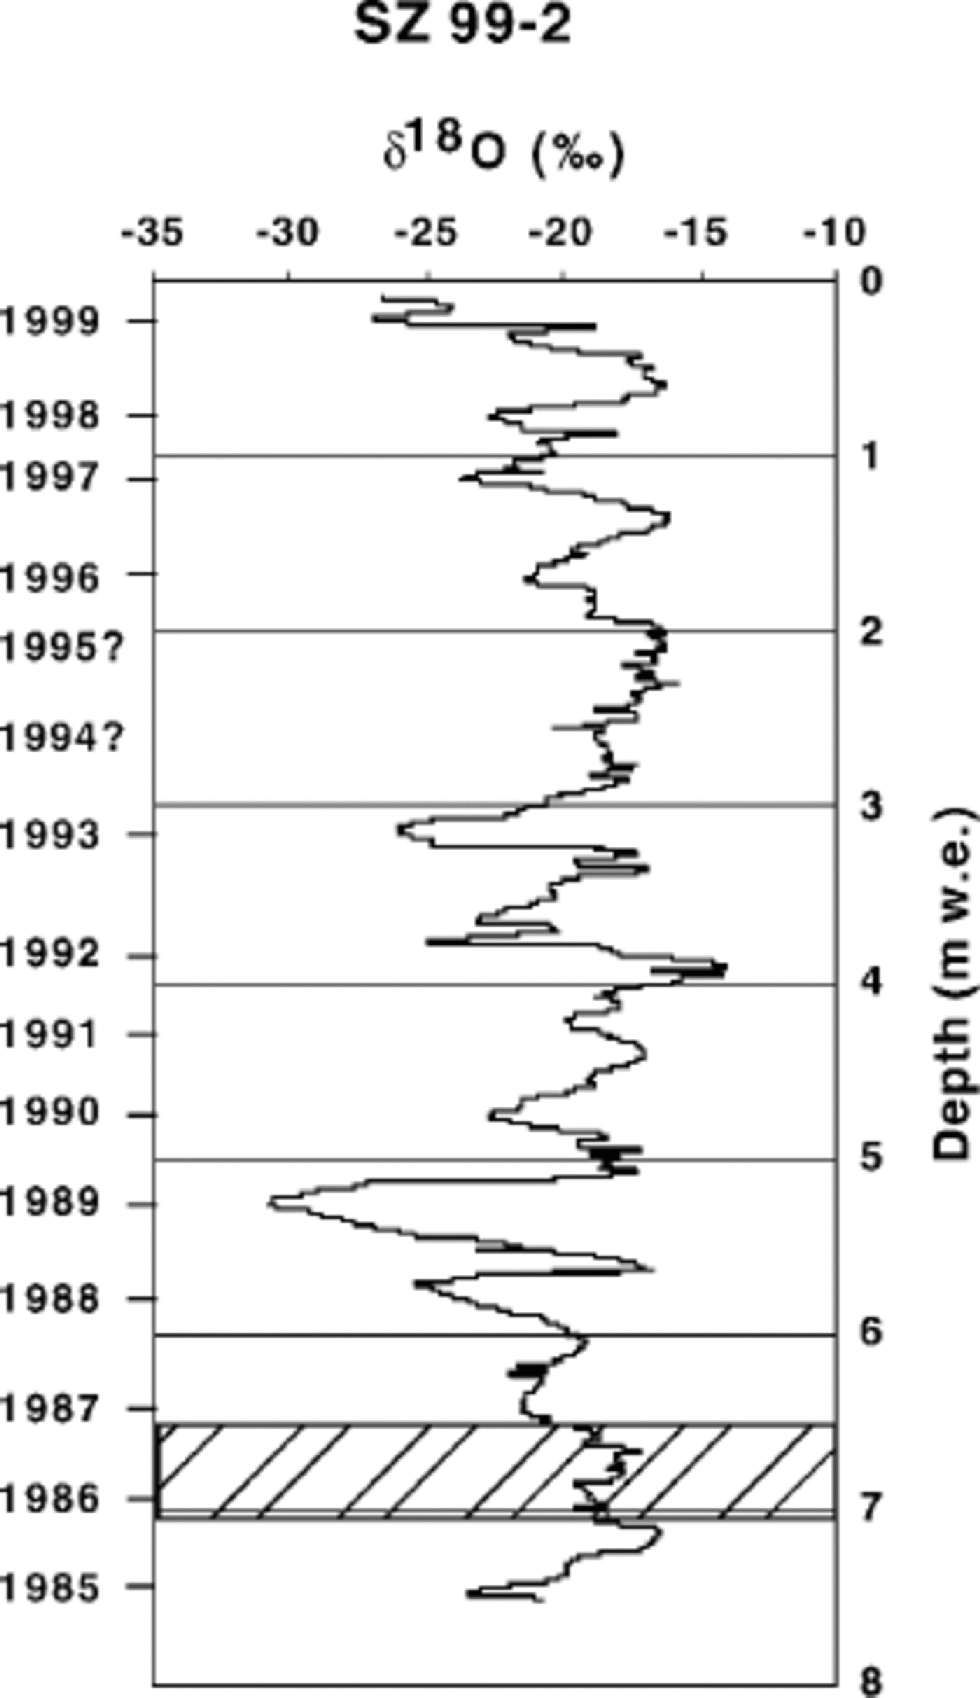
The maximum in 137Cs activity occurred in 1963 and corresponds to the maximum rate of deposition from the atmospheric nuclear test series conducted in 1961 and 1962. the absolute maximum is found at a depth of 21.36 –22.68 mrelated to the 1999 surface (Fig. 2a). It corresponds with a deposition rate of 420 Bqm–2,which is slightly higher than the mean value from Svalbard glaciers. In the shallow core SZ 2000-1 the only occurrence of 137Cs is at depths of 11.81–12.51m related to the AD 2000 surface which corresponds with a deposition of about 1Bqm–2 (Fig. 2b). Presumably this signal is caused by the Chernobyl accident on 26 April 1986. the mean annual net mass balance is calculated to 53±2 g cm–2 a–1 following this assumption. This is in good agreement with the value of about 45 g cm–2 a–1 calculated from the 1963 layer (Fig. 2a) taking into account the low resolution of chip samples only taken from each run. Both values correspond to the annual mass balance visible in the δ18O profile (Fig. 3).

Fig. 2 Profiles of 137Cs and 210Pb activity on samples of chips from main drill (a) and of the shallow core SZ2000-1drilled in April 2000 (b).

Fig. 3 δ18O profile of the shallow core SZ 99-2. the marked horizon refers to the actual measured layer with increased 137Cs activity in shallow core SZ 2000-1 (Fig. 2b).
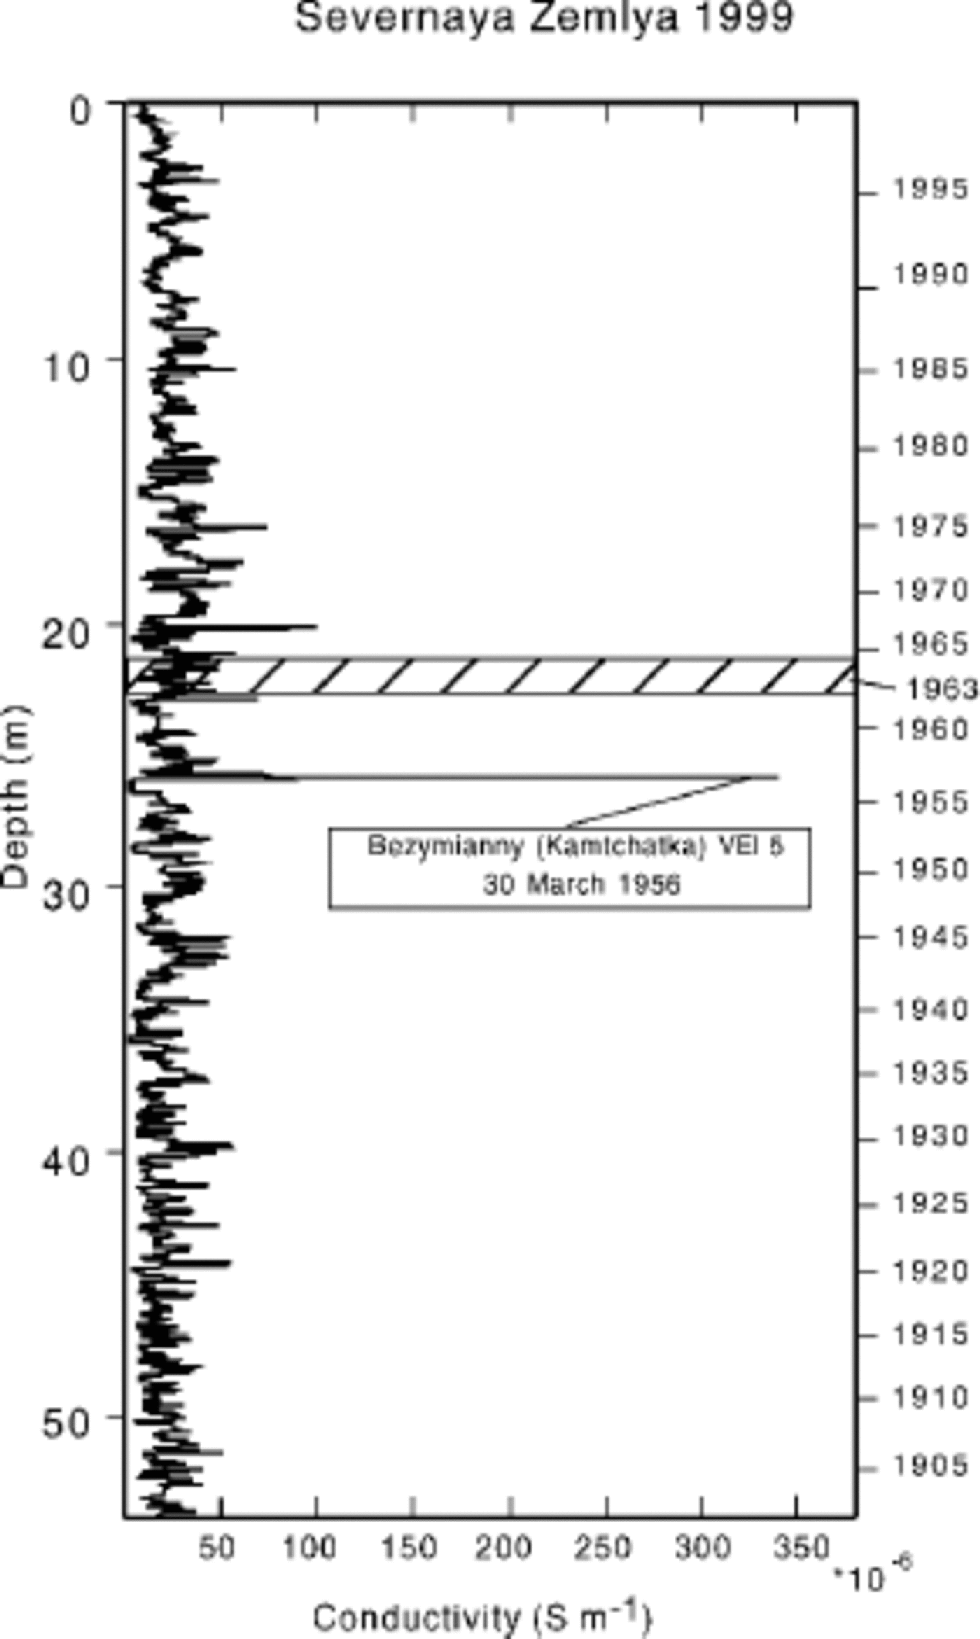
The activity of the natural radioisotope 210Pb (22 year half-life) is almost stable from the surface down to about 30 m. Then the activity decreases. This could indicate a decreasing trend of the 210Pb flux over the last 100 years, also found in Greenland (Reference Dibb and B. ClausenDibb and Clausen, 1997). At depths of 25.47–26.75m, there is a high level of 210Pb activity. This is the same depth at which a significant peak is found in the electrical conductivity profile, assumed to be caused by a volcanic event. the increased 210Pb radioactivity may be related to increased dust indicated by increased ion content found in this horizon (personal communication from K. Weiler, 2001). Another possible interpretation is that due to summer melting the 210Pb particles migrate to deeper firn layers and are stopped there by an ice layer, leading to an enrichment of 210Pb in these layers.
Electrical Conductivity (DEP)
The main core and all shallow cores drilled within the project on Severnaya Zemlya are analyzed by non-destructive methods. for profiling density and dielectric properties a combined analyses bench developed by Wilhelms is used (Reference WilhelmsWilhelms, 2000). the optical transparency is measured by a line-scan camera system giving the possibility for a quantitative detection of melt-ice percentage found to be 40–50% in the top part of the core.
Data of electrical conductivity (dielectrical profiling (DEP)) determined in the upper 54m of the main core are shown in Figure 4. the preliminary time-scale given here is made using the horizon of 137Cs activity, which is taken as the year 1963 (marked in Fig. 4). the time-scale is calculated with a mean annual net mass balance of 50 g cm–2 a–1 for lower parts of the core. the most significant peak in the electrical conductivity record is found at depths of 25.65–25.94m. We assume that it is caused by the eruption of the Bezymianny volcano, Kamchatka, on 30 March 1956, which at this time was the only one with a volcanic explosivity index (VEI) of 5 (Reference Newhall and SelfNewhall and Self, 1982). This interpretation corresponds with our suggested time-scale. on the other hand, the VEI 6 eruption of Katmai, Alaska, on 6 June 1911 is not clearly visible in the record. Percolation effects can possibly also produce high levels of electrical conductivity. Detailed chemical investigations will be carried out in core sections with increased electrical conductivity.

Fig. 4 Electrical conductivity (DEP) record with preliminary time-scale.
Stable Isotopes
Analyses of δD and δ18O are made for the shallow core SZ 99-2 drilled in May 1999 near the main drilling site. the δ18O profile is plotted vs depth in mw.e. calculated using the gamma density profile of the core (Fig. 3). the annual net mass balance is readable directly in this representation if seasonal signals can be obtained. In case signatures are eroded by percolation and refreezing, the number of missing years can be estimated by assuming a mean annual net mass balance as we did for 1994 and 1995. the marked horizon refers to the respective layer with the increased 137Cs activity in shallow core SZ 2000-1, taking into account the accumulation of 1999/2000. the age–depth relation in the δ18O data is in good agreement with the result of the 137Cs activity measurement. the isotope pattern is smoothed by infiltration water, but the winter minimum is preserved in almost every year.
Conclusions
The accumulation zone of Akademii Nauk ice cap is characterized by processes of summer melting. However, the δ18O record of a shallow core shows clear seasonal signals almost every year, and horizons with artificial radioactivity are detectable. Thus the climate signal could be retained with almost yearly resolution, at least for the upper part of the core. the development of time-scales seems to be possible using isotope signatures and time markers like radioactive and volcanic tracers. Compared with other Arctic glacial areas of high melt (Reference KoernerKoerner, 1997) the situation for paleoclimatic reconstructions seems to be promising.
The recent mean annual net mass balance is about 50 g cm–2 a–1 in the central area of the Akademii Nauk ice cap. This value comes from isotope stratigraphy and from the increased 137Cs radioactivity from atmospheric nuclear tests and the Chernobyl disaster. It is in the order of the mean annual net mass balance of 43–44 g cm–2 a–1 observed by Zagorodnov with structural-stratigraphic methods for Akademii Nauk ice cap (Reference Zagorodnov, Klementyev, Nikiforov, Nikolaëv, Savatyugin and SasunkevichZagorodnov and others, 1990).
Acknowledgements
This project is funded by the German Ministry of Education and Research. It is jointly supported by the Alfred Wegener Institute for Polar and Marine Research and the Arctic and Antarctic Research Institute, Russia, and logistically organized by the firms ECOSHELF and Polar Routes, St Petersburg, Russia. We want to thank the drillers of the Mining Institute, St Petersburg, for their skills.


