


Introduction
Climate change presents new challenges for waterbird conservation. A growing body of evidence shows that many waterbirds are already changing their distributions in response to climate change (e.g. Maclean et al. Reference Maclean, Austin, Rehfisch, Blew, Crowe, Delany, Devos, Deceuninck, Günther, Laursen, van Roomen and Wahl2008, Lehikoinen et al. Reference Lehikoinen, Jaatinen, Vähätalo, Clausen, Crowe, Deceuninck, Hearn, Holt, Hornman, Keller, Nilsson, Langendoen, Tománková, Wahl and Fox2013, Amano et al. Reference Amano, Székely, Wauchope, Sandel, Nagy, Mundkur, Langendoen, Blanco, Michel and Sutherland2020), and that their wetland habitats are also exposed to climatic changes (e.g. Winter Reference Winter2000, Junk et al. Reference Junk, An, Finlayson, Gopal, Květ, Mitchell, Mitsch and Robarts2013, Mitchell Reference Mitchell2013). One of the early international conservation frameworks, the Convention for the Protection of Migratory Birds in the United States and Canada, was established for birds in 1916. No other group of birds has such strong institutional frameworks for its conservation (Boere and Rubec Reference Boere, Rubec, Norris and Pain2002). Wetlands are the focus of the first global biodiversity treaty: the Ramsar Convention on Wetlands of International Importance especially as Waterfowl Habitat, adopted in 1971 (Ramsar Convention 1994). The 1999 Strategic Framework and guidelines for the future development of the List of Wetlands of International Importance set the long-term target to identify and include in the List all wetlands that meet Criteria 5 and 6 for waterbirds (paragraphs 82 and 87 in Ramsar Convention 1999) and this target was reiterated in Resolution X.22 (Ramsar Convention 2008).
Within the African-Eurasian flyways, this habitat-focused approach has been augmented by species conservation measures under the Agreement on the Conservation of African-Eurasian Migratory Waterbirds (AEWA), concluded under the auspices of the Convention on Migratory Species in 1996. Migratory waterbirds also receive special attention in relation to the designation of Special Protection Areas under the provisions of Article 4 of the EU Birds Directive. A common characteristic of these instruments is that they all aim to establish a coherent and comprehensive network of sites for the long-term conservation of waterbirds, although none have processes to assess whether this objective has been achieved.
Increasing evidence of predicted and observed changes in waterbird species’ distributions under climate change led to Contracting Parties of AEWA recognising the importance of securing a climate-resilient flyway sites’ network (AEWA 2008) and the need for climate change adaptation (AEWA 2012, 2015). The “climate-change vulnerability” of AEWA–listed waterbird species has been assessed previously using data on population size, range extent, range fragmentation, habitat association and food sources (Maclean et al. Reference Maclean, Rehfisch, Delany and Robinson2007). However, these traits describe only the sensitivity, i.e. the intrinsic factors that can moderate or exacerbate the impact of external factors associated with climate change (Foden et al. Reference Foden, Young, Akçakaya, Garcia, Hoffmann, Stein, Thomas, Wheatley, Carr, Hole, Martin, Pacifici, Pearce-Higgins, Platts, Visconti, Watson and Huntley2019). Planning and prioritizing climate change adaptation measures also requires understanding the exposure of waterbird populations and their key sites to climate change, i.e. the nature, magnitude and rate of climatic and associated environmental changes (Foden et al. Reference Foden, Young, Akçakaya, Garcia, Hoffmann, Stein, Thomas, Wheatley, Carr, Hole, Martin, Pacifici, Pearce-Higgins, Platts, Visconti, Watson and Huntley2019).
The exposure of migratory waterbird species to climate change has been assessed using species distribution models (SDM) to project changes in their breeding distributions in both Europe and Africa (Huntley et al. Reference Huntley, Green, Collingham and Willis2007, Hole et al. Reference Hole, Willis, Pain, Fishpool, Butchart, Collingham, Rahlbek and Huntley2009), but exposure during other stages of the annual cycle, during the passage and wintering seasons, has only been considered nationally (e.g. Johnston et al. Reference Johnston, Ausden, Dodd, Bradbury, Chamberlain, Jiguet, Thomas, Cook, Newson, Ockendon, Rehfisch, Roos, Thaxter, Brown, Crick, Douse, McCall, Pontier, Stroud, Cadiou, Crowe, Deceuninck, Hornman and Pearce-Higgins2013). In addition, the distribution of waterbirds may depend not only on local climate but also on the presence of wetland habitats. The extent and ecological character of wetlands strongly depend not just on local climate, but also on climatic conditions and human activities including water use upstream. Species distribution models based on climatic variables only are not able to take into account upstream hydrological processes which may be more important for migratory waterbirds than local climatic changes especially at large flood-pulse wetlands in arid climates that are particularly important for waterbirds, e.g. the Inner Niger Delta, Lake Chad, the Sudd (Zwarts et al. Reference Zwarts, Bijlsma, van der Kamp and Wymenga2009), the Okavango Delta (Ramberg et al. Reference Ramberg, Hancock, Lindholm, Meyer, Ringrose, Sliva, Van As and VanderPost2006), etc.
In this paper, we provide the most comprehensive assessment to date of potential climate change impacts on AEWA-listed waterbirds by the year 2050 through: (i) modelling the exposure of populations to both predicted changes of climatic parameters, such as temperature and precipitation, and changes in wetland extent influenced by upstream hydrological processes, throughout their migratory flyways, and (ii) use these results to identify focal areas for adaptation measures.
The geographic scope of this analysis is the AEWA Agreement Area, which is defined in Annex 1 of the AEWA Agreement Text (UNEP/AEWA Secretariat 2018), from which areas west to 25oW longitude (Greenland and Canada) and north to 78.5oN latitude (parts of Svalbard, Franz Joseph Land and Severnaya Zemlya) were omitted because of the incompleteness of some environmental predictors in these regions.
Methods
As our aim was to identify general patterns across the species suite and geographic extent covered by AEWA, we used statistical species distribution models (SDMs; e.g. Guisan et al. Reference Guisan, Tingley, Baumgartner, Naujokaitis-Lewis, Sutcliffe, Tulloch and Buckley2013, Reference Guisan, Thuiller and Zimmermann2017). Although mechanistic models can be more realistic than SDMs for well-studied species in data-rich situations, their data requirements are difficult to fulfil in cases where large numbers of species are to be investigated (Pearce-Higgins and Green Reference Pearce-Higgins and Green2014), as is the case in this study. When applied across large numbers of species, SDM approaches to climate change vulnerability have been shown to have significant predictive power (Wheatley et al. Reference Wheatley, Beale, Bradbury, Pearce-Higgins, Critchlow and Thomas2017). We provide an outline of the study methodology in Figure S1 in the online supplementary material and a technical description below.
Species selection
We produced species distribution models for 197 species for at least one season, from the 255 waterbird and seabird species listed in Annex 2 of AEWA. The 58 species not modelled were mostly (i) seabirds (44 species) that are more likely to be affected through sea-level rise and disruptions to the marine food chain which are best modelled separately, (ii) species that are quasi-extinct (two species) or (iii) occur only marginally in the Agreement Area (two species), or (iv) species not associated with wetlands, mainly occurring in agricultural areas, grasslands, or forests (10 species).
Bird data
We used a total of 1,029,468 bird observation records for the period 1990–2016, from structured monitoring schemes such as the International Waterbird Census (Wetlands International 2019), timed counts for the Russian Breeding Bird Atlas (Kalyakin and Voltzit in prep.) and observational databases such as BirdTrack (Boersch-Supan et al. Reference Boersch-Supan, Trask and Baillie2019), eBird (eBird 2017), Observation.org (Observation International 2017) and from the Global Biodiversity Information Facility (GBIF.org 2017).
Species were categorised as migratory or dispersive species (Table S1). Migratory species mainly breed in the Palearctic, but a few African species also have similar long-distance, cyclic, and directed movements. The majority of African species are either resident or perform only dispersive movements following mainly the availability of water. A few Palearctic species were also considered dispersive. As these movements show a complex, asynchronous temporal pattern across their distribution areas, we produced only one model for the entire annual cycle of the latter group of species. Some species, e.g. Great Cormorant Phalacrocorax carbo and Great Egret Egretta alba have migratory populations in the Palearctic and dispersive ones in the Afrotropics. For these species, we developed separate breeding, passage, and wintering models for the Palearctic populations (see below) and annual models for the Afrotropic populations.
The observations of migrants were divided into three seasons: breeding, passage, and wintering. Note that, as the majority of the species we classified as migratory breed in the Palearctic, the term ‘wintering’ is used here instead of the ‘non-breeding season’. We use the term non-breeding only to describe the ‘wintering’ and passage seasons together. We assigned observations to the breeding season if they fell within alpha-hulls, a generalization of convex envelope (Pateiro-López and Rodríguez-Casal Reference Pateiro-López and Rodríguez Casal2010, Reference Pateiro-López and Rodriguez-Casal2011), around the combination of species’ range map polygons for the breeding season (BirdLife International and Handbook of the Birds of the World 2017) and occurrences from the European breeding bird atlas (Hagemeijer and Blair Reference Hagemeijer and Blair1997). Wintering observations were assigned using alpha hulls around range map polygons for this season. Observations recorded within the mapped breeding range of a species and within the breeding period according to del Hoyo et al. (Reference Del Hoyo, Elliott, Sargatal, Christie and de Juana2018) and Cramp and Simmons (Reference Cramp and Simmons2006) for African and Western Palearctic breeding birds, respectively, were defined as breeding locations. Observations recorded in the wintering range and in the wintering period according to del Hoyo et al. (Reference Del Hoyo, Elliott, Sargatal, Christie and de Juana2018) and Cramp and Simmons (Reference Cramp and Simmons2006) were classified as wintering locations. All the remaining observations (outside the breeding period and inside the breeding range as well as outside the breeding range and outside the wintering period) were classified as passage locations.
Information on key sites
Site-based conservation is a critical approach for conserving waterbird species that congregate simultaneously in large numbers at certain sites, either during breeding (e.g. cormorants, herons, ibises, gulls and terns) and/or non-breeding seasons (e.g. waterfowl and waders). A network of ‘Critical Sites’ has been identified for waterbirds in Africa-Eurasia (BirdLife International and Wetlands International 2018). These sites regularly or predictably support either significant numbers of a globally threatened species (BirdLife International 2018) and therefore qualify as Wetlands of International Importance under Ramsar Criterion 2 an/or 1% or more of a distinct population of a waterbird species, qualifying under Criterion 6. The current set of 3,047 Critical Sites was identified using data up to 2007 by applying these criteria to population data on Important Bird and Biodiversity Areas (Donald et al. Reference Donald, Fishpool, Ajagbe, Bennun, Bunting, Burfield and Wege2019, BirdLife International 2019) and count data from the International Waterbird Census (Delany Reference Delany2005) using the 1% thresholds in Delany and Scott (Reference Delany and Scott2006).
To assess the dependency of the species population on the network of Critical Sites, we first calculated the proportion of the regional population (i.e. the species population in the Agreement Area) supported by each site for each species and season. We calculated the size of the regional population by summing the population estimates of all populations in the Agreement Area. Next, we calculated a “Critical Sites’ coverage index” for each species in each season by aggregating the site level figures:
 $$ {CSI}_{is}=\sum_{l=1}^n\frac{p_{is l}}{P_i} $$
Where:
CSI is : the Critical Sites’ coverage index of species i in season s,
p isl : the proportion of species i in season s at site l,
P i : the estimated population size of species i in the AEWA Agreement Area based on Delany and Scott (Reference Doelman, Stehfest, Tabeau, van Meijl, Lassaletta, Gernaat, Hermans, Harmsen, Daioglou, Biemans, van der Sluis and van Vuuren2006).
This index indicates the dependency of a species on Critical Sites during each season. Its value is zero if no site has been identified as critical for the species in that season, or if the population size is unknown. The value of the index relates to the proportion of the population supported by the Critical Site Network, and therefore the reliance of a species on these sites. Hence, the value of the index is higher for the more congregatory species (e.g. Red Knot Calidris canutus) than for the more dispersed ones (e.g. Sanderling C. alba) and it is highest for those highly congregatory species that move through many sites on migration (e.g. Eurasian Spoonbill Platalea leucorodia) or nomadic species that use many alternative sites (e.g. Lesser Flamingo Phoeniconaias minor). In such cases, the index can exceed 100%.
Environmental predictors
We used five bioclimatic variables and five habitat characteristics to predict waterbird distributions (Table 1). The bioclimatic variables were included to represent the overall climatic suitability of locations and comprise air temperature, precipitation, and related derivative metrics. Waterbird habitat characteristics included two static variables of landscape suitability unrelated to climate change: a terrain roughness index and the extent of urban areas (see definitions and sources in Table 1).
Table 1. Environmental predictors that were used to model the distribution of waterbirds.
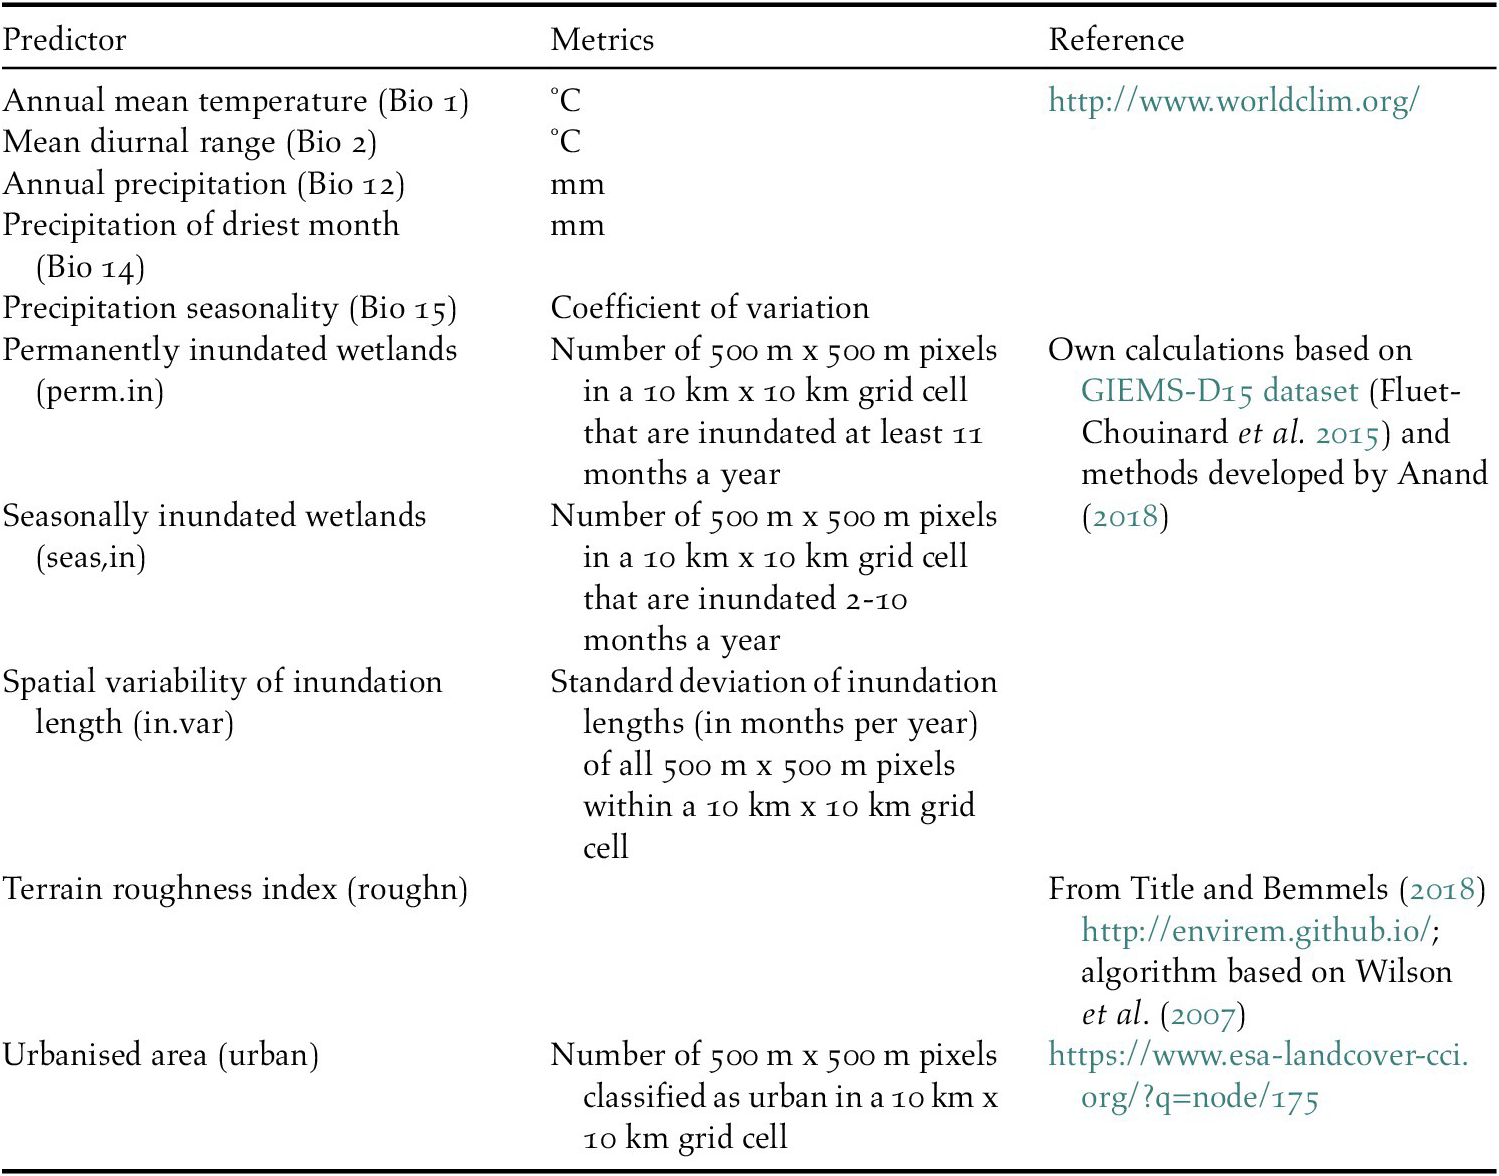
We also produced three indices describing the extent and seasonality of land surface inundation to capture the projected changes in availability of wetland habitat, a key feature determining the distribution of waterbirds. Wetland inundation depends on climate-driven changes in precipitation both locally and in the upstream catchment. For the inundation indices, a new inundation model was developed (Anand Reference Anand2018) based on the remotely sensed Global Inundation Extent from Multi-Satellites – Downscaled 15 arcseconds (GIEMS-D15) dataset which represents average inundation duration in months per year (Fluet-Chouinard et al. Reference Fluet-Chouinard, Lehner, Rebelo, Papa and Hamilton2015). In GIEMS-D15, the average monthly inundated area, including all waterbodies, flooded vegetation, and rice paddies, was mapped by downscaling coarse resolution (~25 km x 25 km grid cells) inundated areas of the GIEMS dataset covering the time period 1993–2007 (Prigent et al. Reference Prigent, Papa, Aires, Rossow and Matthews2007, Papa et al. Reference Papa, Prigent, Aires, Jimenez, Rossow and Matthews2010) into 500 m x 500 m cells using a topographic index (Fluet-Chouinard et al. Reference Fluet-Chouinard, Lehner, Rebelo, Papa and Hamilton2015). We applied a customised version of GIEMS-D15 in which rice paddies were excluded as they appear to be overpredicted and may not respond to climate change in the same way as natural wetlands. Finally, the inundation duration (months/year) was summarised into three predictor indices: permanently inundated areas (≥ 11 months/year), seasonally inundated areas (2–10 months/year), and an indicator describing the spatial variability of inundation length as a proxy for heterogeneity in waterbird habitats (see Table 1 for details). All environmental predictors were aggregated to a common 10 km x 10 km grid and transformed to the World Eckert IV projection (EPSG 540102).
Modelling inundation under climate change
To project future waterbird distributions for 2050, we estimated change in wetland inundation regimes (i.e. flooding of land surface) in response to predicted change in river discharge (i.e. volume of water flowing in the river network). Future river discharge was modelled by the global integrated water balance model WaterGAP, accounting also for anthropogenic water abstractions (Döll et al. Reference Döll, Kaspar and Lehner2003). These simulations integrated results from two climate models (HadGEM2-ES and IPSL-CM5A-LR), each using the same Representative Concentration Pathway RCP 6.0 as climate forcing (Hempel et al. Reference Hempel, Frieler, Warszawski, Schewe and Piontek2013) and the Shared Socioeconomic Pathway SSP2 (O’Neill et al. Reference O’Neill2014) representing a “business-as-usual” scenario (see Appendix S1 for more details).
We then established statistical relationships between long-term average monthly river discharge (km3/month) from a WaterGAP model run for the years 1971–2000 (Müller Schmied et al. Reference Müller Schmied, Eisner, Franz, Wattenbach, Portmann, Flörke and Döll2014) and inundated area (km2) from GIEMS-D15 (Fluet-Chouinard et al. Reference Fluet-Chouinard, Lehner, Rebelo, Papa and Hamilton2015) to identify local streamflow thresholds that corresponded with drying of wetland areas (Anand Reference Anand2018; Appendix S1). These relationships were developed using a spatially downscaled version of the river discharge data at 500 m resolution (Lehner and Grill Reference Lehner and Grill2013) and by delineating discrete flood zones that have a common hydrological source of inundation. In a validation, the resulting inundation model could correctly predict present-day inundation durations from river discharge within one month of the inundation durations as presented by GIEMS-D15 (months year-1) for 92% of the Agreement Area included in this analysis.
The discharge-inundation relationships were then applied to future river discharge simulations to produce monthly inundation maps for 2050. Finally, we estimated deviations from the present-day annual inundation patterns for three relevant metrics: the extent of permanently inundated areas, the extent of seasonally inundated areas, and the spatial variability of inundation length within each 10 km x 10 km grid (see also Table 1). This method simulates changes in inundation dynamics and drying of seasonally inundated wetland in the future but cannot effectively predict expansion of inundated area from natural or human causes (i.e. the model calculations are constrained to the current maximum inundation extents as prescribed by GIEMS-D15).
Waterbird distribution modelling
We modelled current and future waterbird distributions using an ensemble of four statistical modelling techniques (Guisan et al. Reference Guisan, Thuiller and Zimmermann2017): general linear model (GLM; Guisan et al. Reference Guisan, Edwards and Hastie2002), maximum entropy (Maxent; Phillips et al. Reference Phillips, Anderson, Dudk, Schapire and Blair2017), boosted regression tree (BRT; also called gradient boosting machine, GBM; Elith et al. Reference Elith, Leathwick and Hastie2008) and random forest (RF; Prasad et al. Reference Prasad, Iverson and Liaw2006). Models were applied separately to the breeding, passage, wintering, and resident stages of each species. The models were fitted using 10,000 randomly sampled pseudo-absence points (also referred to as background) across the AEWA area, and another set of 10,000 pseudo-absences was kept separately to evaluate model performance (Barbet‐Massin et al. Reference Barbet‐Massin, Jiguet, Albert and Thuiller2012; see details in Appendix S2). Likewise, two sets of occurrence data, one for model calibration and a hold-out set for model evaluation, were used. For selecting the hold-out observation data we used a resampling process that also addressed the sampling bias of the waterbird data (see details in Appendix S2).
The model fit and evaluation was performed for each combination of species and modelling technique. We used Somers’ D, a rescaled version of the ‘Area under the Curve’ (Somers’ D = 2*AUC-1; Bahn and McGill Reference Bahn and McGill2013), to evaluate each model and to average the four modelling techniques to an ensemble, weighted by the mean Somers’ D (see also Guisan et al. Reference Guisan, Thuiller and Zimmermann2017). All modelling was implemented using the Biomod R-package (Thuiller et al. Reference Thuiller, Lafourcade, Engler and Araújo2009, Reference Thuiller, Georges, Engler and Breiner2017). However, these model fit statistics were not able to detect if the models produced biased prediction of the current mapped range (BirdLife International and Handbook of the Birds of the World 2018) because some of the areas of the species known ranges were under-sampled (e.g. parts of Africa and Siberia). Therefore, we also compared the predicted current range with the mapped range in order to assess the models subjectively using expert judgement. We classified the models as ‘good’ if the projected range approximated well the mapped distribution of the species throughout its range, ‘fair’ if some parts (10–33%) of the known range were not predicted and ‘poor’ if major (>33%) overpredictions or underpredictions occurred. The AUC and the True Skill Statistics (TSS) values as well as the expert evaluation are presented in Table S1.
To assess the relative contribution of environmental predictors to the suitability values (i.e. importance), we calculated the mean importance of each predictor across the four statistical modelling techniques (GLM, Maxent, BRT, and RF) for each modelled species.
For the future climate scenarios, we used the same RCP 6.0 and climate models as for the hydrological models. To exclude predictions in distant areas from a species’ current range that are unlikely to be occupied (Barve et al. Reference Barve, Barve, Jimenez-Valverde, Lira-Noriega, Maher, Peterson, Soberún and Villalobos2011), we also limited the projected distribution of each species to within a 300 km buffer around its current known flyway boundaries (BirdLife International and Wetlands International 2018) based on the maximum value in Gillings et al. (Reference Gillings, Dawn and Fuller2015). The list of AEWA species, the availability of seasonal models, model fit statistics and the subjective assessments are documented in Table S1.
Assessing species exposure to climate change
We assessed the exposure of species to climate change at two geographic scales: their overall range and their Critical Sites. At the scale of the entire range, we assessed (a) proportion of the current range that is projected to remain suitable and (b) projected proportional range size change by 2050. The former is a more conservative metric that focuses on the exposure within the current range, while the latter assumes that (1) the current range is predicted correctly and (2) all of the suitable future range can be colonised (Wormworth et al. Reference Wormworth, Sekercioglu and S̜ekercioğlu2011). The proportion of the future range that can be colonised outside the current range (i.e. within the 300 km buffer) can be calculated by subtracting (a) from (b).
We paid special attention to Critical Sites because they play an important role in the conservation of waterbirds and because changes in the spatial arrangement of suitable habitats (e.g. the increasing distance between stop-over sites) can have a disproportionate impact on migratory connectivity (Cianfrani et al. Reference Cianfrani, Broennimann, Loy and Guisan2018). At the scale of the Critical Sites network, we measured the exposure of species to climate change through the following metrics: (i) proportion of Critical Sites identified for the species that remain suitable; (ii) change in the proportion of the population supported by Critical Sites that remain suitable; and (iii) percentage change in the number of suitable Critical Sites between the present and future.
Results
We developed species distribution models for 197 waterbird species, including 119 migrants, 60 dispersive species and 18 species with both migrant and dispersive populations. Overall model performance was good despite a strong repeated split-sampling where 50% of the data was used for training and 50% for testing (mean TSS of 0.856 ± 0.055 ranging from 0.718 to 1 and mean AUC of 0.975 ± 0 ranging from 0.939 to 1). Because of the heterogeneous sampling density, models for 192 species were also subjectively assessed as ‘good’ or ‘fair’ in at least one season (breeding, passage, and wintering or dispersive) and for 180 species in all relevant seasons (Table S1). Only models classified as ‘good’ or ‘fair’ were used in subsequent analyses.
Importance of environmental variables predicting waterbird distribution
The overall correlation between the 10 predictors listed in Table 1 was low, with a maximum Pearson correlation coefficient of r = 0.638 between annual mean temperature (Bio 1) and precipitation seasonality (Bio 15) and a small multicollinearity with a maximum variation inflation factor of 2.29. Annual mean temperature (Bio 1) was the most important predictor of distribution in the breeding and wintering seasons (Figure 1). The median of the species-level mean importance values of Bio 1 was 0.54 for dispersive species, 0.41 for migrants in the breeding season, 0.14 during passage and 0.28 in winter. The mean diurnal temperature range (Bio 2) was a much more important predictor for migrants in all seasons (the median mean importance values were 0.16, 0.22 and 0.17 for migrants in the breeding, passage, and wintering seasons respectively) than for the dispersive species (0.05) reflecting the stronger influence of seasonality on the Palearctic migrants.
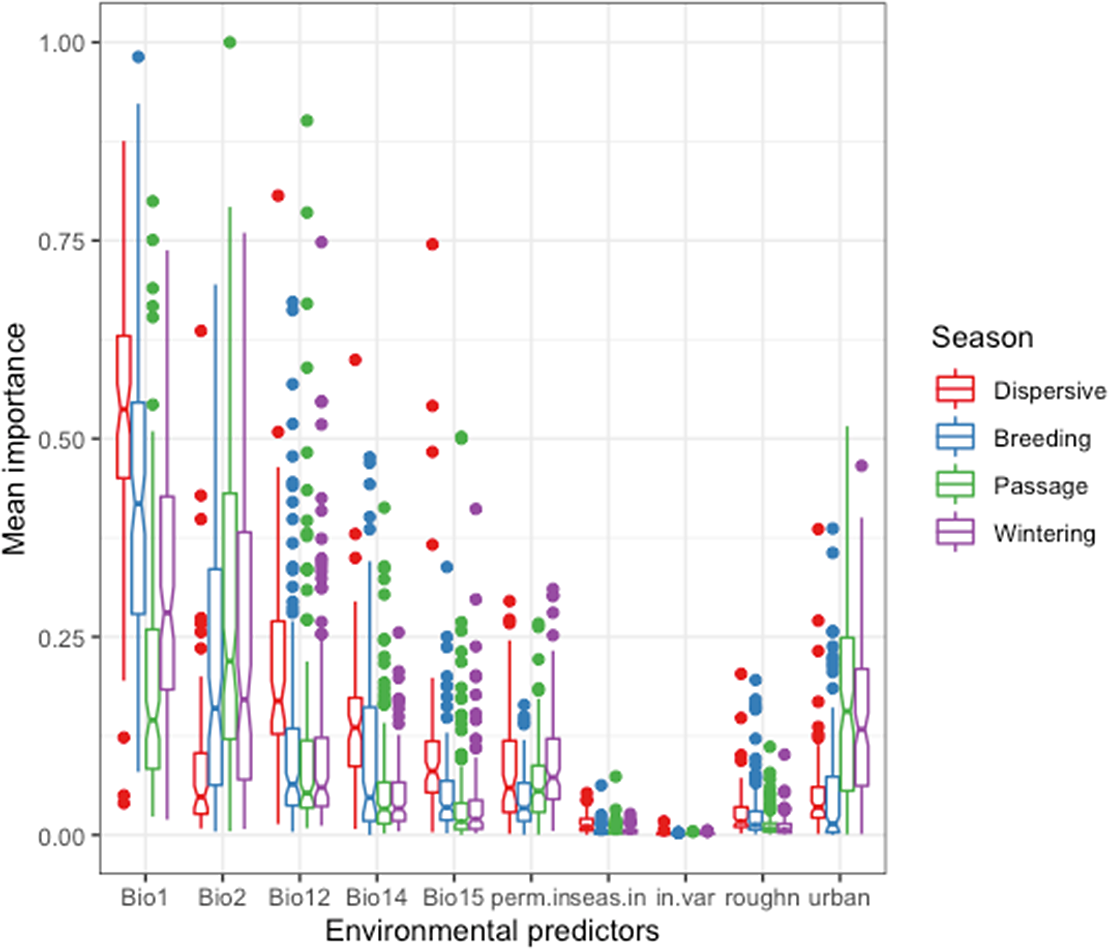
Figure 1. Importance of predictors of waterbird species distribution across seasons in the model ensemble for each species. Bio1: Annual Mean Temperature, Bio2: Mean Diurnal Range, Bio12: Annual Precipitation, Bio14: Precipitation of Driest Month, Bio15: Precipitation Seasonality, perm.in: Permanently inundated area, seas.in: Seasonally inundated area, in.var: Standard deviation of inundation, roughn: Terrain roughness index, urban: Urbanised area. See details in the text and Table 1.
On the other hand, annual precipitation (Bio 12), precipitation of driest month (Bio 14) and precipitation seasonality (Bio 15) were particularly important in the models for dispersive species (median mean importance values were 0.17, 0.13 and 0.08 respectively) and less important for the migrants in each season (breeding: 0.06, 0.05, 0.03, passage: 0.05, 0.03, 0.02, wintering: 0.06, 0.03, 0.02 respectively), precipitation seasonality showing both the smallest contribution and the smallest difference among the precipitation-related predictors between dispersive species and migrants. The relatively high importance of urban area during passage and winter (0.15 and 0.13, respectively) likely reflects the concentration of observation efforts.
Inundation duration made a limited contribution to the species distribution models. The median of the mean importance of permanent inundation was 0.06 and it was 0.04 for seasonal inundation in all seasons, with little difference between seasons. Nevertheless, the presence of wetlands resulted in higher suitability for those waterbird species that are closely associated with wetland habitats (e.g. grebes, loons) in comparison with species that also use other habitats (e.g. lapwing, geese). Extent of permanent wetland (the number of 500 m x 500 m cells in a 10 km x 10 km grid that are inundated for at least 11 months a year; see Table 1) was less important for predicting distribution of migratory birds in the breeding season (0.03) than of dispersive, passage or wintering birds (median of mean importance was 0.06, 0.06, 0.07, respectively).
Projected change in range extent
The median projected relative range change was -14% for dispersive species (n = 77), +20% for migrants in the breeding season (n = 122), +35% during passage (n = 131) and +44% in winter (n = 129); with significant differences between seasons (Kruskal-Wallis test: H(3) = 157.48, P <0.01). Pairwise comparisons of the mean ranks between seasons showed that there were significant differences between all season-pairs except between passage and wintering (Figure 2). Overall, 65 (84%) of the dispersive species are predicted to suffer a net reduction in their range extent by 2050. In contrast, 28 (23%) of the migrant species are predicted to experience a net reduction in breeding range extent, and just nine (8%) and eight (9%) migrant species are expected to suffer net range losses in the passage and wintering season, respectively. For most of the migrants, our models predict a range expansion in all seasons (Table S2). The main exceptions are waders breeding in the High Arctic and species breeding in the arid zone of Eurasia (Figure 3).

Figure 2. Relative change of individual species range across seasons. Values < 0 signify projected decline in range, while values > 0 represent a projected expansion in the species range. Lines in the box represent the median values, bottom and top of the box show the 25th and 75th percentiles respectively. The whiskers represent the largest data point that is less than 1.5 times the interquartile range above the third quartile and the data point that is less than 1.5 times the interquartile range below the first quartile. Single points represent the outliers. The notches are calculated using the formula ±1.58 x interquartile range / the square root of the sample size.

Figure 3. Projected net range change relative to the current range by the latitude of the northern and southern edges of the species breeding range. Biogeographic clusters of species and selected species with high projected net range losses are shown.
We predicted that future ranges will be more than 30% smaller for 14 (18%) dispersive species, 13 (10%) migrant species in the breeding season and three migrant species during the passage season. No migrant species was predicted to suffer such a large range contraction during the wintering season (Table 2). The risk of such a large range contraction could qualify a species as ‘Vulnerable’ under the IUCN Red List Criterion A3c if (a) three generation lengths in such species exceed 50 years (the approximate period between ‘current’ and ‘future’ in our models), (b) population declines are expected to be proportional to rates of range contraction, and (c) climate change impacts on the species’ range and population outside our study region are expected to be similar to those within it (IUCN 2012).
Table 2. Species with >30% projected net range loss for dispersive species and migratory species in one or more seasons
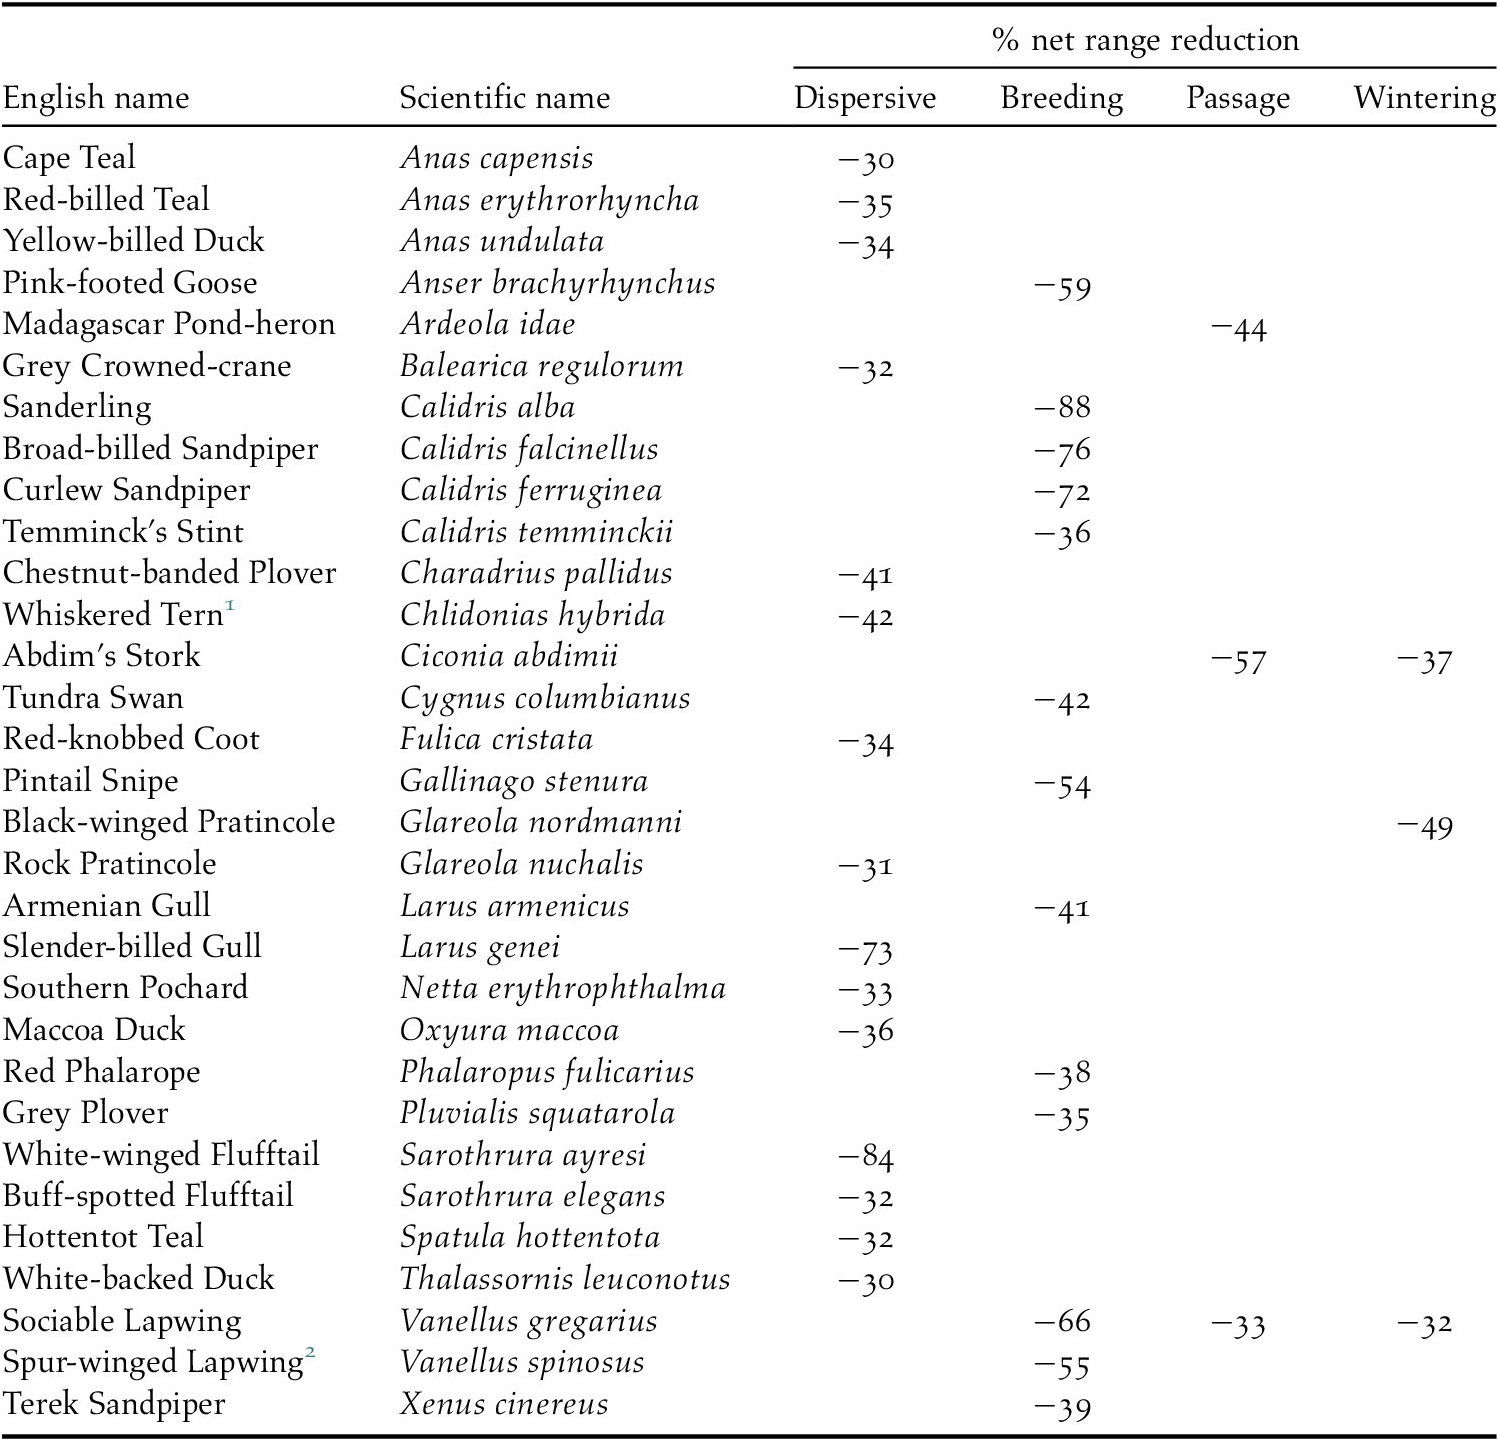
1 African populations
2 Palearctic population
All species are projected to suffer some loss of their current range, but there were significant differences between groups of species and between seasons for migratory species, H(3) = 121.42, P 0.01. Dispersive species and migrants in the breeding season are predicted to lose a higher proportion of their current range (median: 21% and 17% respectively) than migrants in the passage or wintering seasons (6% and 8% respectively, see also the horizontal boxplots in Figure 4). Pairwise comparison of the mean ranks between seasons showed that the difference was not significant between the dispersive species and migrants in the breeding season and between the passage and wintering seasons for migrants, but it was significant between all other combinations of seasons. In total, 60 species are projected to lose more than 30% of their current range (Table 3) and seven of these species are predicted to suffer such large range losses in more than one season.

Figure 4. Interaction between proportional range loss (i.e. proportion of current range projected to become unsuitable) and proportional range expansion (i.e. area projected to become suitable outside of the current range as a proportion of the current range) in the breeding, passage and wintering seasons of migrant species and for dispersive species. Circles below the dashed line represent species with predicted net range loss in the given season. Circles above the reference line represent the species that may be able to compensate for the losses of their current range if they can colonise the areas that are projected to become suitable. The marginal boxplots show the distribution of the modelled species by season along the two axes respectively and assist comparison between groups. Lines, boxes, whiskers and points have the same meaning as in Figure 2. The boxplots above the graph show that migrants during their wintering and passage seasons are projected to lose only a small proportion of their current range. The boxplots on the right show that dispersive species are projected to extend their range much less than migrants.
Table 3. Species projected to lose >30% of their current range
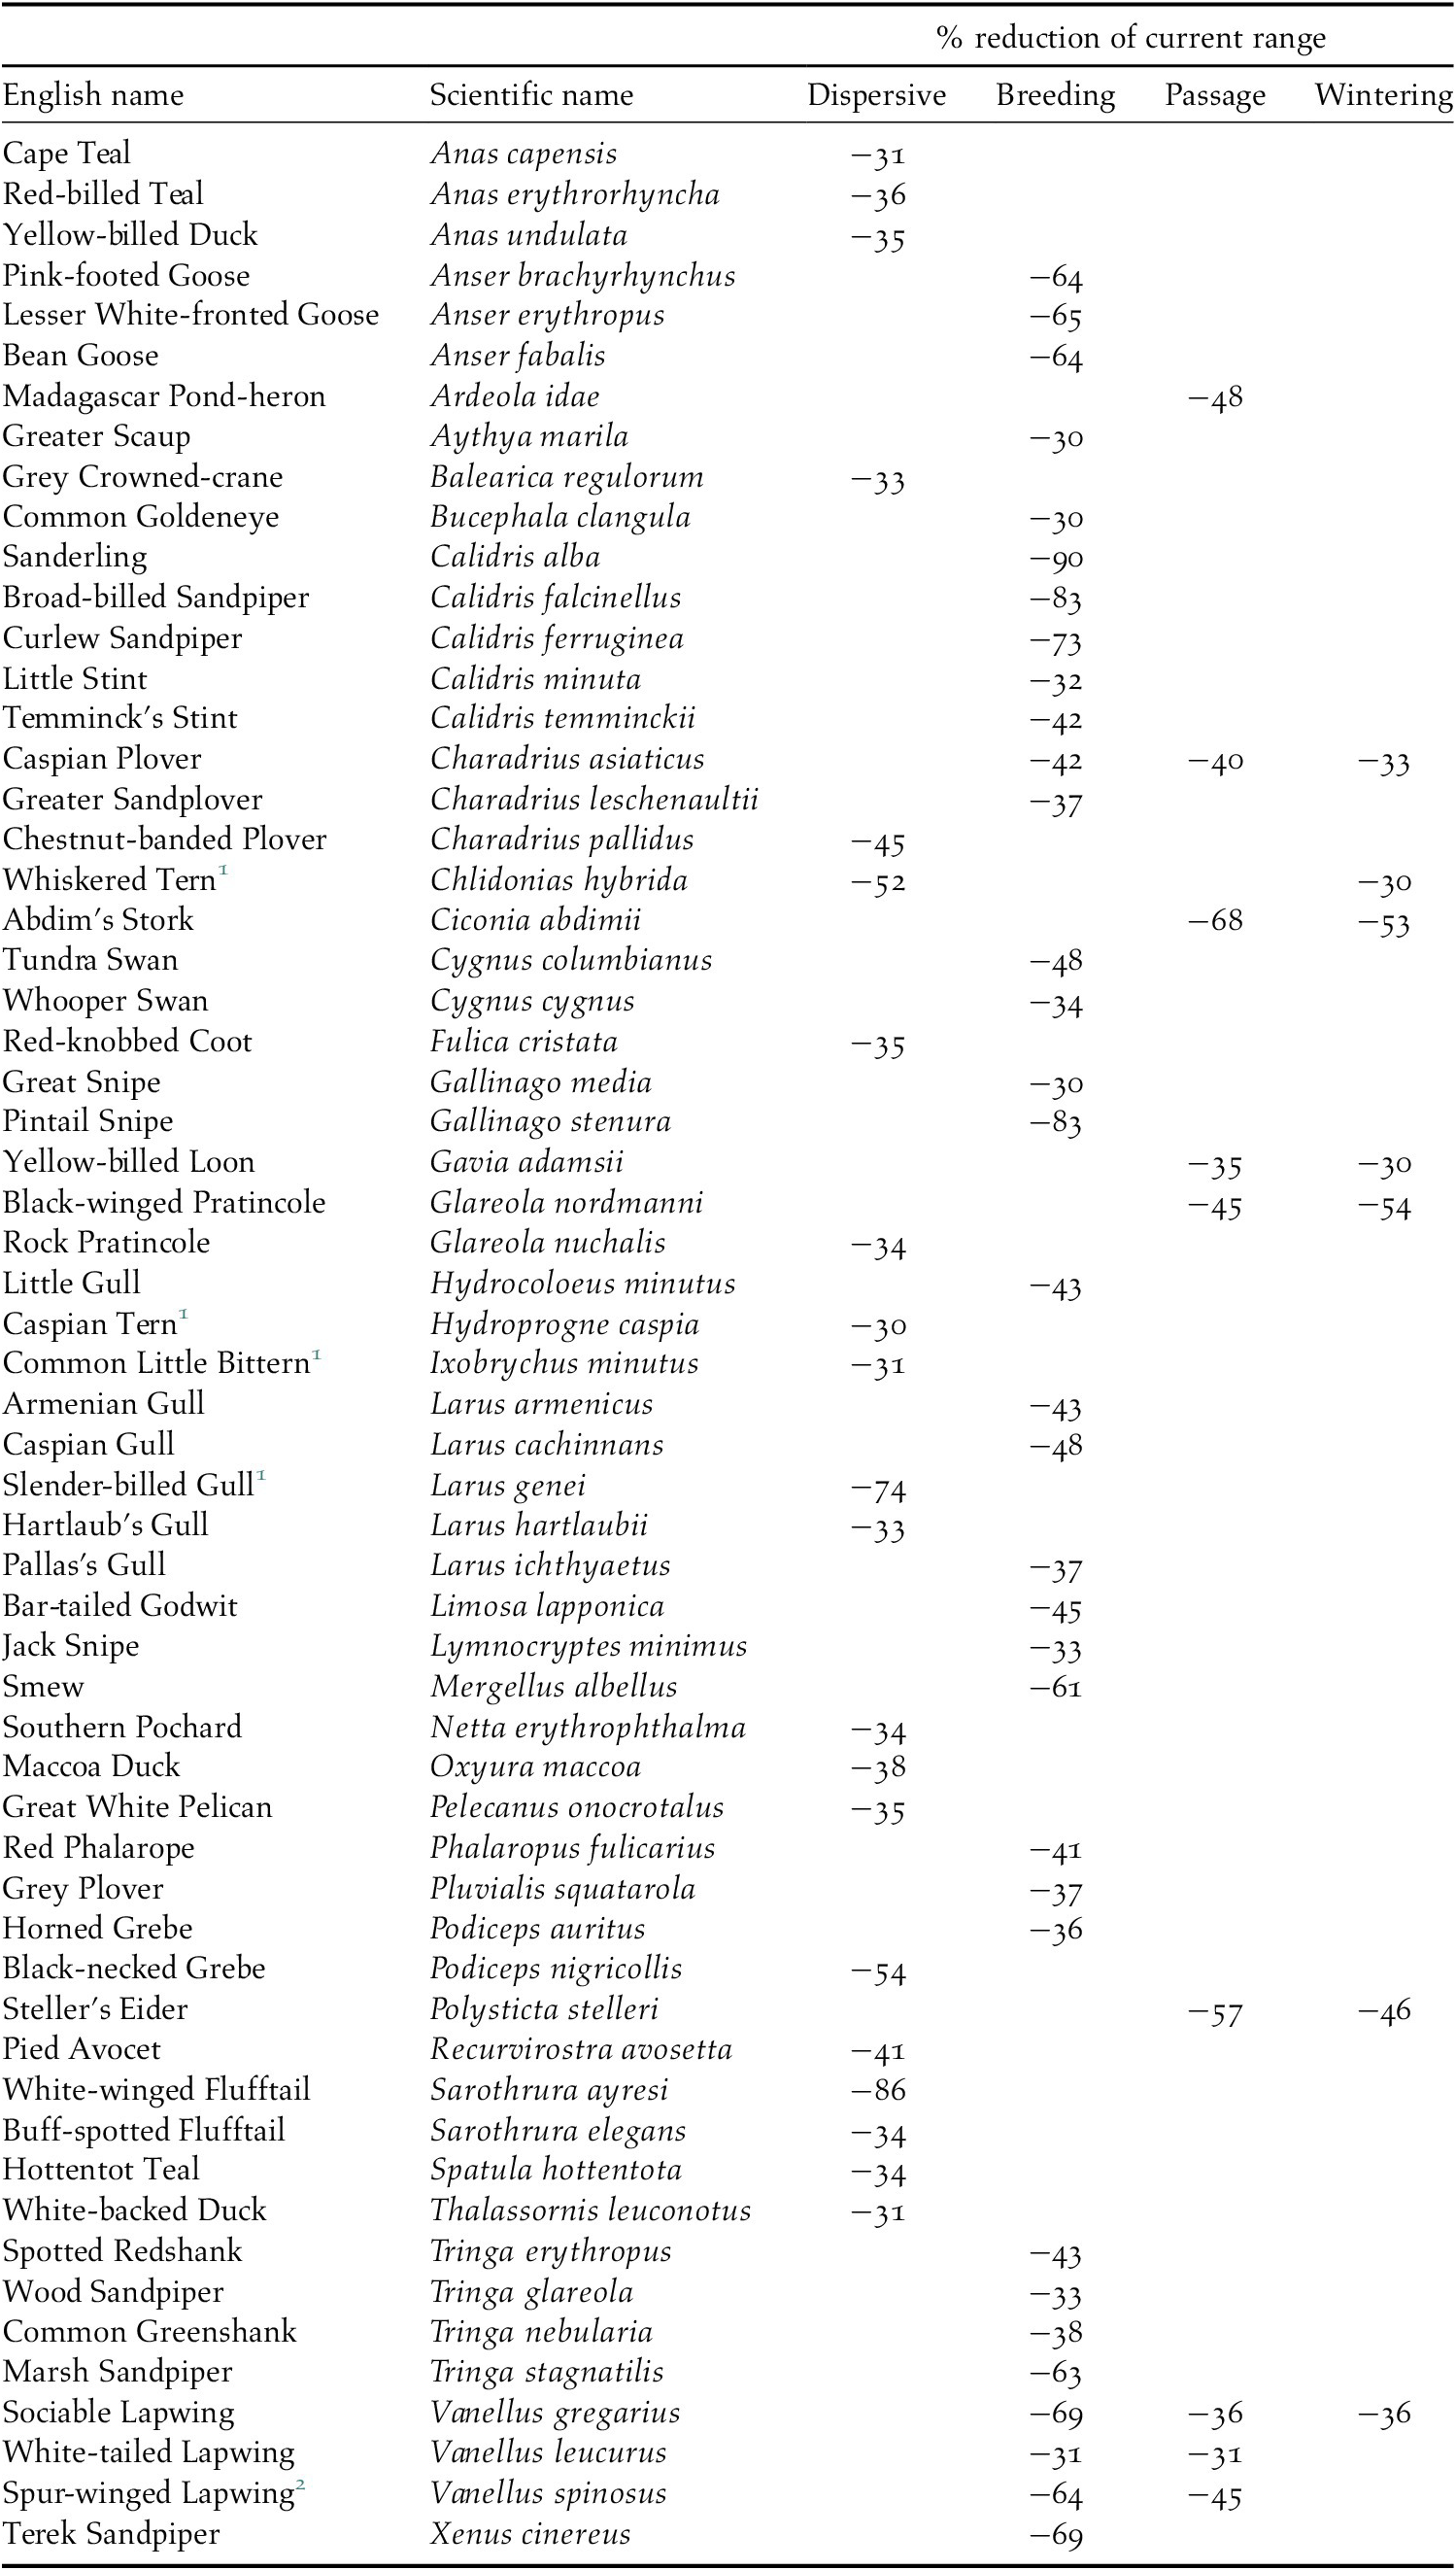
1 African populations
2 Palearctic population
There were also significant differences between seasons in predicted relative range gains outside of the current range, H(3) = 164.38, P <0.01. Relative range increases were small for dispersive species (median: 4%) compared with migrants in all seasons (medians: 37%, 41%, 51% for the breeding, passage, and wintering seasons respectively). The difference is significant between the dispersive species and migrants in all other seasons as well as between breeding and wintering, but not significant between breeding and passage nor between passage and wintering (see the vertical boxplots in Figure 4).
Geographic patterns in range change
Significant redistribution of waterbird species is expected across the entire Agreement Area by 2050. However, the most substantial net losses in the number of waterbird species are predicted in the already arid northern zones of Southern Africa, in the wider surroundings of the Okavango Delta, followed by the Rift Valley, in north-west Africa and in the catchment of the Tigris River in the Middle East. Range expansion into new areas is projected to be limited in extent across Africa except in the grassland regions of South Africa, whereas large regions of the European boreal and Arctic biomes will become suitable for species currently not occurring in these areas (Figure 5).
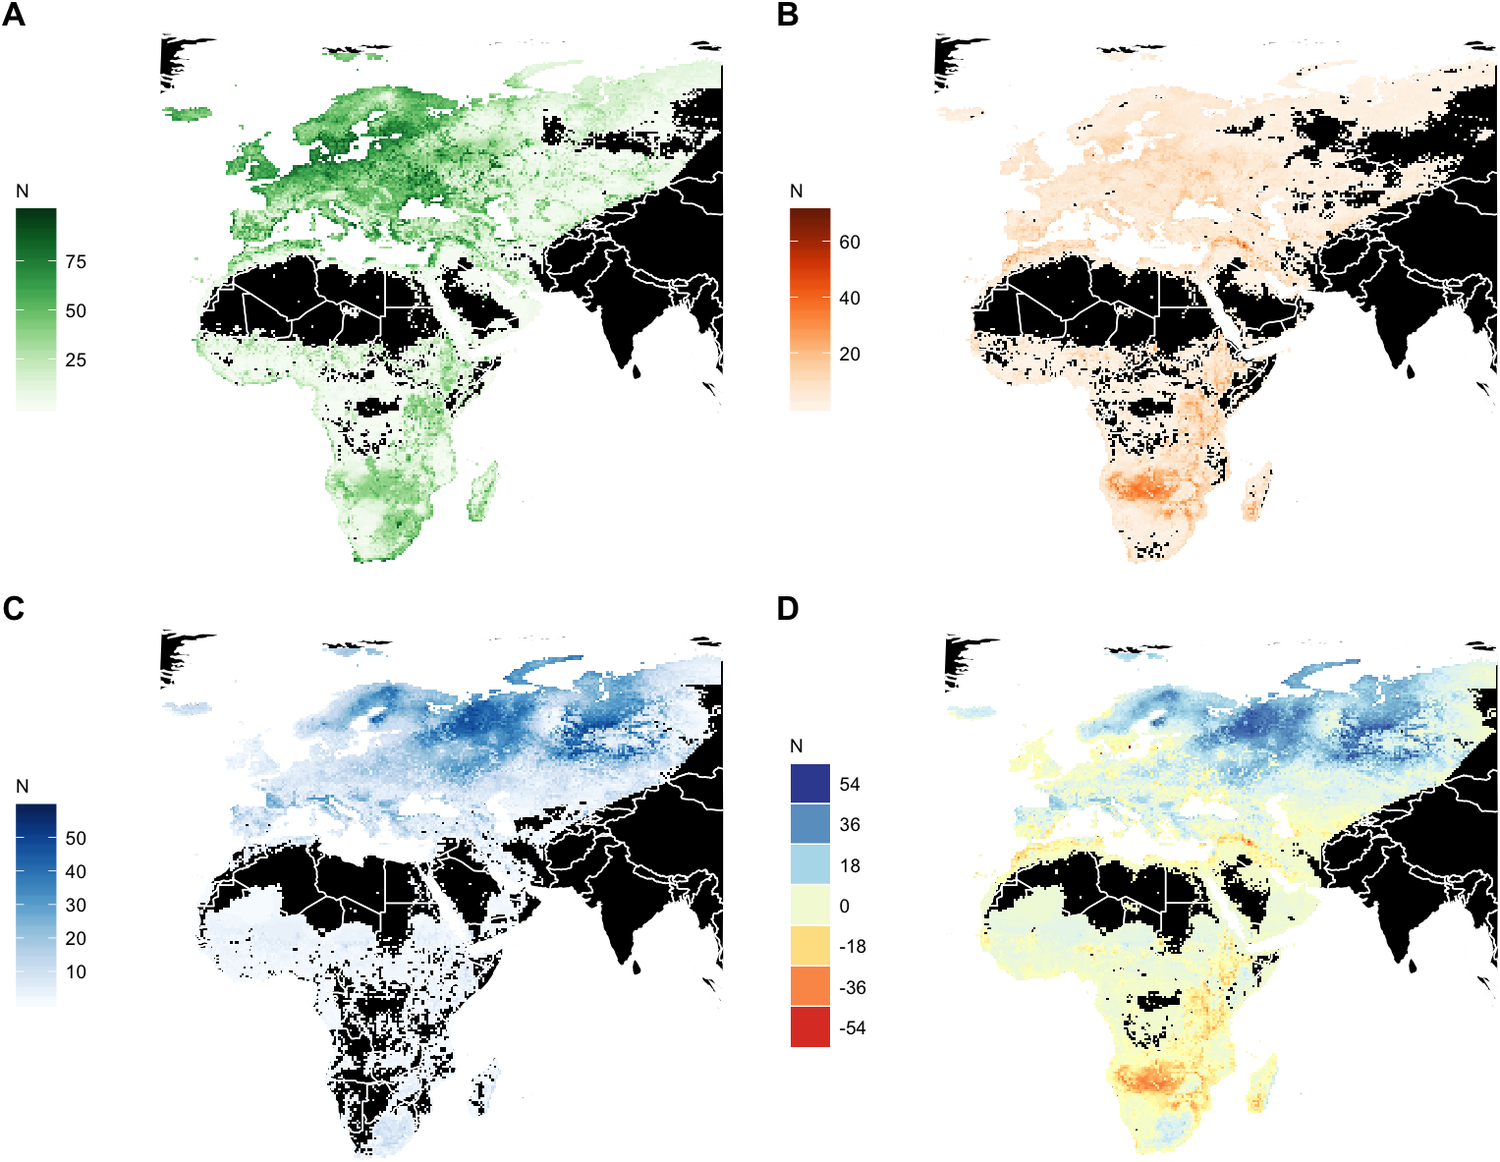
Figure 5. Geographic distribution of modelled breeding and dispersive species. (A) Current modelled species richness. (B) Number of species projected to lose suitable conditions by 2050 (‘emigrants’). (C) Number of species projected to gain suitable conditions (colonisers) by 2050. (D) Net change in species richness by 2050. N indicates the number of species.
Exposure to changes in the suitability of key sites
For the vast majority of migratory AEWA species (>80%), Critical Sites support only a relatively small proportion (<10%) of their populations within the AEWA area in the breeding season, owing to these species being much more dispersed when breeding. This means that conservation strategies focusing on the sites holding >1% of a flyway population would benefit strongly only a few species in this season. Focusing on Critical Sites is a far more effective strategy during passage and wintering seasons when 34% and 37%, respectively, of migratory waterbird species and 24% of dispersive species have a Critical Site coverage index >50% (i.e. more than 50% of the populations are concentrated at Critical Sites; Figure 6).

Figure 6. Distribution of species according to their Critical Site coverage indices. (Only the left bin borders are shown, and bins are closed to the left, i.e. 0 – 9.9%, 10 – 19.9%, etc.).
For 42% of the resident species and migratory species in the wintering season, 55% of migratory species in the breeding season and 64% during passage, none of their current Critical Sites are projected to become unsuitable. Dispersive species are likely to ‘lose’ a higher proportion of their current Critical Sites than migratory ones in any seasons (Figure 7). However, some migrant species may also lose a significant proportion of their current Critical Sites (Table S2).

Figure 7. Number of species by the proportion of their Critical Sites projected to remain suitable for the species. (Only the left bin borders are shown on the horizontal axis, and bins are closed to the left, i.e. 0 – 9.9%, 10 – 19.9%, etc.).
The loss of suitability of their current Critical Sites is predicted to affect ≤30% of the population in the Agreement Area for 96% of dispersive species and 99% of migratory species in any season (Figure 8). However, the following species are projected to experience a > 30% reduction in their Critical Site coverage index: Chestnut-banded Plover Charadrius pallidus, Fulvous Whistling Duck Dendrocygna bicolor and Greater Flamingo Phoenicopterus roseus, Bewick’s Swan Cygnus columbianus bewickii during the breeding season; Greater White-fronted Goose Anser albifrons during passage, and Madagascar Pratincole Glareola ocularis in the non-breeding season.

Figure 8. Cumulative proportion of species with increasing proportion of their regional populations in Critical Sites that are projected to lose their suitability for the species. Lines closer to the upper left corner indicate smaller losses for majority of the species.
For most migrant species during the passage and wintering seasons, the number of climatically suitable sites is likely to increase (Figure 9). There are only 12 and 10 species, respectively, for which the number of suitable Critical Sites is projected to decline during the passage and wintering seasons. Species for which a >10% decline in the number of suitable Critical Sites is projected during these seasons include three globally threatened species: Madagascar Pond-heron Ardeola idea, Steller’s Eider Polysticta stelleri and Sociable Lapwing Vanellus gregarius.
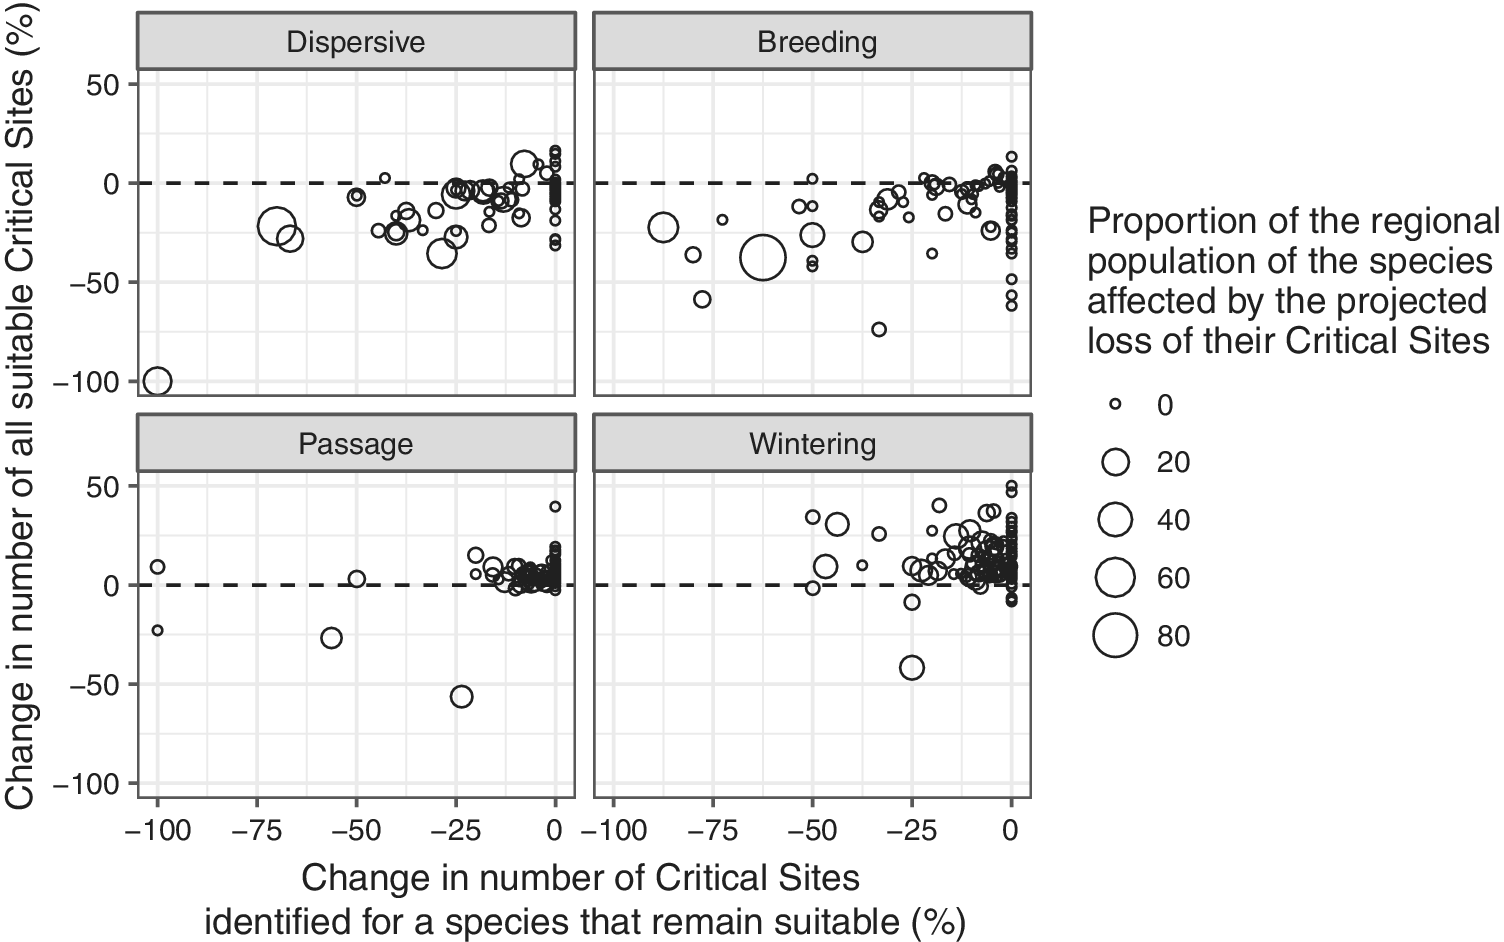
Figure 9. Relationship between the changes in number of Critical Sites that support internationally important numbers of a species that are projected to remain suitable and the change in number of Critical Sites that are projected to be suitable in the future. Bubble sizes indicate the proportion of the species population that might be affected by the projected loss of their existing Critical Sites.
The current network of Critical Sites, however, offers only limited scope to compensate for the reductions in number of suitable sites for migrants in the breeding season and for dispersive species: 101 migrant species (83%) in the breeding season and 63 dispersive species (82%) are predicted to experience a net loss in the number of climatically suitable Critical Sites by 2050.
Discussion
Our study is the first to assess the impact of climate change on waterbirds throughout their annual cycle while taking into account not only the changes in local climatic variables, but also the hydrological impact of climate change. We assessed the impact of climate change on the distribution of Palearctic migrant waterbirds in their breeding, passage, and wintering seasons and of dispersive Afrotropical waterbird species throughout the year. We also assessed the projected changes in the suitability of their Critical Sites under climate change and considered the implications of these changes for the conservation of AEWA-listed waterbird species
Relative importance of environmental predictors
In general, our models showed a strong influence of temperature and somewhat weaker effect of precipitation on species’ distributions. This is consistent with the empirical results of Amano et al. (Reference Amano, Székely, Wauchope, Sandel, Nagy, Mundkur, Langendoen, Blanco, Michel and Sutherland2020). Surprisingly, predictors related to inundation all had relatively low importance in predicting the distribution of waterbirds in all seasons compared with the importance of temperature and precipitation. We suspect that the low relative importance of inundation was caused by three factors. First, many waterbirds also use non-wetland habitats and thus less reliant on wetland habitats. Second, our hydrological models were only able to capture relatively larger wetlands but not small pools and ditches, which would be used by waterbirds but would not appear in our 10 km x 10 km grids. Third, the large geographic extent of the study area (from the Arctic to South Africa) covers large climatic gradients which are the dominant factors for explaining waterbird distributions. Nevertheless, a visual inspection of the modelled distribution of the species (BirdLife International and Wetlands International 2018) reveals that, for most species, inundated areas were more suitable than non-inundated areas, which is not surprising as adding habitat-related predictors improves distribution models (Slavich et al. Reference Slavich, Warton, Ashcroft, Gollan and Ramp2014).
Predicted range changes
We found that the median loss of the current distribution area of Palearctic migrants in the breeding season, and of dispersive Afrotropical species throughout the year, is around 20% by 2050. The equivalent values are less than 10% for the passage and wintering seasons for Palearctic migrants. This means that Palearctic migrants in their breeding season and Afrotropical species throughout their annual cycle are much more exposed to climate change than Palearctic migrants during passage or wintering. However, these conclusions are based on crude climatic and hydrological predictors and they do not take into account the projected changes in the timing of floods in wintering areas (Zwarts et al. Reference Zwarts, Bijlsma, van der Kamp and Wymenga2009) or the potential negative impact of sea-level rise (Iwamura et al. Reference Iwamura, Possingham, Chadès, Minton, Murray, Rogers, Rogers, Treml and Fuller2013) and other anthropogenic impacts.
Although the median range contraction was similar for the Palearctic species in the breeding season and for Afrotropical species, High Arctic breeding species are projected to suffer the largest range contractions. The high exposure of these species accords with the results of other predictions (Huntley et al. Reference Huntley, Green, Collingham and Willis2007, Zöckler and Lysenko Reference Zöckler and Lysenko2000) and signs of range contractions among these species are already being reported from the breeding grounds (Brommer et al. Reference Brommer, Lehikoinen and Valkama2012, Gillings et al. Reference Gillings, Dawn and Fuller2015).
According to our models, the vast majority of the Afrotropical dispersive waterbird species are likely to suffer range contraction by 2050. Precipitation and inundation seem to be relatively more important factors influencing the distribution of Afrotropical species than Palearctic ones (Figure 1) and, unlike temperature, these changes will cause the direction of species range shifts to be more variable than simply poleward (VanDerWal et al. Reference VanDerWal, Murphy, Kutt, Perkins, Bateman, Perry and Reside2013). Consequently, we predict that the distribution of most Afrotropical waterbird species will become more fragmented in contrast to most Palearctic breeders, which can track changes along climatic gradients and are predicted to expand their current range northward (as shown on the Critical Site Network Tool 2.0; BirdLife International and Wetlands International 2018). An earlier trait-based sensitivity assessment for AEWA species (Maclean et al. Reference Maclean, Rehfisch, Delany and Robinson2007) identified very few Afrotropical waterbirds being sensitive to climate change apart from those that are already listed as threatened species or that have small populations, but that study did not include any measure of exposure to climate change. However, our predicted range changes concur well with the predictions for 2055 of Hole et al. (Reference Hole, Willis, Pain, Fishpool, Butchart, Collingham, Rahlbek and Huntley2009), illustrated in BirdLife International and Durham University (2020). Similar changes to our predictions have been recently observed in the distribution of Southern African species (Gómez and Brooks Reference Gómez and Brooks2017, Smith et al. Reference Smith, Underhill and Brooks2017a, Reference Smith, Underhill and Brooks2017b, Underhill and Brooks Reference Underhill and Brooks2016; Underhill et al. Reference Underhill, Gómez and Brooks2016a, Reference Underhill, Gómez and Brooks2016b). The magnitude of these observed changes suggests our models may even underestimate the magnitude of future changes.
Based on our species distribution models, we identified Southern and Eastern Africa, the West African seaboard, the Mediterranean and Southwest Asia as likely to suffer the largest net loss in richness of AEWA-listed breeding waterbird species (Figure 5). The boreal zone is also projected to lose some species, but these may be compensated by colonisation by species from the temperate zone. The largest increases in species richness are projected for Scandinavia and the boreal zone of Russia, which fits recent empirical observations from Finland (Santangeli et al. Reference Santangeli, Rajasärkkä and Lehikoinen2017, Virkkala et al. Reference Virkkala, Rajasärkkä, Heikkinen, Kuusela, Leikola and Pöyry2018).
Climate change adaptation requirements
It is well established that protected areas are an important pillar in climate change adaptation strategies for birds, as they can safeguard key sites and facilitate the redistribution of species (Hiley et al. Reference Hiley, Bradbury and Thomas2014, Pavón-Jordan et al. Reference Pavón‐Jordán, Fox, Clausen, Dagys, Deceuninck, Devos, Hearn, Holt, Hornman, Keller, Langendoen, Ławicki, Lorentsen, Luigujõe, Meissner, Musil, Nilsson, Paquet, Stipniece, Stroud, Wahl, Zenatello, Lehikoinen, Svein and Lorentsen2015, Gaget et al. Reference Gaget, Pavón-Jordán, Johnston, Lehikoinen, Hochachka, Sandercock, Soultan, Azafzaf, Bendjedda, Bino, Božič, Clausen, Dakki, Devos, Domsa, Encarnação, Erciyas-Yavuz, Faragó, Frost, Gaudard and Brommer2020). The Critical Site Network represents a list of sites that would qualify as Ramsar Sites under Criteria 2 or 6, and as Special Protection Areas under Article 4 of the EU Birds Directive. However, only 400 (13% of all Critical Sites) had been designated as Ramsar Sites and 843 (66% of all Critical Sites in the EU) were designated as Special Protection Areas by 2010 (Nagy et al. Reference Nagy, Jones and Cottham2012). Our results highlight that Critical Sites support a high proportion of waterbird populations only during passage and wintering. Even if all Critical Sites were designated as protected areas, only a small proportion of Afrotropical dispersive species would be protected and only a small proportion of the populations of most Palearctic migrants would be protected in the breeding season. The Critical Sites alone would have limited capacity to accommodate range shifts in the seasons in which these species are most exposed to climate change (Figures 6 and 7). Therefore, successful climate change adaptation for AEWA-listed waterbirds should rely on a broader network of sites than just the Critical Sites. It will require applying broader site selection criteria and further expansion of protected area networks. Site management objectives should also explicitly include objectives for assisting climate change adaptation of waterbird populations, and adaptation measures should be implemented on the ground. Gaget et al. (Reference Gaget, Pavón-Jordán, Johnston, Lehikoinen, Hochachka, Sandercock, Soultan, Azafzaf, Bendjedda, Bino, Božič, Clausen, Dakki, Devos, Domsa, Encarnação, Erciyas-Yavuz, Faragó, Frost, Gaudard and Brommer2020) illustrated clear differences in the ability of Natura 2000 sites to accommodate range-shifts between those with or without management objectives for birds.
However, the most significant implication of our results is that for many species, particularly during the breeding season, wider habitat conservation measures (such as controlling drainage for agriculture and forestry, and restoration of drained wetlands) should be implemented at sufficiently large scale also outside of protected areas (Carroll et al. Reference Carroll, Dunk and Moilanen2010). This will require land-use policies promoting more environmentally friendly practices. Where species breed extensively across farmed habitat, widespread adoption of agri-environment scheme options to support those populations may also be required (Franks et al. Reference Franks, Roodbergen, Teunissen, Carrington Cotton and Pearce‐Higgins2018).
Amano et al. (Reference Amano, Székely, Sandel, Nagy, Mundkur, Langendoen, Blanco, Soykan and Sutherland2018) showed that effective governance is a key prerequisite of successful conservation. In the European Union, relatively strong policy frameworks such as the network of Special Protection Areas under the Birds Directive and funding mechanisms (LIFE+ Nature, agri-environmental payments under the Common Agriculture Policy) are available to facilitate climate change adaptation both within key sites and in the wider landscape, although all of these are subject to national implementation and might be not implemented at the required scale everywhere. However, our results show that AEWA-listed species will be most exposed to the impact of climate change outside the EU, in regions with lower governance indices and often also with low Gross Domestic Product (GDP). This already results in a lower protected area coverage of the Critical Sites and more limited progress in managing them according to the requirements of their qualifying species in these countries (Nagy et al. Reference Nagy, Jones and Cottham2012). Although the implementation of the provisions of AEWA (UNEP/AEWA Secretariat 2018) and its climate change adaptation principles (AEWA 2012, 2015) are important, it is unlikely that countries with low governance index and low GDP will be able to address climate change adaptation for waterbirds without substantial external financial and technical assistance. In addition, many of the countries where waterbirds are most exposed to climate change will also face climate change adaptation challenges for their human populations (e.g. Sarkodie and Strezov Reference Sarkodie and Strezov2019). Therefore, it will be essential that AEWA Parties in high income countries and their funding instruments for climate change adaptation apply a more integrated approach to food- and water security, disaster risk reduction and biodiversity conservation focusing on nature-based solutions that deliver benefits both for people and for biodiversity.
Limitations
We modelled the distribution of AEWA-listed waterbirds based on observational data from systematic atlas surveys, systematic monitoring programmes and from casual observations to produce the finest resolution and comprehensive assessment of distributions available for these species. However, as these datasets showed observation bias, we had to develop a method to deal with this problem (see Appendix S2). An alternative approach could have been to model species distribution based on the mapped range of species (as in Hole et al. Reference Hole, Willis, Pain, Fishpool, Butchart, Collingham, Rahlbek and Huntley2009). However, mapped ranges contain commission errors (unoccupied locations; Rocchini et al. Reference Rocchini, Hortal, Lengyel, Lobo, Jimenez-Valverde, Ricotta and Chiarucci2011). In contrast to observational data, they tend to overpredict the distribution in areas with less information (e.g. West Siberia and Central Asia). For example, the mapped range of the Eurasian Spoonbill is very fragmented in Europe but almost continuous in Russia and Kazakhstan (BirdLife International 2020). However, this is clearly not the case in reality (Ayé et al. Reference Ayé, Schweizer and Roth2012). This might be less problematic if one is interested in mapping distribution changes on a very coarse scale. In our study, we were interested not only in the impact of changes in climatic variables but also in their impact on the wetland habitats of waterbirds. Therefore, we opted for modelling at a meso-scale and using observational data and applied a resampling-based bias correction method. As a consequence of this choice of method, in regions with very few observations such as West Siberia, Central Asia and the Congo basin in Africa, our models are likely to be poorer and it might lead to overestimation of the projected proportional range size change expansion in these regions. As West Siberia and Central Asia are primarily breeding areas and our conclusions is that the Palearctic migrants are more exposed to climate change in their breeding season than during passage or winter, we do not think that the observation bias has any major consequence for our overall conclusions. Although most species are also poorly modelled in the Congo basin, this region is unlikely to be very important for most AEWA species owing to the high forest cover.
The geographic scope of this analysis covers the majority of the AEWA Agreement Area except Greenland and Canada. However, only 29 of the 554 populations listed in Table 1 of AEWA breed in the excluded areas. We could not produce models for 14 of these species for the reasons mentioned in the species selection section. For another 14 species, we produced models only for the Eurasian part of the population. Nevertheless, as these species are already distributed along the northern edge of the land mass both in the East and West Atlantic, we would expect them to respond to climate change equivalently to their Eurasian counterparts, and to have a similarly high exposure to climate change. In terms of Critical Sites, less than 30 sites (1% of all Critical Sites) are situated outside the area covered by this analysis, and it is unlikely that the omission of these sites could affect our overall conclusions.
Our models used a limited set of fixed climatic predictors, modelling the future distribution of wetlands and two other stable habitat features, terrain roughness and urbanised areas, but did not take into account other habitats or future changes in land-cover due to climate change, socio-economic factors and highly complex interactions between these. Our preliminary tests showed high collinearity between the temperature and precipitation bioclimatic variables. The models with the selected variables produced excellent AUC test statistics. Taking into account other habitat features (using land-cover classes) could have led to fewer commission errors in our models, but this would have limited our ability to project models into the future. Accounting for future habitat changes may be possible using more recent global land-use change models (Doelman et al. Reference Doelman, Stehfest, Tabeau, van Meijl, Lassaletta, Gernaat, Hermans, Harmsen, Daioglou, Biemans, van der Sluis and van Vuuren2018), but this would make it difficult to disentangle the effects of climate change from land-use change. By focusing on climatic change only, our results can be used to identify areas where land-use decisions will be of critical importance for waterbird conservation.
We did not consider the impact of climate change on key coastal staging and wintering areas because reliable quantitative models of sea-level rise were unavailable when we produced our species distribution models. However, this is a potentially important risk posed by climate change especially for waders dependent on coastal mudflats. Future work could consider using satellite imagery to predict the impacts at different levels of sea-level rise to individual Critical Sites in the AEWA Agreement Area similar to the work of Iwamura et al. (Reference Iwamura, Possingham, Chadès, Minton, Murray, Rogers, Rogers, Treml and Fuller2013) in the East Asian–Australasian flyway.
Conclusions
In arguably the most comprehensive assessment to date of the future impacts of climate change on migratory waterbirds across the territory of a flyway instrument, we have shown that while the climate suitability for many populations on passage and wintering grounds may increase, the most negative impacts of climate change are projected for breeding populations, particularly of High Arctic species and dispersive Afrotropical species. For many of these species, the overlap of their distributions with existing protected areas is low, requiring significant expansion of existing national and international protected area networks. The management of these sites should be adapted in response to the significant projected changes in waterbird communities, while for the many widely dispersed species not concentrated in individual sites, policies requiring or incentivising appropriate landscape-scale habitat and water resource management will be critical, particularly for species that occur in anthropogenic landscapes, such as those dominated by many forms of agriculture. Finally, for many of the waterbird populations with greatest climate change exposure, particularly in Africa, efforts to enable them to adapt to climate change may be particularly challenging because of weak governance, low resources, limited technical capacity, and greater climate change impacts on their human populations. Addressing the conservation of these internationally important migratory waterbird populations in that context will require concerted international effort, which we hope our projections will catalyse and inform.
Supplementary Materials
To view supplementary material for this article, please visit http://doi.org/10.1017/S0959270921000150.
Acknowledgements
This study was produced in the framework of the of the Climate Resilient Flyway project (https://www.wetlands.org/casestudy/creating-climate-resilient-wetlands-for-waterbirds-and-communities-across-the-african-eurasian-flyway/) supported by the International Climate Initiative (https://www.international-climate-initiative.com /) on the basis of a decision adopted by the German Bundestag and by the Agreement on the Conservation of African-Eurasian Migratory Waterbirds. We thank the project management and the project’s steering committee for their support. This analysis would not have been possible without the work of professional and citizen scientists and the national coordinators of the Important Bird and Biodiversity Area Programme of BirdLife International, the International Waterbird Census coordinated by Wetlands International, the European Breeding Bird Atlas and the Southern African Bird Atlas projects as well as the online databases of bird observations. Our special thanks to Tom Langendoen (Wetlands International), Mike Evans and Gill Bunting (BirdLife International), Hisko de Vries (Observation International) and Scott Mayson (BTO) for their help with extracting the relevant datasets. We also thank Simon Gillings (BTO) for additional statistical advice. We are grateful to Graeme Buchanan, David Stroud and an anonymous reviewer for their helpful comments.


 Open access