


Introduction
Listed as “Vulnerable”, Southern Black Korhaan is endemic to South Africa (Hofmeyr and Taylor Reference Hofmeyr, Taylor, Taylor, Peacock and Wanless2015, BirdLife International 2022), and is considered to be only moderately protected by the current network of protected areas where it occurs (Skowno et al. Reference Skowno, Poole and Raimondo2019). It is restricted to the area of the Northern Cape Province (Tarboton Reference Tarboton2001, Allan Reference Allan, Hockey, Dean and Ryan2005, Hofmeyr and Taylor Reference Hofmeyr, Taylor, Taylor, Peacock and Wanless2015), and the majority of its range is in the Fynbos Biome, extending into the Succulent Karoo and extreme southern part of the Nama Karoo Biome in the north and western sections of its range, and the Albany Thicket in the eastern part of its range (Mucina and Rutherford Reference Mucina and Rutherford2006).
Habitat loss and degradation due to cultivation are considered to be the primary threats to Southern Black Korhaan (Hockey et al. Reference Hockey, Underhill, Neatherway and Ryan1989, Uys Reference Uys1988, Hofmeyr and Taylor Reference Hofmeyr, Taylor, Taylor, Peacock and Wanless2015), the consequence of this being reduced breeding success and/or reduced adult longevity and possibly increased predation of adult birds (Barnard and de Villiers Reference Barnard and de Villiers2012).
Uys (Reference Uys1988) described the species as favouring “habitat in which there is an abundance of low scrub in flat lowland”. In the Western Cape, the birds are in patches of renosterveld, a specialised and threatened form of fynbos (Curtis-Scott et al. Reference Curtis-Scott, Gouldberg, Helme, McMaster, Privett and Stirton2020, Moncrieff Reference Moncrieff2021), that remain between the wheat lands, i.e. in the remnant patches of the natural vegetation (Uys Reference Uys1988, Young et al. Reference Young, Harrison, Navarro, Anderson and Colahan2003). Within the Korhaan’s distribution range, seven renosterveld vegetation types are listed as “Critically Endangered”, “Endangered”, or “Vulnerable” to extinction (Mucina et al. 2006–Reference Mucina, Rutherford and Powrie2018). Birds are occasionally observed feeding in cultivated fields with cover nearby (Hockey et al. Reference Hockey, Underhill, Neatherway and Ryan1989, Martin and Pepler Reference Martin and Pepler1995, Young et al. Reference Young, Harrison, Navarro, Anderson and Colahan2003). In the Succulent Karoo the birds favour areas dominated by dwarf succulents and few grasses (Crowe et al. Reference Crowe, Essop, Allan, Brooke and Komen1994). The birds in the southern Nama Karoo frequent semi-arid rangelands dominated by perennial Asteraceae and perennial grasses (Crowe et al. Reference Crowe, Essop, Allan, Brooke and Komen1994).
Sustainable development could be achieved by promoting land use practices that favour habitat perforation which allocates space for both development and the conservation of biodiversity in the landscape (e.g. Pool-Stanvliet Reference Pool-Stanvliet, Duffell-Canham, Pence and Smart2017, Phalan et al. Reference Phalan, Onial, Balmford and Green2011). An example of land use planning that favours habitat perforation is the current network of protected areas, critical biodiversity areas, “whose safeguarding is critically required to meet biodiversity pattern and process thresholds”, and ecosystem support areas, that are required to prevent the degradation of critical biodiversity areas and protected areas, described in the Western Cape biodiversity spatial plan (Pool-Stanvliet Reference Pool-Stanvliet, Duffell-Canham, Pence and Smart2017). Together, these areas contribute to the formation of a perforated landscape in which the most important remaining patches of natural vegetation are either linked (e.g. fynbos or forest) or are close enough to each other to permit the immigration and emigration of animals. The perforations are the transformed habitats (e.g. fields for crop agriculture, urban areas, etc.) where development has and should occur.
This method of spatial planning is designed to promote both development and biodiversity conservation. However, different species may respond differently to both habitat loss and fragmentation, and it is important to assess these impacts on species of conservation concern, including impacts on densities as well as the risk of extinction. This will identify which species are priorities for conservation, and will contribute to determining how best to conserve them. The International Union for Conservation of Nature (IUCN) criteria for assessing a species’ risk of extinction (IUCN 2001, 2010) includes its population size, the rate at which it is declining, and assesses changes in the distribution range of a species and/or the area of suitable habitat available to the species within its distribution range. It includes assessing the extent to which the population of a species is fragmented because of fragmentation of its habitat. In addition, it is necessary to assess to what extent the protected areas, critical biodiversity areas, and ecosystem support areas contribute to the conservation of Southern Black Korhaan in a perforated landscape.
In this study I determined whether Southern Black Korhaan prefers any of the biomes, azonal vegetation, which is vegetation that cannot be allocated to one of the biomes, and non-terrestrial vegetation (e.g. estuarine) present in its distribution range. Second, I determined which of the land use land cover (LULC) categories in the 1990, 2014, and 2020 LULC databases and maps (GeoTerraImage 2015a,b, 2016, Department of Environment, Forestry and Fisheries 2021) adequately represent suitable breeding and/or feeding habitat for the birds. Once established, subsequent objectives were to determine whether the relative abundance of Southern Black Korhaan is affected by the loss and fragmentation of its habitat. An additional objective was to determine changes in the bird’s relative abundance and the area of suitable habitat available to the birds. The final objective was to assess the contribution that the current network of protected areas, critical biodiversity areas, and ecosystem support areas make to the conservation of Southern Black Korhaan.
Methods
Distribution data from SABAP1 and SABAP2
The first South African Bird Atlas Project (SABAP1) was conducted for about five years from 1987 to 1991 (Harrison et al. Reference Harrison, Allan, Underhill, Herremans, Tree, Parker and Brown1997), and data were collected as one checklist per observer per month per quarter degree grid cell (15’ × 15’, mean area of c.64,000 ha). The second South African Bird Atlas Project (SABAP2) (Brookes et al. Reference Brookes, Rose, Altwegg, Lee, Nel, Ottosson and Retief2022) started in 2007 and is ongoing (2007–2021, c.15 years). The temporal and spatial resolution of data collection during SABAP2 for a full-protocol checklist is a minimum of two hours and a maximum of five consecutive days per pentad (5’ × 5’, mean area of 7,220 ha), i.e. at a resolution approximately nine times smaller than in SABAP1.
The distribution range and reporting rates of Southern Black Korhaan for SABAP1 and SABAP2 were downloaded from SABAP2 https://sabap2.birdmap.africa/species/4134) on 24 August 2021 (Figure S1). In SABAP1 and SABAP2, the reporting rate is the proportion of checklists per quarter degree grid cell or pentad on which a species was recorded respectively and is a measure of the relative abundance of each species (Harrison et al. Reference Harrison, Allan, Underhill, Herremans, Tree, Parker and Brown1997). The reporting rate was adjusted by replacing any values of 1 with 0.99, to ensure that all final values were >0 and <1, which is a requirement of a response variable in beta regressions (Cribari-Neto and Zeileis Reference Cribari-Neto and Zeileis2010). Beta regressions are suited to assessing binomial data such as the reporting rate used in the atlas projects as a measure of a species’ relative abundance (Cribari-Neto and Zeileis Reference Cribari-Neto and Zeileis2010).
During SABAP1 Southern Black Korhaan was considered conspecific with Northern Black Korhaan (Crowe et al. Reference Crowe, Essop, Allan, Brooke and Komen1994, Allan Reference Allan, Harrison, Allan, Underhill, Herremans, Tree, Parker and Brown1997, Reference Allan, Hockey, Dean and Ryan2005). Subsequently, the distribution of Southern Black Korhaan in SABAP1 was identified as the quarter degree grid cells that contain one or more pentads of the pentad-based distribution of Southern Black Korhaan from SABAP2. Their distribution ranges do not overlap (Evans Reference Evans2022). Where appropriate, the distribution range (based on quarter degree grid cells or pentads) were used as masks in ArcMap 10.8 (ESRI Inc. 2020) to extract the data from the 1990, 2014, and 2020 LULC maps that describes the LULC of its quarter degree grid cell-based distribution range and pentad-based distribution range. The 2020 LULC map is the latest version available for South Africa.
Conservation
The distribution range based on pentads was used as a mask to extract the identities, location, and areas of the protected areas in which the species occurred (South African Protected Areas Database) (Department of Environmental Affairs 2021b), as well as the critical biodiversity areas and ecosystem support areas from the Northern Cape (Holness and Oosthuyzen Reference Holness and Oosthuysen2016), Western Cape (Pool-Stanvliet et al. Reference Pool-Stanvliet, Duffell-Canham, Pence and Smart2017), and Eastern Cape (Department of Economic Development and Environmental Affairs Reference Hawley, Desmet and Berliner2019) biodiversity spatial conservation plans. These masks were then used to extract the 2020 LULC data for these areas (Department of Environment, Forestry and Fisheries 2021). These 2020 LULC data were used to calculate the habitat available to Southern Black Korhaan in these areas and to assess the contribution they make to conserving the birds. This assumed that these areas will be maintained in their 2020 condition as described by the 2020 LULC map (Department of Environment, Forestry and Fisheries 2021).
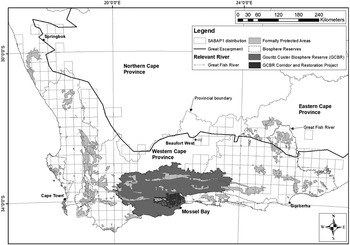
The potential future protected areas identified in the National Protected Areas Expansion Strategy (Department of Environmental Affairs 2018), critical biodiversity area and ecosystem support areas (Holness and Oosthuysen Reference Holness and Oosthuysen2016, Pool-Stanvliet et al. Reference Pool-Stanvliet, Duffell-Canham, Pence and Smart2017, Department of Economic Development and Environmental Affairs Reference Hawley, Desmet and Berliner2019) were based on all available relevant information which included Biosphere Reserves (Department of Environmental Affairs 2021a) and Important Bird and Biodiversity Areas (IBAs) (Marnewick et al. Reference Marnewick, Retief, Theron, Wright and Anderson2015). Consequently, the contribution that Biosphere Reserves and IBAs make to the conservation of Southern Black Korhaan will include only specific projects in these areas that have a measurable impact on habitat for Southern Black Korhaan. An example of this is the Gouritz Cluster Biosphere Reserve’s Corridors and Rehabilitation Programme (Figure 1).

Figure 1. The locality of formally protected areas and the Gouritz Cluster Biosphere Reserve’s Corridor and Rehabilitation Project that are located within the quarter degree grid cell-based distribution range of the Southern Black Korhaan (see also Figure 2a–h).
Aspect and slope
Anecdotal information suggests that Southern Black Korhaan prefers reasonably flat terrain (Uys Reference Uys1988). The method used to determine the aspect and slope of the terrain preferred by the birds is explained in Appendix S1 of the Supplementary material.
LULC categories and Southern Black Korhaan habitat
The method used to determine the LULC categories that best represent suitable habitat for the bird is described in Appendix S2.
Assessing impacts and change
The effects of habitat loss and fragmentation on Southern Black Korhaan meta-populations was assessed for 1990, 2014, and 2020, respectively, using beta regression models in R (R Development Core Team 2020) with RStudio as the graphic user interface (RStudio Team 2020). The R library “betareg” (Cribari-Neto and Zeileis Reference Cribari-Neto and Zeileis2010) was used with the reporting rate as the response variable and select landscape metrics of the Southern Black Korhaan habitats (LULC categories) as the predictor variables. The 69 incomplete pentads along the coast and pentads with fewer than four full protocol cards were excluded from the beta regressions but not from the other assessments. The relative abundance of a species in pentads with fewer than four full protocol cards is likely to be inaccurate because the pentad has not been sufficiently surveyed.
During SABAP1, four or more full protocol cards were submitted for all quarter degree grid cells (n = 267, median = 49, min = 4, max = 1,407) in which Southern Black Korhaan had been recorded (Figure S1a and b). During SABAP2, a minimum and maximum of 1 and 1,015 (median = 9) full protocol cards, respectively, were submitted for all pentads (n = 773) in which Southern Black Korhaan had been recorded (Figure S1a and b). Throughout the species’ distribution range, four or more full protocol cards were submitted for 483 complete pentads that are not along the coast. In addition, the number of cards submitted for the nine pentads per quarter degree grid cell was combined for the assessment of change between the two atlas periods. Consequently, to date during SABAP2, four or more full-protocol cards were submitted for the nine pentads per quarter degree grid cell (n = 287, median = 32, min = 4, max = 843) in which Southern Black Korhaan had been recorded during both atlas periods (Figure S1a and b).
The effects of habitat loss were assessed by determining (1) whether the relative abundance of Southern Black Korhaan was affected by changes in the total area (ha) per pentad and changes in the mean patch size (ha) per pentad of each LULC category considered to be suitable habitat (McGarigal Reference McGarigal2015), and (2) determining the per pentad mean perimeter-area ratio of the patches per LULC category that was considered suitable habitat. The effects of habitat fragmentation were assessed by determining whether the relative abundance of Southern Black Korhaan was affected by the per pentad Euclidean nearest-neighbour distance (m) per LULC category, which was calculated as the edge-to-edge distance from each patch of a LULC category considered suitable habitat for Southern Black Korhaan, to the nearest neighbouring patch of the same LULC category (McGarigal Reference McGarigal2015). FragStats (v4.2.1) (McGarigal Reference McGarigal2015) was used to calculate these landscape metrics.
Each beta regression model, fitted using a maximum likelihood estimation procedure, initially consisted of the reporting rate as the response variable and was constructed with one of the five link functions, i.e. logit, probit, cloglog, cauchit, and loglog, respectively, and one of the four landscape metrics calculated for the LULC categories considered potentially suitable habitat for Southern Black Korhaan as the predictor variables (Tables S3 and S4). The R library “MuMIn” (Barton Reference Barton2020) was used to compare the five models and the model with the lowest AICc value was selected as the best model, i.e. the best link function. The “dredge” function in the R library “MuMIn” was then used to test different combinations of the predictor variables (habitats) of the selected model and the combination with the lowest AICc value was selected as the minimum adequate beta regression model, and subsequently used to determine which LULC categories represent suitable habitat for the birds (Tables S3 and S4) and to make predictions (P <0.01).
Generalised linear models (GLMs), using the quasipoisson family, were used in R to assess the correlation between the total area per quarter degree grid cell of the 1990, and per pentad of the 2014 and 2020 LULC categories, respectively, considered to be suitable Southern Black Korhaan habitat. The total area of the indigenous vegetation per pentad was used as the response variable and the total area of the transformed habitats per quarter degree grid cell or pentad were used as the predictor variables.
Habitat changes from 1990 to 2020
The use of the same method and LULC categories (n = 72) to produce the 1990 (GeoTerraImage 2016) and 2014 (GeoTerraImage 2015b) LULC databases and maps permits an assessment of the change in LULC between these two points in time. The 1990 and 2014 LULC database and maps were produced at a resolution of 30 × 30 m (GeoTerraImage 2015a,b, 2016). The 2020 LULC database and map were produced using a similar method to the previous two LULC databases and maps but is based on different LULC categories (n = 73) and was produced at a resolution of 20 × 20 m (Department of Environment, Forestry and Fisheries 2021).
To make it possible to compare the changes in LULC categories between 1990 and 2020, and the relative abundance of the birds in 1992 from SABAP1, and 2020 from SABAP2, it was necessary to reclassify the LULC categories of the two maps into the same set of 12 LULC categories on terrain with a slope of ≤4° (Tables S3 and S4). In addition to this, the original 20 × 20 m resolution of the reclassified 2020 LULC map was resampled to a resolution of 30 × 30 m to match that of the 1990 map.
The area of suitable habitat available to Southern Black Korhaan is the area within its pentad-based distribution range that is potentially occupied by it. The Southern Black Korhaan’s distribution range is the total surface area of the quarter degree grid cells or pentads, respectively, in which it was recorded during SABAP1 and SABAP2.
Estimate of changes in the relative abundance of the birds with a change in habitat
The 1990 and 2020 maps consisting of the 12 reclassified LULC categories on terrain with a slope of ≤4° and a resolution of 30 m were used for these comparisons. The data were mapped as the total surface area per LULC category per quarter degree grid cell of the bird’s quarter degree grid cell-based distribution range and pentad-based distribution range, i.e. the resolution of SABAP1. The reporting rates for SABAP1 (n = 287 quarter degree grid cells) and SABAP2 (n = 704 pentads in 287 quarter degree grid cells) were used to calculate the change in relative abundance (Underhill and Bradfield Reference Underhill and Bradfield1996, Hofmeyr Reference Hofmeyr2012, Lee et al. Reference Lee, Barnard and Altwegg2017).
The net change (% increase or decrease) from 1990 to 2020, in the total area per quarter degree grid cell of the three LULC categories, shrubland (fynbos), shrubland (other), and grassland, considered to be suitable habitat for Southern Black Korhaan was calculated as a percentage of the total area of each LULC category available in 1990. The change in the relative abundance of the birds per quarter degree grid cell was compared with the net change (%) in shrubland (fynbos), shrubland (other), and grassland per quarter degree grid cell. A relative abundance change of between -10% and 10% was considered to be variation caused by sampling variability. Values >10% and <-10% were considered to represent an increase and decrease, respectively, in the relative abundance of the birds between the two time periods. A percentage change in the surface area of a LULC category of between -10% and 10% was treated as being variation due to the inaccuracy at which the surface area of each LULC category was determined. Values >10% and <-10% were considered to represent a significant increase and decrease, respectively, in the surface area of a LULC category between 1990 and 2020.
Results
Aspect, slope, and natural habitat fragmentation
Based on a digital elevation model with a resolution of 30 m, the mean aspect of the terrain of the exact observations from BirdLasser was 160.1° (n = 62) and did not differ significantly (Watson–Wheeler test, W = 0.93, P = 0.63) from the mean aspect of the terrain of the random points of 132.0° (n = 62). Consequently, aspect was not considered in any further analyses. The mean slope of the terrain of the exact observations was 2.89° (n = 62, lower 95% CI = 1.79, upper 95% CI = 3.99, median = 2.04), and the mean slope of the terrain of the random points was 4.99 (n = 62, lower 95% CI = 3.78, upper 95% CI = 6.2, median = 2.87) (Figures 1, 2a, and S2b). The difference between the median values of the slope of the terrain of the exact observations and random points is significant (U = 1,375.5, P = 0.009). The upper 95% CI of the slope of the terrain of the exact observation was 3.99°. In addition, a habitat suitability model for Southern Black Korhaan suggested that the birds prefer terrain with a slope of ≤5° (Evans Reference Evans2022). Evans (Reference Evans2022) demonstrated that the Great Escarpment, dominated by slopes >4°, serves as the primary barrier between the Southern and Northern Black Korhaan’s ranges. Consequently, Southern Black Korhaan is conservatively estimated to prefer terrain with a slope of ≤4°. Unless specified otherwise, the LULC maps and databases that correspond to terrain with a slope of ≤4° were used for all subsequent analyses (Figure 2a). In the pentad-based distribution range of Southern Black Korhaan, the total area of the terrain with a slope of ≤4° was 3,170,870 ha, which corresponds to 58% of the total area of 5,455,828 ha.

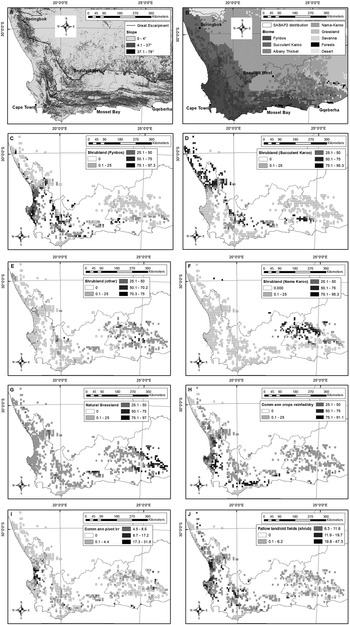
Figure 2. Maps of the pentad-based (n = 773) distribution of Southern Black Korhaan. (a) The slope (°) calculated at a resolution of 30 m of the terrain in the southern section of the Northern Cape, Western Cape, and the western section of the Eastern Cape Provinces. The approximate position of the summit of the Great Escarpment is also indicated. (b) The pentad-based distribution of the biomes in the southern section of the Northern Cape, Western Cape, and western section of the Eastern Cape Provinces. (c)–(g) Maps of the percentage cover per pentad on terrain with a slope of ≤4°of five natural land use land cover (LULC) categories from the 2020 LULC data. (h)–(j) Maps of the percentage cover per pentad of three transformed LULC categories on terrain with a slope of ≤4° from the 2020 LULC data.
Biomes and LULC (habitat) preferences
The Forest and Savanna Biomes are the only two biomes in which Southern Black Korhaan has not been recorded (Table S2). Throughout its distribution range, Southern Black Korhaan showed a significant preference (X 26 = 21.09, P <0.01, n = 828) for only the Fynbos Biome (Figures 2b and S2a).
In 1990, 2014, and 2020, the distributional range of Southern Black Korhaan consisted of 63, 62, and 66 LULC categories, respectively (Tables S3 and S4). Based on the 2020 LULC data, an increase in the total area per pentad of natural habitat, i.e. low shrubland (other), low shrubland (fynbos), low shrubland (succulent karoo), low shrubland (nama karoo), natural grassland, and transformed areas, i.e. fallow land and old fields (low shrub), was associated with a significant increase in the reporting rate of Southern Black Korhaan (Tables S6 and S7). Similar trends were obtained when using the 2014 LULC data (Table S8). Based on the 2014 data, an increase in the total area per pentad of grassland, shrubland fynbos, low shrubland, and cultivated commercial fields (low) was associated with a significant increase in the reporting rate of Southern Black Korhaan (Table S8), whereas, based on the 1990 data, an increase in the bird’s reporting rate was associated with an increase in the total area per quarter degree grid cell of shrubland fynbos only (Table S9). These results suggest that low shrubland (other), low shrubland (fynbos), low shrubland (Succulent Karoo), low shrubland (Nama Karoo), natural grassland, and fallow land and old fields (low shrub) might be suitable habitat for Southern Black Korhaan (Tables S6 and S7).
The chi-square test based on the exact locality of the birds from BirdLasser and the corresponding LULC categories indicated (X 213 = 13.68, P <0.01, n = 55) that low shrubland (fynbos), fallow land, and old fields (low shrub), and commercial annual crops rain-fed/dryland are potentially suitable habitat for the birds (Tables S1, S4, and S5, Figure S2b). In 1990 and 2014, grassland, shrubland fynbos, low shrubland, and cultivated commercial fields (low) were identified as potentially suitable habitat for Southern Black Korhaan by the beta regression models (Tables S3, S6, S8, and S9). The similar results of the beta regressions and chi-square test suggest that the identified LULC categories can be used to represent suitable habitat for Southern Black Korhaan. Identification of the LULC categories that represent suitable habitat for Southern Black Korhaan will be refined further in the next section.
Effects of agricultural expansion, habitat loss, and fragmentation
In this section the 2020 LULC data will be presented first followed by reference to the 2014 and 1990 LULC data where relevant. This is because the 2020 LULC data are the most recent and are based on updated LULC categories that will be used for future datasets and maps.
Based on the 2020 data, the loss of natural habitat for Southern Black Korhaan was due to a significant decline in the total area per pentad of low shrubland (fynbos) and low shrubland (succulent karoo). This loss of natural habitat was because of an increase in commercial annual crops rain-fed/dryland (Table S11, Figure 2b–d and h). The trends were similar when using the 2014 LULC data (Table S12). Based on the 2014 data, a significant decline in the total area per pentad of shrubland fynbos and low shrubland (succulent karoo) was because of an increase in cultivated commercial fields (high) (Table S12). These results indicated that the conversion of natural vegetation to fields for crop agriculture remains the most extensive and significant cause of the loss of natural habitat available to Southern Black Korhaan (Tables S11 and S12).
Based on the 2014 and 2020 data, a significant decline in the total area per pentad of low shrubland (nama karoo) was because of an increase in grassland (2014) and natural grassland (2020) (Tables S11, S12, Figure 2b, f, and g). The increase in grassland, mostly on fallow fields, resulted in a decrease in natural habitat (nama karoo and natural grasslands) available to Southern Black Korhaan.
Based on the 2020 LULC data, a significant increase in the reporting rate per pentad was associated with a significant increase in the mean per pentad patch area of low shrubland (nama karoo) (Table S7). Based on the 2014 LULC data, this relationship was only significant for grassland and low shrubland (Tables S8). This indicates that larger patches of natural habitat are better for Southern Black Korhaan compared with smaller patches. The absence of any significant relationship between the bird’s reporting rate and commercial annual crops rain-fed/dryland, and commercial annual crops pivot irrigated suggests that these transformed areas are not suited to the birds.
Based on the 2020 LULC data, a significant increase in the reporting rate per pentad was associated with a significant decrease in the mean distance between patches per pentad of low shrubland (other), low shrubland (fynbos), and low shrubland (nama karoo) (Table S7). Based on the 2014 LULC data, this inverse relationship was only significant for grassland (Table S9). Based on the 2020 LULC data, a significant increase in the reporting rate per pentad was associated with a significant increase in the mean distance between patches per pentad of low shrubland (nama karoo) and commercial annual crops rain-fed/dryland (Tables S7). These results indicate that Southern Black Korhaan has been adversely affected by the fragmentation of its natural habitat by commercial annual crops rain-fed/dryland. This trend is likely to continue in the future.
There was no significant relationship between the reporting rate and mean perimeter to area ratio of the patches per pentad of low shrubland (fynbos) (2020) or shrubland fynbos (1990 and 2014) (Tables S7 and S9). There was a significant increase in the reporting rate and decrease in the mean perimeter to area ratio of the patches per pentad of grassland (2014). Based on the 2020 data, the significant increase in the reporting rate was related to the mean perimeter to area ratio of the patches per pentad of natural grassland (Table S7). This suggests that edge effects, such as increased predation or changes in microclimate, might be affecting the Southern Black Korhaan population in natural grasslands but not currently in low shrubland (fynbos) (2020) or shrubland fynbos (1990 and 2014).
Changes in the Southern Black Korhaan reporting rate and mean patch size (ha) per pentad, per pentad mean perimeter-area ratio of the patches per LULC category, and per pentad Euclidean nearest-neighbour distance (m) per LULC category indicates that low shrubland (other), low shrubland (fynbos), low shrubland (succulent karoo), low shrubland (nama karoo), and natural grassland represent suitable habitat for Southern Black Korhaan. These results indicate that commercial annual crops rain-fed/dryland and commercial annual crops pivot irrigated are not suitable habitat for Southern Black Korhaan (Tables S6 and S7). Consequently, the combined surface area of the LULC categories representing natural vegetation on terrain with a slope of ≤4° was used to make a conservative estimate of the bird’s area of suitable habitat in each of the four years (Table 1).
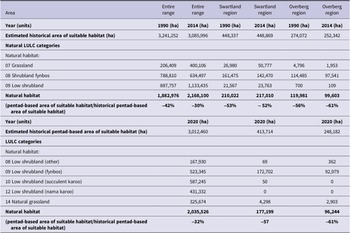
Table 1. An estimate of the historically and current pentad-based area of suitable habitat for Southern Black Korhaan in 1990, 2014, and 2020 on terrain with a slope of ≤4°. The estimated historical pentad-based area of suitable habitat is based on the maximum habitat estimated to be suitable for the birds prior to large-scale human habitation and transformation. LULC = land use land cover.

Changes in the distribution range and area of suitable habitat
Entire distribution range
The total surface area of the quarter degree grid cells and pentads in which Southern Black Korhaan was recorded during SABAP1 (n = 275 quarter degree grid cells) and SABAP2 (n = 783 pentads) defines the bird’s quarter degree grid cell-based distribution range and pentad-based distribution range as 16,060,710 ha and 5,455,841 ha, respectively. The bird’s pentad-based distribution range is only 34% of its quarter degree grid cell-based distribution range.
During SABAP2, Southern Black Korhaan was recorded in an additional 38 quarter degree grid cells or 2,402,972 ha in which they had not been recorded during SABAP1 (Figure 3a). This was accompanied by a net increase of 24% in the availability of suitable habitat for the birds (Figure 4). Grasslands and shrubland (other) increased whereas shrubland fynbos decreased (Figure 4). However, during SABAP1 the birds were recorded in 52 quarter degree grid cells or 2,665,353 ha in which they had not been recorded during SABAP2 (Figure 3a). This was accompanied by a net decrease of 1% in the availability of suitable habitat for the birds (Figure 4). Grasslands and shrubland (other) increased slightly whereas shrubland fynbos decreased substantially (Figure 4). In the quarter degree grid cells in which Southern Black Korhaan was recorded in SABAP1 and SABAP2 there was a net increase of 12% in the habitat available to the birds (Figure 4). The availability of grassland increased substantially followed by shrubland (other), whereas shrubland (fynbos) once again declined (Figure 4). There was a net decline in the bird’s quarter degree grid cell-based distribution range of 262,381 ha (n = 14 quarter degree grid cell) to 15,798,330 ha (n = 261 quarter degree grid cells), or by 1.6% from 1992 to 2020 (c.29 years).

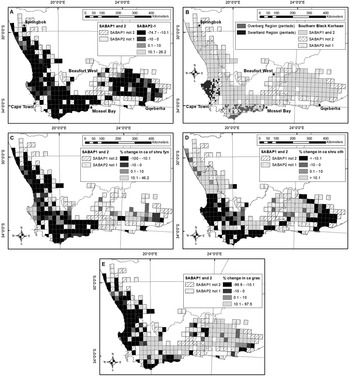
Figure 3. Maps of the quarter degree grid cell-based (n = 287) distribution range of Southern Black Korhaan. (a) The changes in the relative abundance of Southern Black Korhaan per quarter degree grid cell between SABAP1 and SABAP2. (b) The pentads and quarter degree grid cells in the Swartland and Overberg regions in which Southern Black Korhaan has been recorded. Change in the total area per quarter degree grid cell of (c) shrubland (fynbos), (d) shrubland (other), and (e) grassland on terrain with a slope of ≤4°. SABAP = South African Bird Atlas Project.

Figure 4. The percentage change in the availability of suitable habitat for Southern Black Korhaan on terrain with a slope of ≤4° in the quarter degree grid cell in which the bird was recorded in SABAP1 and SABAP2, SABAP 1 only, and SABAP2 only. SABAP = South African Bird Atlas Project.
Figure 3a illustrates that the changes in the quarter degree grid cells occupied by the birds between 1990 and 2020 occurred mostly along the edge of the bird’s distribution range. Of the 52 quarter degree grid cells in which the birds were recorded during SABAP1 and not SABAP2, 48 are on the edge of the bird’s distributional range and the remaining four perforated the bird’s distribution range (Figure 3a). Of the 38 quarter degree grid cells in which the birds were recorded in SABAP2 and not SABAP1, 34 are on the edge of the bird’s distribution range, and the remaining four are isolated from the bird’s contiguous distribution forming three “islands” (Figure 3a).
The area of suitable habitat occupied by Southern Black Korhaan within its pentad-based distribution range defines its pentad-based area of suitable habitat, which was 1,882,976 ha, 2,168,100 ha, and 2,035,526 ha according to the LULC data for 1990, 2014, and 2020, respectively (Table 1). This includes only the LULC categories on terrain with a slope of ≤4° considered to be suitable natural habitat for Southern Black Korhaan, which in 2020 consisted of low shrubland (other), low shrubland (fynbos), low shrubland (succulent karoo), low shrubland (nama karoo), and natural grassland, which was 8.2%, 25.7%, 28.8%, 21.2%, and 16% of its pentad-based area of suitable habitat, respectively. The bird’s pentad-based area of suitable habitat was between 35% and 40% of its pentad-based distribution range. Based on the 1990, 2014, and 2020 LULC data, prior to large-scale human habitation and transformation (c.1850), between 3,012,460 ha and 3,241,252 ha of suitable habitat for the birds was estimated to have been historically available (Table 1). The estimated suitable habitat historically available to the birds in its pentad-based distribution range was between 55% and 59% of its pentad-based distribution range (Table 1). The decline in the Southern Black Korhaan’s pentad-based area of suitable habitat from its historical pentad-based area of suitable habitat was between 30% and 42%, which means that between 58% and 70% of its pentad-based area of suitable habitat remained (Table 1). However, there is unfortunately no information on the quality of the remaining habitat.
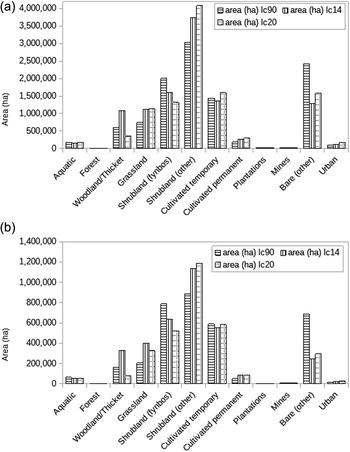
The decline in the Southern Black Korhaan’s pentad-based area of suitable habitat from 2014 to 2020 (5 years) was 4% or 0.8% per year or 20% over three generations (31 years) (BirdLife International. 2022). The larger declines in its pentad-based area of suitable habitat compared with its historical pentad-based area of suitable habitat and the more recent small declines in its pentad-based area of suitable habitat from 2014 to 2020 indicate that much of the suitable habitat for Southern Black Korhaan was lost prior to 1990 (Table 1). As previously mentioned, this loss has been caused mainly by conversion of especially natural fynbos habitat to fields for crop agriculture (Tables S10–S12). The conversion of primarily fynbos habitat is supported by the net decrease in shrubland (fynbos), whereas both shrubland (other) and cultivated temporary have increased (Figures 4a and b and 5a and b). It is further supported by the net increase in cultivated temporary from 588,603 ha to 648,597 ha (Figure 6a and b) according to the bird’s pentad-based distribution range or an increase of 10.2%. Based on the bird’s quarter degree grid cell-based distribution range, cultivated temporary increased by 10.9% from 1990 to 2020 and by 89.1% prior to 1990 (Figure 6aand b).

Figure 5. The net annual change in land use land cover (LULC) on terrain with a slope of ≤4° in the (a) quarter degree grid cell-based (QDGC) and (b) pentad-based distribution range of Southern Black Korhaan.

Figure 6. The (a) quarter degree grid cell and (b) pentad-based area of the distribution range of Southern Black Korhaan covered by 12 land use land cover (LULC) categories on terrain with a slope of ≤4° in 1990, 2014, and 2020. The three LULC categories that were identified as suitable habitat for Southern Black Korhaan are grassland, shrubland (fynbos), and shrubland (other).
Selected regions
Hofmeyr (Reference Hofmeyr2012) reported the rapid decline in abundance of Southern Black Korhaan in the Overberg and Swartland regions based on data from 1998 to 2010 collected by the Coordinated Avifaunal Roadcounts (CAR) project (Young et al. Reference Young, Harrison, Navarro, Anderson and Colahan2003) (Figure 2b). Over the same period, the population in the Eastern Cape Karoo was stable or increasing (Hofmeyr Reference Hofmeyr2012). Consequently, the Overberg and Swartland regions warranted a separate assessment. In both these regions the decline in the pentad-based area of suitable habitat from the estimated historical pentad-based area of suitable habitat of between 52% and 61% is higher than the mean decline of between 30% and 42% over the bird’s entire distribution range (Table 1). Consequently, between 39% and 48% of suitable habitat is estimated to remain in these two regions. Unfortunately, the quality of the remaining habitat is not known.
Changes in the relative abundance of Southern Black Korhaan with a change in habitat
Entire distribution range
In 2020, grassland, shrubland (fynbos), and shrubland (other) constituted 16%, 25.7%, and 58.3% of the Southern Black Korhaan’s pentad-based area of suitable habitat, respectively (Figure 5b). Between 1990 and 2020, the surface area of grassland and shrubland (other) increased whereas that of shrubland (fynbos) decreased at both the quarter degree grid cell and pentad-based scales (Figures 5a and b and 6a and b). The three biomes, i.e. grasslands, shrubland (other), which consists of low shrubland (succulent karoo, nama karoo, and Albany thicket), and shrubland (fynbos) are distinct (Figures 2b and 6a and b). However, the GLMs revealed a negative relationship between grasslands and low shrubland (nama karoo) in the eastern part of the Southern Black Korhaan’s distribution (Figure 2f and g), and a similar relationship between low shrubland (fynbos) and low shrubland (succulent karoo) (Figure 2c and d) (Tables S12 and S13). This indicates that increases in shrubland (other) in addition to conversion to fields for crop agriculture (cultivated temporary) contributed to the net decline in the surface area of shrubland (fynbos) (Tables S12 and S13, Figure 6a and b).
The Southern Black Korhaan’s reporting rate declined by 22% (n = 203 quarter degree grid cells, SD = 20.3) and was accompanied by a net decline in the bird’s quarter degree grid cell-based distribution range (Figure 3a). This indicates a large decline in the relative abundance of Southern Black Korhaan between SABAP1 and SABAP2 (Figure 3a). Between SABAP1 and SABAP2, a decline of more than 10% in the bird’s reporting rate occurred in 173 of 203 quarter degree grid cells in which the birds were recorded in SABAP1 and SABAP2 (Figure 3a). This decline occurred over 55% of the bird’s quarter degree grid cell-based distribution range (Figure 3a). In addition, between SABAP1 and SABAP2, a decline of more than 10% in the total area per quarter degree grid cell of shrubland (fynbos), shrubland (other), and grassland occurred in 88 (43%), 104 (51%), and 93 (46%) of 203 quarter degree grid cells, respectively (Figure 3c–e).
Selected regions
A decline of more than 10% in the relative abundance of Southern Black Korhaan in the quarter degree grid cells in which the birds were recorded during SABAP1 and SABAP2 occurred in the Eastern Cape in 46 out of a total of 60 (Figures 3a–b). The decline in relative abundance of the birds in the Overberg and Swartland regions corresponded with a decline of more than 10% in the total area per quarter degree grid cell of shrubland (fynbos), shrubland (other), and grassland (Figure 3a–e). Unlike the Overberg and Swartland regions, the significant decline in relative abundance of the birds in the Eastern Cape was because of a significant decline in the total area per quarter degree grid cell of mostly shrubland (other) (Figure 3 and d).
Conservation
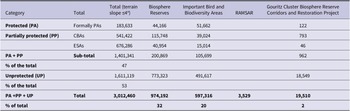
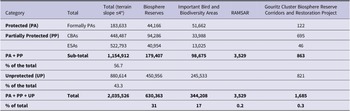
A total of 3,012,460 ha and 2,035,526 ha of suitable habitat for Southern Black Korhaan was estimated to have been available to the birds historically and in 2020, respectively (Tables 2 and 3). A total of 1,154,912 ha or 57% of the total area of habitat suitable for the birds is estimated to have been within protected areas, critical biodiversity areas, and ecosystem support areas (Table 3). These critical biodiversity areas and ecosystem support areas must be conserved and where required (critical biodiversity areas 2 and ecosystem support areas 2) rehabilitated to conserve Southern Black Korhaan and the habitats on which it and the other biodiversity within its distribution range depend. An ideal minimum would be that all critical biodiversity areas and ecosystem support areas should be rehabilitated, and together with suitable habitat in the current network of protected areas would then provide 1,401,341 ha of suitable habitat for Southern Black Korhaan (Table 3).
Table 2. Suitable natural habitat (ha) historically available to Southern Black Korhaan in strictly protected areas (PAs), critical biodiversity areas (CBAs), and ecosystem support areas (ESAs) within its pentad-based distribution range on terrain with a slope of ≤4°. There is overlap in the surface areas (ha) of the categories for the Biosphere Reserves and Important Bird and Biodiversity Areas.

Table 3. Suitable natural habitat (ha) for Southern Black Korhaan available in 2020 in strictly protected areas (PAs), critical biodiversity areas (CBAs), and ecosystem support areas (ESAs) within its pentad-based distribution range on terrain with a slope of ≤4°. There is overlap in the surface areas (ha) of the categories for the Biosphere Reserves and Important Bird and Biodiversity Areas.

An example of habitat rehabilitation is the Gouritz Cluster Biosphere Reserve’s Corridors and Rehabilitation Programme, which in conjunction with private landowners will contribute to rehabilitating and conserving 741–799 ha of critical biodiversity areas and ecosystem support areas of suitable habitat for the birds (Table 3). The relative abundance of Southern Black Korhaan has declined significantly in five of the eight quarter degree grid cells in which the Gouritz Cluster Biosphere Reserve’s Corridors and Rehabilitation Programme is being implemented (Figures 1 and 3a). The total area per quarter degree grid cell of shrubland (fynbos), shrubland (other), and grasslands has declined significantly (>10%) in six, four, and one of the eight quarter degree grid cells, respectively, in which the Gouritz Cluster Biosphere Reserve’s Corridors and Rehabilitation Programme is being implemented (Figure 2a–f).
Discussion
Available habitat, loss, and fragmentation
The habitat and population of Southern Black Korhaan is naturally fragmented by the mountain ranges within its distribution range, for example by the Hottentots Holland Mountains east of Cape Town, partly because of its preference for terrain with a slope of ≤4°. In the present, and a previous study (Hofmeyr Reference Hofmeyr2012), the loss and fragmentation of the species’ natural habitat and subsequent decline in its relative abundance from SABAP1 to SABAP2 demonstrates that Southern Black Korhaan has not benefitted from the replacement of its natural habitat with crop agriculture.
The abundance of a number of avian taxa inhabiting the interior of forest, savanna, and grassland habitats have been found to decline at a greater rate than would be predicted by habitat loss alone (Bender et al. Reference Bender, Contreras and Fahrig1998). This was found to be because of a combination of reduced habitat patch size and decreased connectivity in the landscape, i.e. there is a reduced rate of successful dispersal (Meriam 1984, Bender et al. Reference Bender, Contreras and Fahrig1998). For the biomes within the distribution range of Southern Black Korhaan, Grasslands and Fynbos Biomes have lost the most habitat compared with the other biomes and the rates of loss have increased in recent years (2014–2018) (Skowno et al. Reference Skowno, Jewitt and Slingsby2021).
In the present study, Southern Black Korhaan showed a preference for the Fynbos Biome only. Based on the results of occupancy modelling, Hofmeyr (Reference Hofmeyr2012) found that Southern Black Korhaan was most common in the Fynbos, Albany Thicket, and Succulent Karoo Biomes, and much less common in the Nama Karoo Biome. Hofmeyr (Reference Hofmeyr2012) determined that Southern Black Korhaan selected for natural vegetation in both seasons with the exception of the Little Karoo in winter.
Southern Black Korhaan has been observed, and was presumed to be feeding in cultivated fields, crop stubble, fields with crops, pastures, and fallow fields (Hockey et al. Reference Hockey, Underhill, Neatherway and Ryan1989, Martin and Pepler Reference Martin and Pepler1995, Cohen and Spottiswoode Reference Cohen, Spottiswoode, Young, Harrison, Navarro, Anderson and Colahan2003, Young et al. Reference Young, Harrison, Navarro, Anderson and Colahan2003, Hofmeyr Reference Hofmeyr2012). Southern Black Korhaan nests with eggs have occasionally been found in fields of wheat (Uys Reference Uys1988). However, the extent to which the birds breed successfully, i.e. raise offspring that survive to breed at least once, in transformed habitat remains unknown. The extent to which agricultural activities may disrupt (disturbance) feeding and breeding attempts remains unknown. It is therefore unknown whether these transformed areas represent sources or sinks. However, the large decline in the relative abundance of the birds estimated at >30% suggests that the transformed areas are probably sinks (Hofmeyr and Taylor Reference Hofmeyr, Taylor, Taylor, Peacock and Wanless2015).
Population change
The population size of Southern Black Korhaan remains unknown (Hofmeyr and Taylor Reference Hofmeyr, Taylor, Taylor, Peacock and Wanless2015). In the present and a previous study (Hofmeyr Reference Hofmeyr2012) the Southern Black Korhaan population was estimated to have declined by >30% in three generations (BirdLife International 2022).
The present study confirms Hofmeyr’s (Reference Hofmeyr2012) findings of a significant decline in the relative abundance of Southern Black Korhaan in the Swartland and Overberg regions. Compared with Hofmeyr’s (Reference Hofmeyr2012) study, the present study estimates a greater decline in the relative abundance of Southern Black Korhaan in the Eastern Cape. Based on CAR data from 1998 to 2010, the Southern Black Korhaan’s population in the Eastern Cape was estimated to be increasing from 2005 onwards (Hofmeyr Reference Hofmeyr2012), and their abundance ranged from 2 birds to 6.5 birds/100 km in 2002–2003, 2008, and 2010, respectively. Regarding the SABAP comparison maps, Hofmeyr’s (Reference Hofmeyr2012) study was based on the same SABAP1 data as used in the present study but on SABAP2 data extracted on 10 February 2012. The present study is therefore based on an additional c.10 years of data submitted to SABAP2. In addition, it is based on data from BirdLasser that did not exist and was not available at the time of Hofmeyr’s (Reference Hofmeyr2012) study.
Southern Black Korhaan is probably threatened with extinction by threats in addition to habitat fragmentation and loss to crop agriculture. Hofmeyr (Reference Hofmeyr2012) listed climate change, human disturbance, and a possible increase in predation by corvids as possible additional threats to Southern Black Korhaan. The local increase in the abundance of crows may have a detrimental impact on the breeding success of Karoo Korhaan in some areas (Peacock Reference Peacock, Taylor, Peacock and Wanless2015). Adult Korhaans form part of the diet of Verreaux’s Eagle Aquila verreauxii (Boshoff et al. Reference Boshoff, Palmer, Avery, Davies and Jarvis1991). Karoo Korhaan is the most common prey item of Martial Eagles Polemaetus bellicosus in the Karoo (Boshoff et al. Reference Boshoff, Palmer and Avery1990). There may also be a time-lag between habitat loss and population decline, which is sometimes followed by local extinction (Swift and Hannon Reference Swift and Hannon2010). This is because the adult birds may be able to persist but not replace themselves because of partially successful or unsuccessful breeding attempts. Breeding success is an indicator of habitat quality (Roberts and Norment Reference Roberts and Norment1999). Due to climate change, the Western Cape is predicted to experience higher temperatures and lower rainfall, i.e. drier conditions, in the next decades (Birch et al. Reference Birch, Jennings-Broom, Chihumbiri, van Weele and Isaacs2020). This could result in less dense vegetation providing less cover, especially for incubating female birds, which might result in higher predation rates. Drier conditions could translate to a reduction in food availability and to reduced breeding success, thus contributing to the continued decline in the population.
Estimates of distribution range and area of suitable habitat
The Southern Black Korhaan’s area of occupancy of 15,608,700 ha estimated by Hofmeyr and Taylor (Reference Hofmeyr, Taylor, Taylor, Peacock and Wanless2015) is similar to the quarter degree grid cell-based distribution range but much higher than the pentad-based distribution range estimated for the birds in the present study. The total surface areas of the quarter degree grid cells or pentads in which Southern Black Korhaan has been recorded more accurately represents the bird’s distribution range because it does not exclude all the areas that are unsuitable for the birds. Including only habitat on terrain determined to be suitable for Southern Black Korhaan resulted in the pentad-based area of suitable habitat of 2,035,526 ha estimated to be available in 2020, which is much lower than the area of occupancy estimated by Hofmeyr and Taylor (Reference Hofmeyr, Taylor, Taylor, Peacock and Wanless2015). This demonstrates that the total surface area of the quarter degree grid cells or pentads in which Southern Black Korhaan has been recorded should be used to estimate its distribution range and not its area of suitable habitat.
Current risk of extinction and conservation
The decline in the Southern Black Korhaan’s reporting rate suggests that its population has declined by >30% over three generations, which means that it meets the criteria that qualifies it as “Vulnerable” to extinction under the IUCN criteria (IUCN 2010, 2012, Taylor et al. Reference Taylor, Peacock and Wanless2015). The primary cause of the decline in the Southern Black Korhaan’s population of habitat fragmentation and loss to fields for crop agriculture has not ceased and is probably not reversible.
As a minimum, the current network of protected areas, critical biodiversity areas, and ecosystem support areas that serve as corridors between them should be conserved and where appropriate rehabilitated (e.g. the Gouritz Cluster Biosphere Reserve’s Corridors and Rehabilitation Programme) as identified in the Northern Cape (Holness and Oosthuyzen Reference Holness and Oosthuysen2016), Western Cape (Pool-Stanvliet Reference Pool-Stanvliet, Duffell-Canham, Pence and Smart2017), and Eastern Cape (Department of Economic Development and Environmental Affairs Reference Hawley, Desmet and Berliner2019) spatial conservation plans. This is an especially important priority in the Overberg and Swartland regions where very little indigenous vegetation remains and is similar to the recommendation that isolated patches of suitable habitat should be linked with corridors of indigenous vegetation (Hofmeyr and Taylor Reference Hofmeyr, Taylor, Taylor, Peacock and Wanless2015). Conservation of the current network should create and maintain a perforated landscape in which a viable population of Southern Black Korhaan, and the fynbos, shrubland, and grassland habitats on which it depends, may be conserved along with the other biodiversity that is dependent on the same habitats.
Recommendations for further research
The population size and density of Southern Black Korhaan in the fynbos, grassland, succulent karoo, and nama karoo habitats that it occupies should be determined. It will then be possible to assess the changes in the size of the bird’s population more directly and accurately over time and assess its risk of extinction. Measuring the breeding success of Southern Black Korhaan in the centre and along the edge of its range (i.e. the quarter degree grid cells in which the birds were recorded in SABAP2 and not SABAP1) will enable an understanding of which parts of its range are source and sink populations.
The variables mentioned above should be used to determine whether the network of protected areas, critical biodiversity areas, and ecosystem support areas are sufficient to conserve a viable population of Southern Black Korhaan, and whether habitat patch area and/or fragmentation thresholds exist below which the population will decline more rapidly than the current rate at which it is declining (Swift and Hannon Reference Swift and Hannon2010). A study of the bird’s breeding and feeding behaviour in heterogeneous landscapes (e.g. do birds feed in stubble fields and breed successfully in the adjacent suitable fynbos habitat?), together with an assessment of the impact of human disturbance from agricultural and other activities in transformed habitats (e.g. wheat fields), will show whether these are source or sink populations. Natural (Moncrieff Reference Moncrieff2021) and controlled burning of the vegetation in autumn and winter occurs across parts of the bird’s breeding range, including protected areas (e.g. Bontebok National Park), and the impacts are poorly understood.
Together, these studies would provide detailed integrated information on how the birds use the different habitats in the landscape and which land use practices constitute a threat to the bird’s breeding and feeding habitat. In addition, it will provide further clarification of the use of LULC categories to describe the habitats of Southern Black Korhaan and for estimating changes to the populations. Updates to the Southern Black Korhaan’s distribution range and population size and trends should be determined each time a new LULC map and database is compiled for South Africa. Contributors to SABAP2 using BirdLasser should be encouraged to record where the bird is located and mark the record as “exact”, and not where the observer is standing. This will contribute further to the interpretation of data collected using BirdLasser for determining which habitats (LULC categories) are preferred by the birds.
Acknowledgements
Henk Nel is thanked for developing and managing BirdLasser and for providing all the data on Southern Black Korhaan collected using BirdLasser. Every birder who has used BirdLasser to submit data on Southern Black Korhaan to SABAP2 is thanked, along with the team responsible for managing and maintaining the SABAP Project. Without your continuous contributions and work the present research project would not have been possible. The anonymous reviewers are thanked for their suggestions which contributed to improving the article. Thank you to the Gouritz Cluster Biosphere Reserve for providing financial support for this research (2011/008876/08, 930059846).
Supplementary material
The supplementary material for this article can be found at http://doi.org/10.1017/S0959270923000230.


 Open access