Prostate cancer is the second most frequent cancer diagnosis made in men and the fifth leading cause of death worldwide(Reference Rawla1). It is estimated that up to 2040, the worldwide prostate cancer risk will be elevated, with 1 017 712 new cases(2). Differences in incidence rates were up to 190-fold between the populations at the highest rate (France, Guadeloupe, 189·1/100 000 people) and the populations with the lowest rate (Bhutan, 1·0/100 000 people)(Reference Deloumeaux, Bhakkan and Eyraud3). Despite decades of research, the well-established prostate cancer risk factors are limited to advanced age, African ancestry, genetic polymorphisms and family history(Reference Rawla1). With the aetiology of prostate cancer largely unknown, feasible measures for primary prevention of the disease remain limited.
Although the variation in incidence rates across populations can be attributed to differences in diagnostic intensity arising from the practice of prostate-specific antigen (PSA) screening, the evidence of geographic variation in prostate cancer incidence predating the introduction of PSA screening suggests a potential role of lifestyle factors in prostate cancer risk(Reference Pernar, Ebot and Wilson4). Some research on migration found an increased prostate cancer incidence in immigrants who move from developing countries to industrialised countries. For example, Hsing et al.(Reference Hsing, Tsao and Devesa5) showed that compared with men living in China, the prostate cancer incidence was 16-fold higher for Chinese men living in the USA. Lee et al.(Reference Lee, Demissie and Lu6) also showed that the incidence rate of prostate cancer was 3·5 times higher in US Koreans compared with their native counterparts, while Chu et al.(Reference Chu, Ritchey and Devesa7) reported that the rate among African Americans was as high as forty times when compared with those in Africa. Epidemiological study implicated that the changes in lifestyle, including dietary factors, would induce a shift towards an increased prostate cancer incidence(Reference Rawla1). But to date, few dietary risk factors for prostate cancer have been firmly established(Reference Ballon-Landa and Parsons8).
It is estimated that by 2030, the per capita consumption of dairy food would be 65·8 kg in the developing countries and 221·0 kg in the industrialised countries(Reference Bruinsma9). High correlations between intake of dairy foods and milk and prostate cancer risk have been reported in many ecologic studies(Reference Grasgruber, Hrazdira and Sebera10,Reference Zhang and Kesteloot11,Reference Grant12) , but they are less credible than case–control and cohort studies due to their evaluation method. Data from observational cohort and case–control studies, however, have been inconclusive and the conclusion about a relationship between dairy product consumption and prostate cancer is more contradictory than in ecological studies.
Meta-analysis is a statistical method that can overcome the problem of limited sample size in the published data and draw stronger or clearer conclusions(Reference Thacker13). In 2005, Gao et al.(Reference Gao, LaValley and Tucker14) confirmed a positive association of the consumption of dairy products with prostate cancer risk, specifically in men with the highest intakes. The results of a meta-analysis in 2007(Reference Qin, Xu and Wang15) also supported the previous conclusions. However, in 2008, Huncharek et al.(Reference Huncharek, Muscat and Kupelnick16) pooled eleven cohort studies and found no evidence of an association between dairy intakes and prostate cancer risk. In 2015, a previous meta-analysis investigated dairy intakes and prostate cancer risk(Reference Aune, Navarro Rosenblatt and Chan17), suggesting that high intakes of dairy products, milk, low-fat milk and cheese may increase total prostate cancer risk. However, in 2018, the evidence that a higher consumption of dairy products increases the risk of prostate cancer went from ‘probable’ to ‘limited’ in the World Cancer Research Fund/American Institute for Cancer Research report(18). Since 2015, four additional prospective cohort studies evaluating the association between dairy product consumption and prostate cancer risk were published(Reference Preble, Zhang and Kopp19-Reference Papadimitriou, Muller and van den Brandt22). Given the discrepancies observed between the systematic reviews and meta-analysis results, we conducted an up-to-date systematic review and meta-analysis in an attempt to re-evaluate whether dairy product intake could increase the risk of prostate cancer.
Methods
Study strategy
The Meta-analysis Of Observational Studies in Epidemiology guidelines were followed to conduct this meta-analysis. We performed a systematic search of PubMed, Embase and Cochrane databases for relevant studies before March 2021 that assessed the association between dairy products consumption and the risk of prostate cancer, using the following search algorithm: (‘Dairy Products’ (Mesh) OR ‘Dairy Product’ OR ‘Product, Dairy’ OR ‘Products, Dairy’ OR milk OR yogurt OR cheese OR butter OR ice cream) AND (‘Prostatic Neoplasms’ (Mesh) OR ‘Prostate Neoplasms’ OR ‘Neoplasms, Prostate’ OR ‘Neoplasm, Prostate’ OR ‘Prostate Neoplasm’ OR ‘Neoplasms, Prostatic’ OR ‘Neoplasm, Prostatic’ OR ‘Prostatic Neoplasm’ OR ‘Prostate Cancer’ OR ‘Cancer, Prostate’ OR ‘Cancers, Prostate’ OR ‘Prostate Cancers’ OR ‘Cancer of the Prostate’ OR ‘Prostatic Cancer’ OR ‘Cancer, Prostatic’ OR ‘Cancers, Prostatic’ OR ‘Prostatic Cancers’ OR ‘Cancer of Prostate’) AND (‘Cohort Studies’ (Mesh)) NOT (‘Animal Experimentation’ (Mesh) OR ‘Case Reports’ (Publication Type) OR ‘Editorial’ (Publication Type) OR ‘Review’ (Publication Type) OR ‘Clinical Trial’ (Publication Type)). Two reviewers (ZF Zhao and DD Zhou) evaluated all the potentially relevant publications by examining their titles and abstracts. The full texts of studies that matched the eligible criteria were retrieved. We also performed manual searches according to cited references from retrieved articles and previous reviews on dairy products and prostate cancer. The results were restricted to publications. Any disagreements on study selection were resolved via group discussion.
Study selection
Given that the case–control studies are prone to recall and selection bias, which may lead to the spurious association, we only included the published cohort studies to evaluate the relationship between dietary consumption of dairy products and prostate cancer risk.
Studies were eligible for the meta-analysis if they met the following criteria: (1) cohort design; (2) exposure of interest was dairy consumption (including total dairy, milk, butter, cheese, ice cream, yogurt and other dairy products); (3) outcome was prostate cancer incidence; (4) the estimates of relative risk (RR) or hazard ratio or OR with corresponding 95 % CI were available and (5) the most recent and complete study was selected if data from the same population had been published more than once.
The following types of publications were excluded: (1) abstracts, editorials, reviews, case reports, clinical trials, conference articles and animal studies; (2) studies lacking sufficient available data and (3) articles not written in English.
Data extraction
Following variables were extracted from included articles: first author, publication year, country, study design, follow-up duration, study name, age, sex, outcome assessment, type of dairy product (e.g. total dairy, milk, butter, cheese, ice cream, cream, yogurt), intake of dairy products, outcome assessment, number of cancer case, sample size, adjustment for confounders, adjusted RR, adjusted hazard ratio, adjusted OR and 95 % CI. Data extraction was conducted by three reviewers (ZF Zhao, DD Zhou, SR Gao).
Quality and risk of bias assessment
We used the Newcastle–Ottawa scale to assess the methodological quality and bias of the enrolled studies(Reference Stang23). Newcastle–Ottawa scale score was categorised into three levels: low, moderate and high quality as the Newcastle–Ottawa scale scores of 0–5, 6–7 and 8–9. Two reviewers (XY Zeng, YX Yao) independently assessed the quality of each study. Any conflicts concerning the assessment were solved through discussion.
Statistical methods
The RR and mean difference with 95 % CI for categorical variables were calculated to investigate the relationship between dairy product intake and prostate cancer risk. When both crude and adjusted RR were provided, we used the most fully adjusted RR for all studies. As the hazard ratio and RR were interchangeable, we used the hazard ratio as RR and converted the OR to RR using a website calculator (https://clincalc.com/Stats/ConvertOR.aspx). Heterogeneity was evaluated using Cochran’s Q and I 2 statistics, in which P-value of < 0·1 and I 2 > 50 % were defined as statistically significant heterogeneity. When there existed significant heterogeneity, we used a random-effects model to summarise the test performance; otherwise, a fixed-effects model was used(Reference Higgins, Thompson and Deeks24). Subgroup analyses were conducted stratifying by dairy type, prostate cancer type, follow-up years, treatment era, collection times, adjustment for confounders and geographic location. We performed analyses for total prostate cancer, non-advanced, advanced and fatal prostate cancers. For the analysis of non-advanced cancers, we included studies that reported on low-grade, low-stage and localised cancers. Advanced prostate cancers included high-grade, high-stage, non-localised and advanced cancers. Egger’s funnel plot was performed to detect the potential publication bias. A two-sided P value of < 0·05 was considered statistically significant. The analyses were conducted using R software (version 3.6.1, https://www.rproject.org/).
We conducted dose–response analyses with the one-stage robust error meta-regression model, based on inverse variance weighted least squares regression and cluster-robust error variances(Reference Xu and Doi25). The method required RR with 95 % CI for at least two levels of dairy exposure reported, but the distribution of cases or person-years was not required. As dairy intakes were heterogeneous, we used the United States Department of Agriculture Food and Nutrient Database for Dietary Studies(26) to estimate the dose of dairy intake when studies reported intakes in servings and times/d or week. We converted intakes to grams of intake/d by using standard units of 244 g (or 244 ml) for milk and yogurt, 43 g for cheese (two slices), 14 g for butter, 135 g for ice cream and 177 g for total dairy products. The median or mean dairy intake in each category of intake was assigned to the corresponding RR for each study when it was reported. The midpoint was calculated for studies that reported a range of intake and did not provide the mean or median intake for the range of dairy intake. When the highest or lowest category was open ended, it was assumed that the open-ended interval length had the same length as the adjacent interval. The analyses were performed using STATA statistical software (version 15.1).
Results
Publication search and study selection
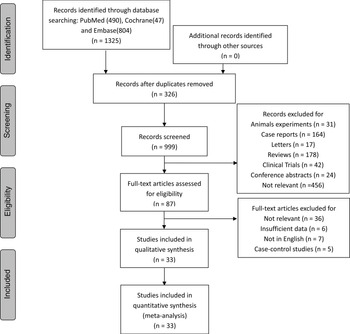
Fig. 1 shows the search strategy and study selection. A total of 1325 relevant publications were identified through PubMed, Embase and Cochrane databases. Of these publications yielded from the literature search, 326 duplicates were removed. The remaining 999 publications were screened based on titles and abstracts. After the exclusion of 912 publications, eighty-seven studies were assessed for eligibility by screening the entire text. Finally, thirty-three articles were included in our study after a review of the full text(Reference Preble, Zhang and Kopp19-Reference Papadimitriou, Muller and van den Brandt22,Reference Mills, Beeson and Phillips27-Reference Rohrmann and Van Hemelrijck55) .
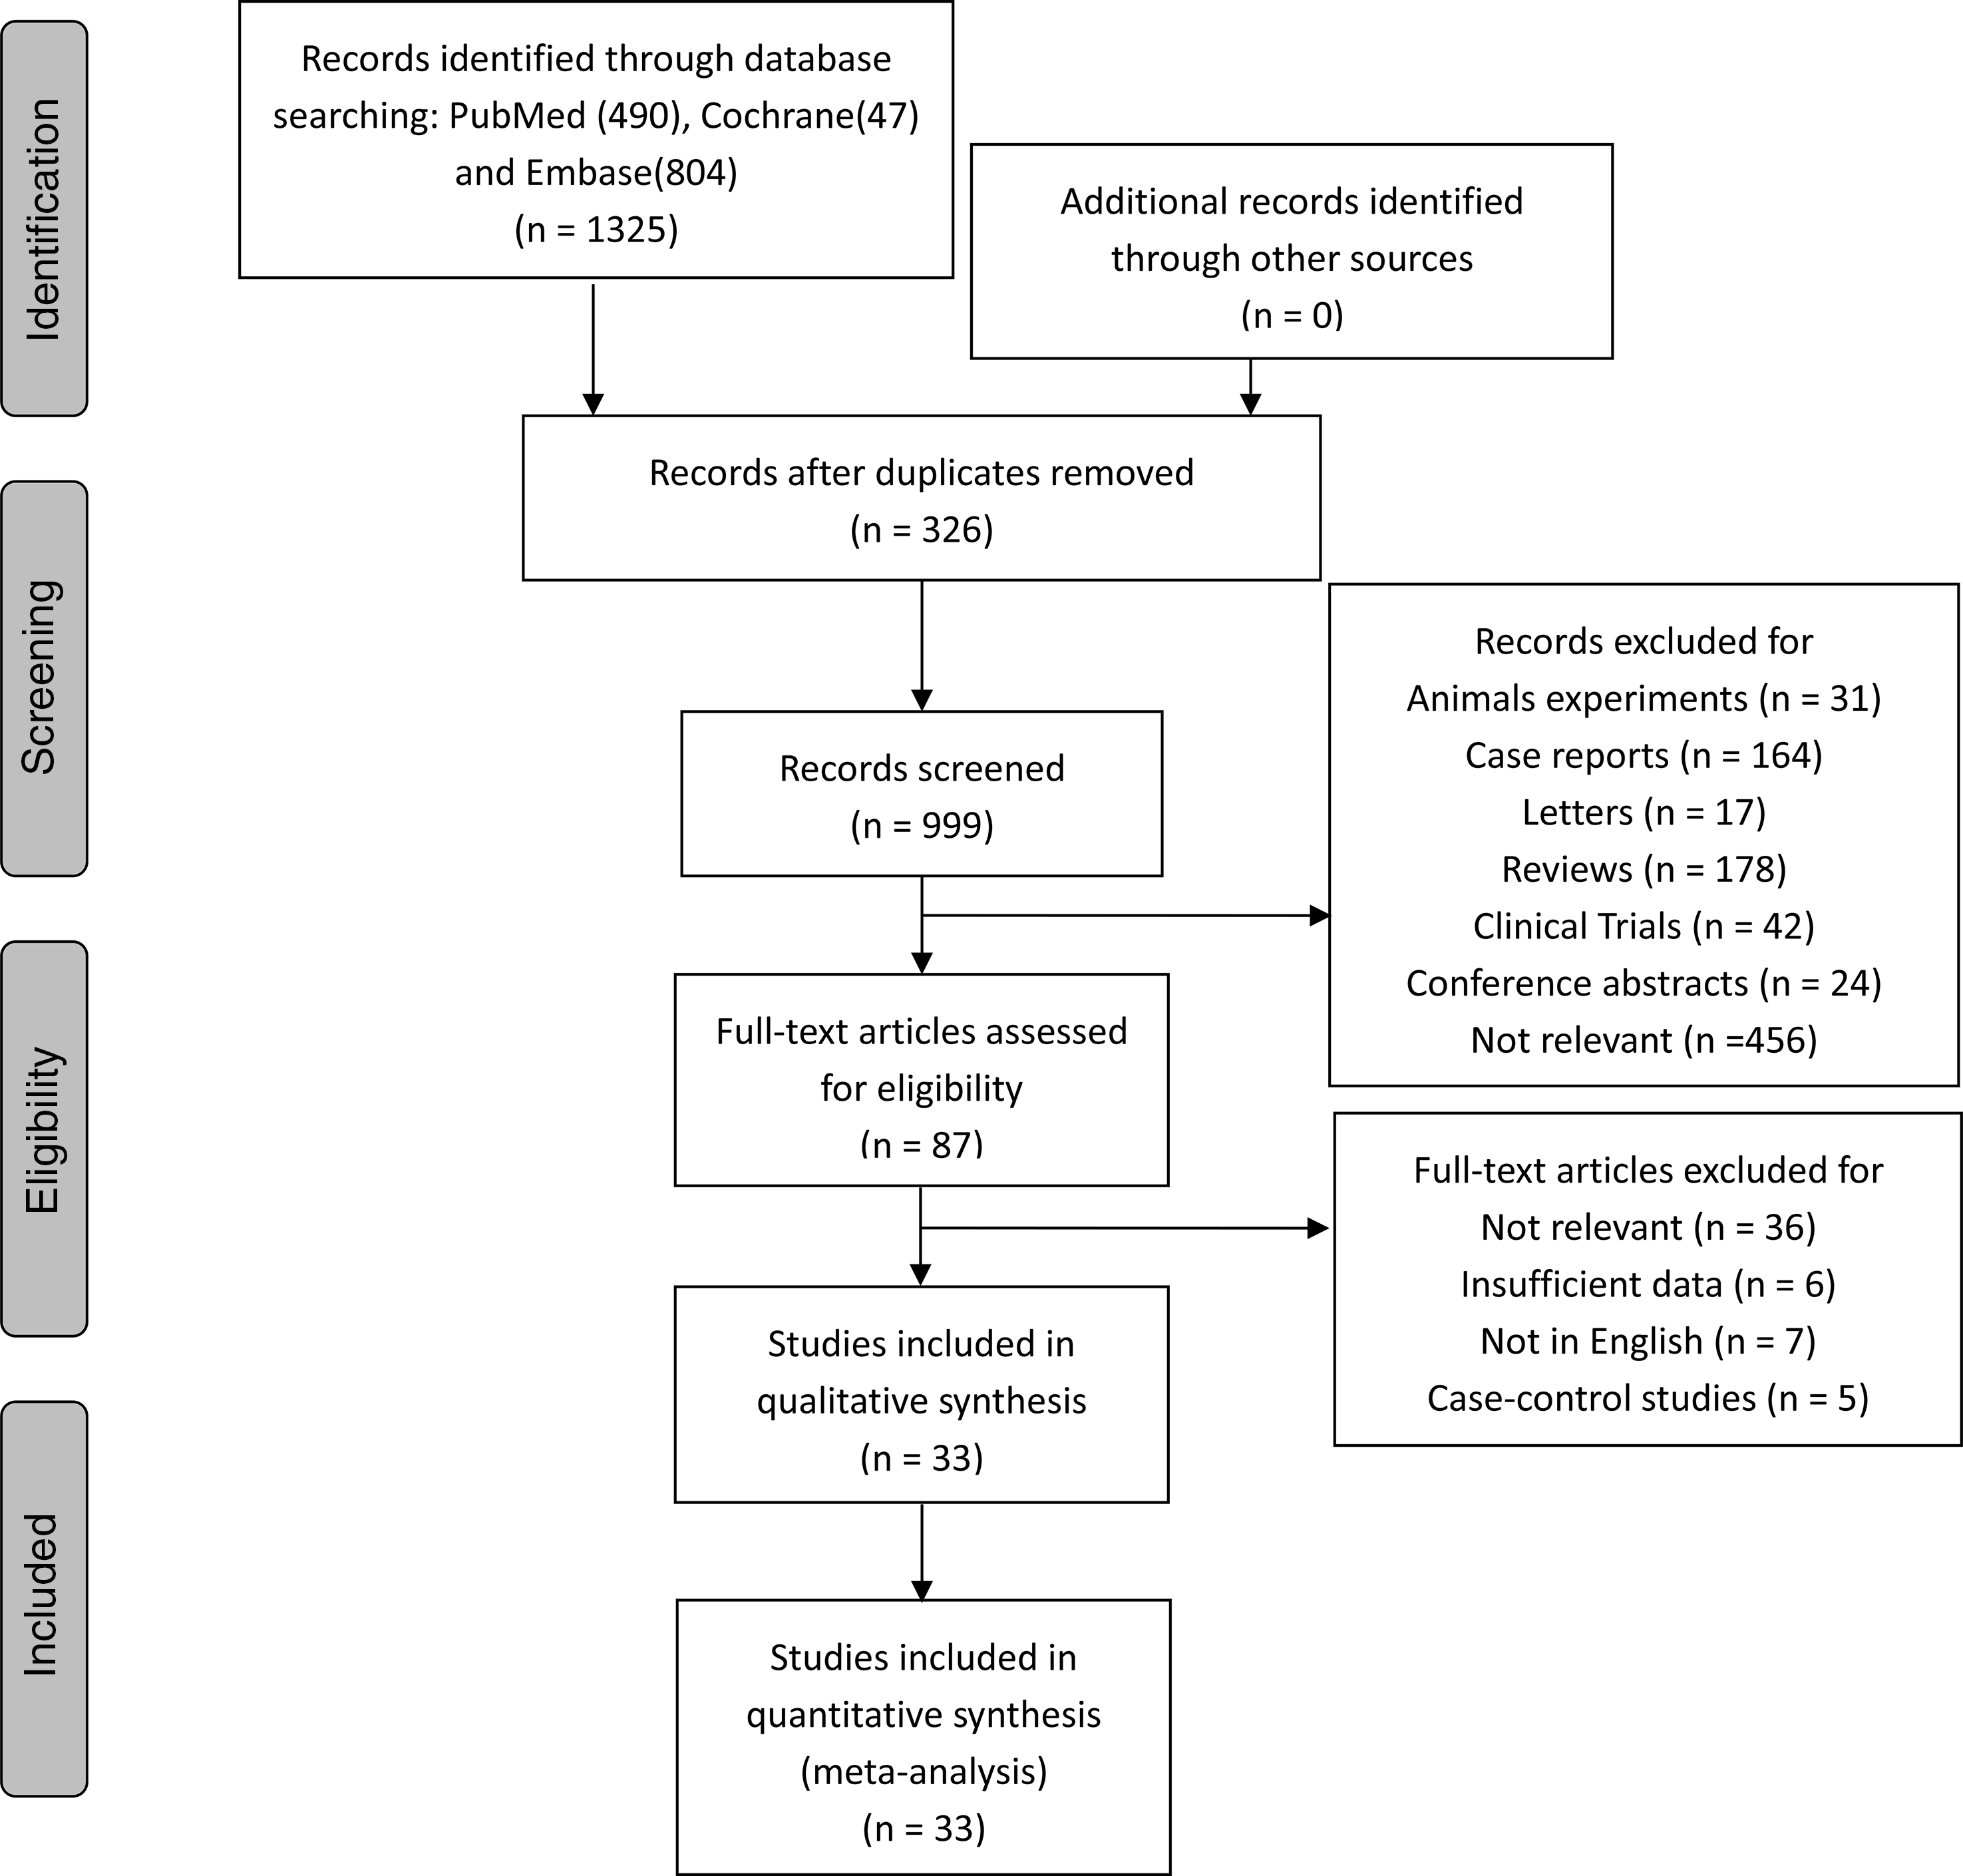
Fig. 1. Flow chart showing the systematic literature search and review.
Study characteristics
Study characteristics of the thirty-three studies are summarised in Table 1. The studies were published between 1989 and 2020. They were performed in different countries, with twenty-two in the USA(Reference Preble, Zhang and Kopp19,Reference Lan, Park and Colditz20,Reference Mills, Beeson and Phillips27-Reference Le Marchand, Kolonel and Wilkens31,Reference Chan, Stampfer and Ma35-Reference Rodriguez, McCullough and Mondul38,Reference Tseng, Breslow and Graubard40-Reference Ahn, Albanes and Peters44,Reference Neuhouser, Barnett and Kristal47-Reference Rohrmann, Platz and Kavanaugh49,Reference Park, Leitzmann and Subar53-Reference Park, Mitrou and Kipnis56) , two in the UK(Reference Papadimitriou, Muller and van den Brandt22,Reference Van Der Pols, Bain and Gunnell50) , two in Finland(Reference Chan, Pietinen and Virtanen34,Reference Mitrou, Albanes and Weinstein46) , one in Norway(Reference Veierød, Laake and Thelle32), one in Sweden(Reference Nilsson, Winkvist and Esberg21), one in the Netherlands(Reference Schuurman, van den Brandt and Dorant33), one in France(Reference Kesse, Bertrais and Astorg45), one in multiple countries of Europe(Reference Allen, Key and Appleby51) and two in Japan(Reference Allen, Sauvaget and Roddam39,Reference Kurahashi, Inoue and Iwasaki52) . Of the thirty-three studies, 177 206 cases were found in 4 212 923 participants. Thirteen studies had a follow-up duration of 10 years or more while twelve studies followed up for less than 10 years. All of the studies were prospective cohorts that met the inclusion criteria. After evaluation of study quality(Reference Stang23), all of the included studies were classified either as high or as moderate quality, with a total of fifteen high quality studies(Reference Preble, Zhang and Kopp19,Reference Lan, Park and Colditz20,Reference Le Marchand, Kolonel and Wilkens31,Reference Schuurman, van den Brandt and Dorant33,Reference Chan, Pietinen and Virtanen34,Reference Michaud, Augustsson and Rimm36,Reference Rodriguez, McCullough and Mondul38-Reference Tseng, Breslow and Graubard40,Reference Kesse, Bertrais and Astorg45-Reference Neuhouser, Barnett and Kristal47,Reference Van Der Pols, Bain and Gunnell50,Reference Park, Leitzmann and Subar53,Reference Park, Mitrou and Kipnis56) and a further eighteen moderate quality studies(Reference Nilsson, Winkvist and Esberg21,Reference Papadimitriou, Muller and van den Brandt22,Reference Mills, Beeson and Phillips27-Reference Hsing, McLaughlin and Schuman30,Reference Veierød, Laake and Thelle32,Reference Chan, Stampfer and Ma35,Reference Berndt, Carter and Landis37,Reference Giovannucci, Liu and Stampfer41-Reference Ahn, Albanes and Peters44,Reference Park, Murphy and Wilkens48,Reference Rohrmann, Platz and Kavanaugh49,Reference Allen, Key and Appleby51,Reference Kurahashi, Inoue and Iwasaki52,Reference Song, Chavarro and Cao54) identified.
Table 1. Characteristics of studies included in this meta-analysis
(Risk ratios and 95 % confidence intervals)
PC, prostate cancer; RR, relative risk; NOS, Newcastle–Ottawa scale; ALA, α-linolenic acid; PSA, prostate-specific antigen.
Total dairy products
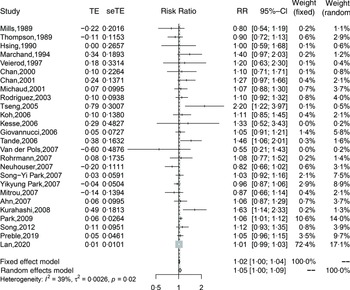
Twenty-six cohort studies(Reference Preble, Zhang and Kopp19,Reference Lan, Park and Colditz20,Reference Mills, Beeson and Phillips27,Reference Thompson, Garland and Barrett-Connor29-Reference Veierød, Laake and Thelle32,Reference Chan, Pietinen and Virtanen34-Reference Michaud, Augustsson and Rimm36,Reference Rodriguez, McCullough and Mondul38,Reference Tseng, Breslow and Graubard40-Reference Van Der Pols, Bain and Gunnell50,Reference Kurahashi, Inoue and Iwasaki52-Reference Song, Chavarro and Cao54,Reference Park, Mitrou and Kipnis56) investigated total dairy product consumption and prostate cancer incidence and included 110 982 cases in 1 536 556 participants. The summary adjusted RR for highest compared with lowest intake was 1·05 (95 % CI 1·00, 1·09), with moderate heterogeneity (I 2 = 39 %, P-heterogeneity = 0·02). The forest plot and funnel plot are presented in Fig. 2 and 3, respectively. There was no indication of publication bias (Egger’s test: P = 0·09 and Begg’s test: P = 0·63). In the dose–response analysis, an increase in total dairy intake by 400 g/d was positively associated with the risk of prostate cancer (RR: 1·02; 95 % CI 1·00, 1·03). When total dairy intake was over 500 g/d, the results were insignificant. There was evidence of a nonlinear association between total dairy product intake and prostate cancer risk (P-nonlinearity = 0·03; n 20). The risk of prostate cancer increased by 2 % with increasing the intake of total dairy ≤400 g/d (Fig. 4(a)).

Fig. 2. Forest plot for total dairy products consumption associated with risk of prostate cancer. RR, relative risk.
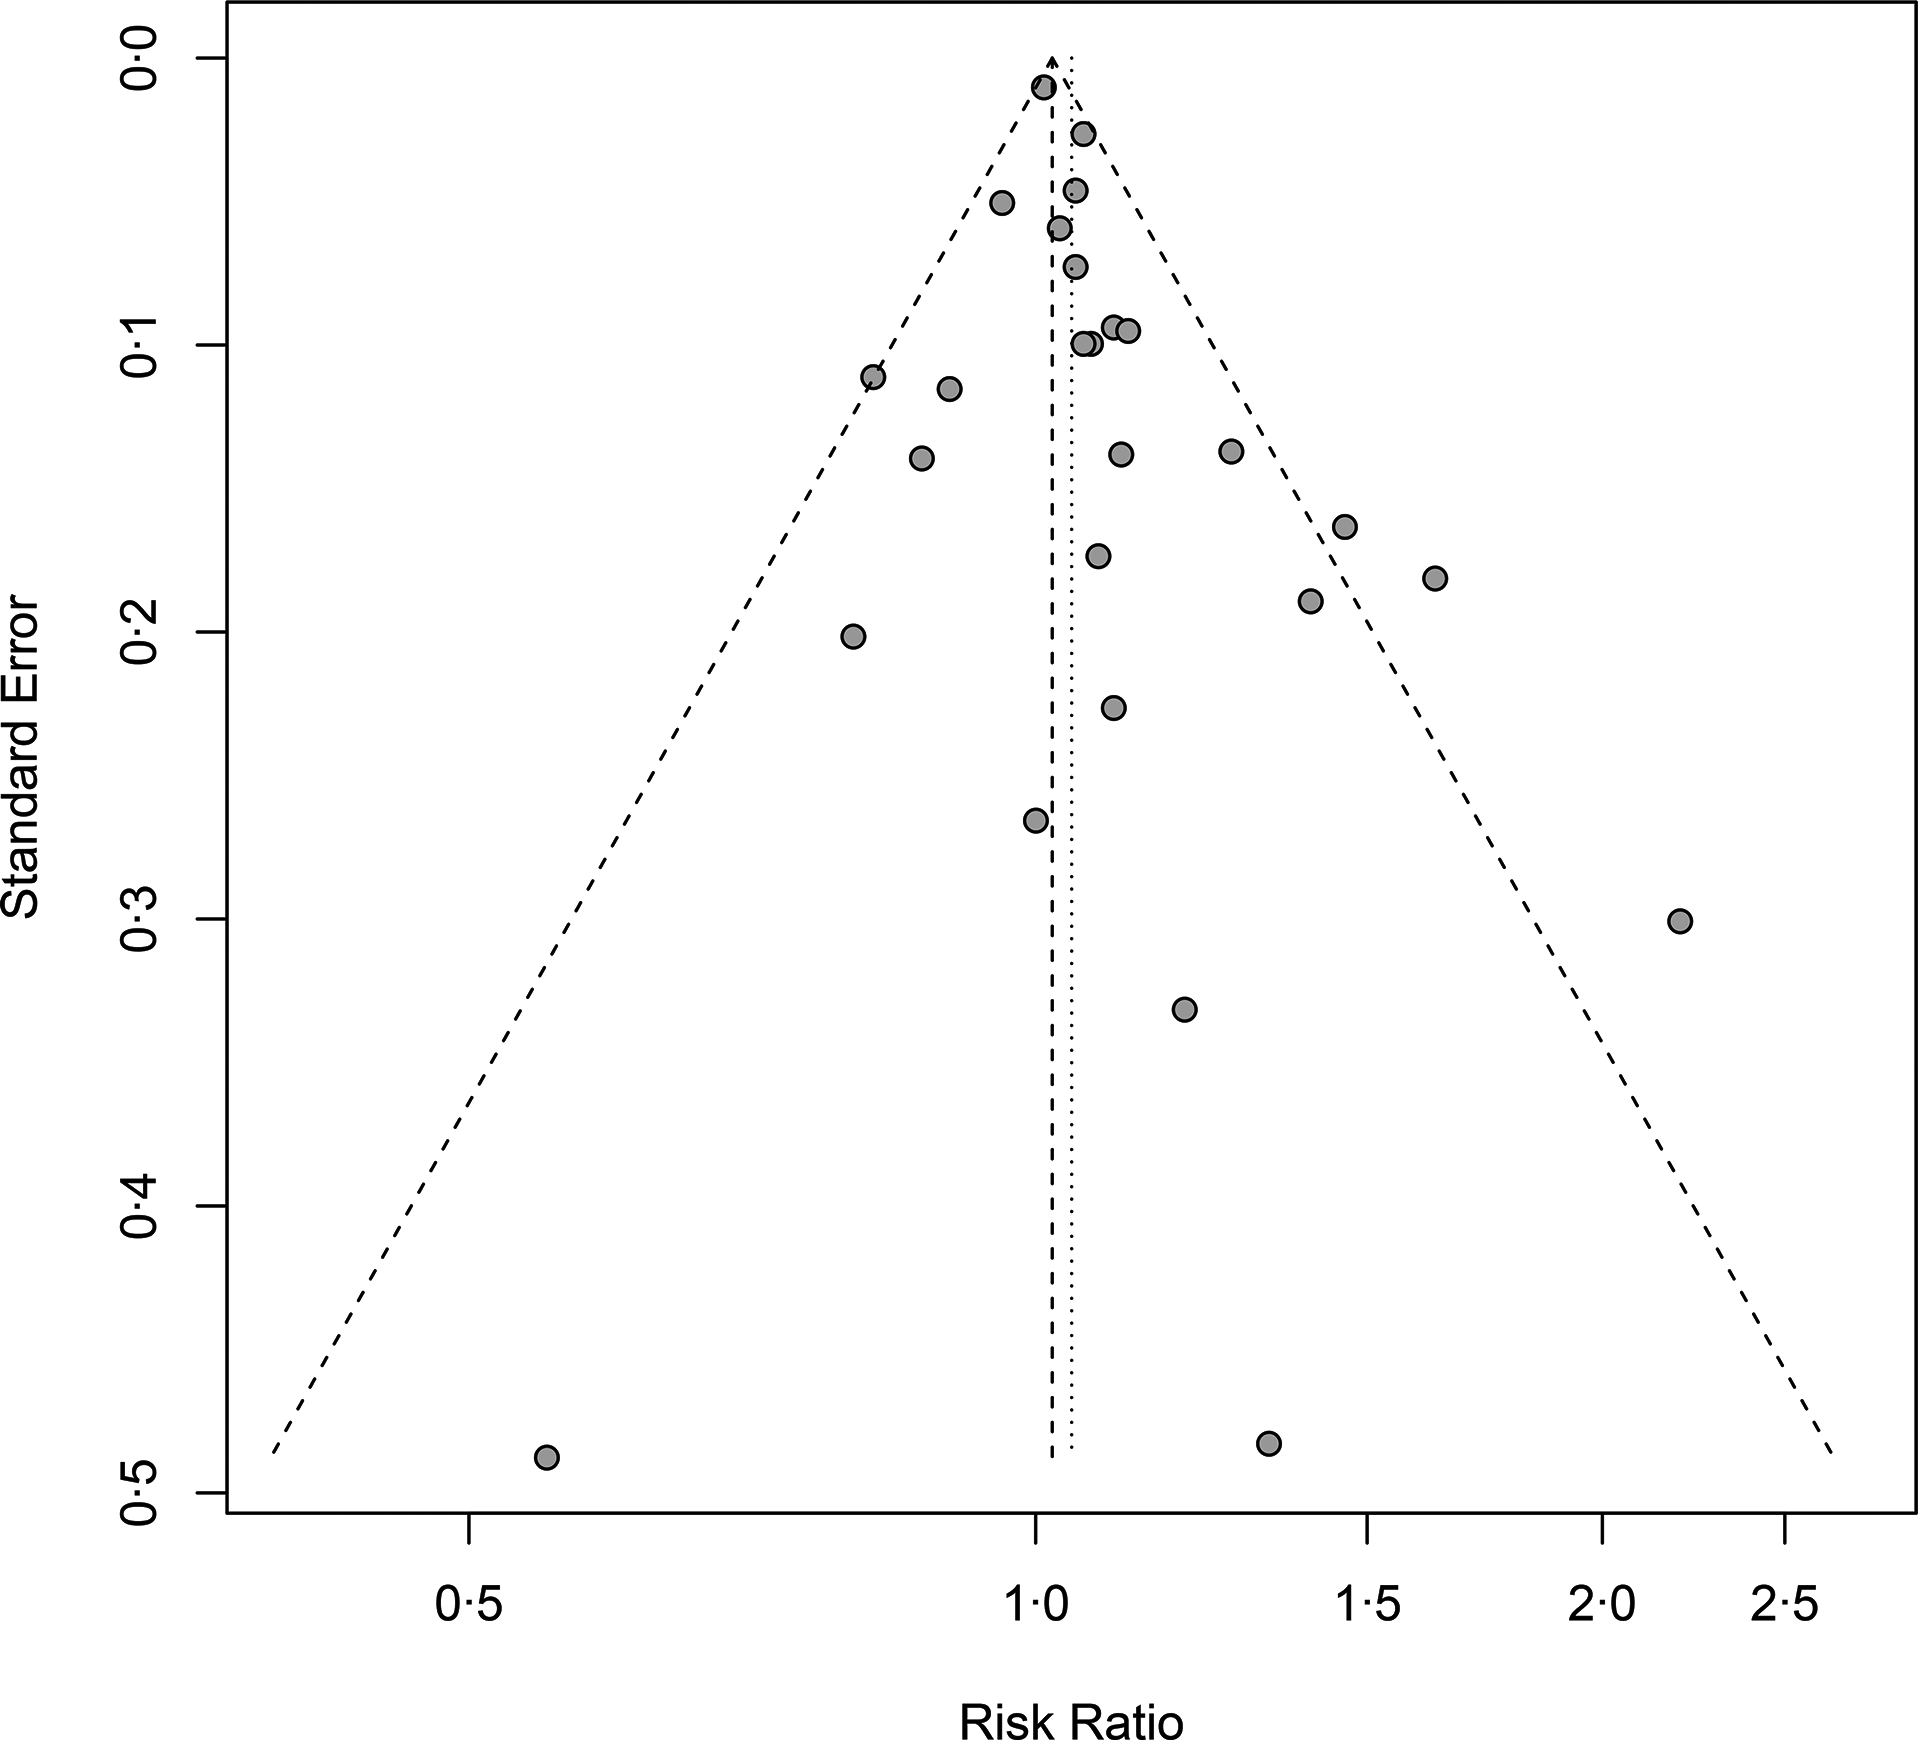
Fig. 3. Funnel plot for total dairy products consumption associated with risk of prostate cancer. RR, relative risk.
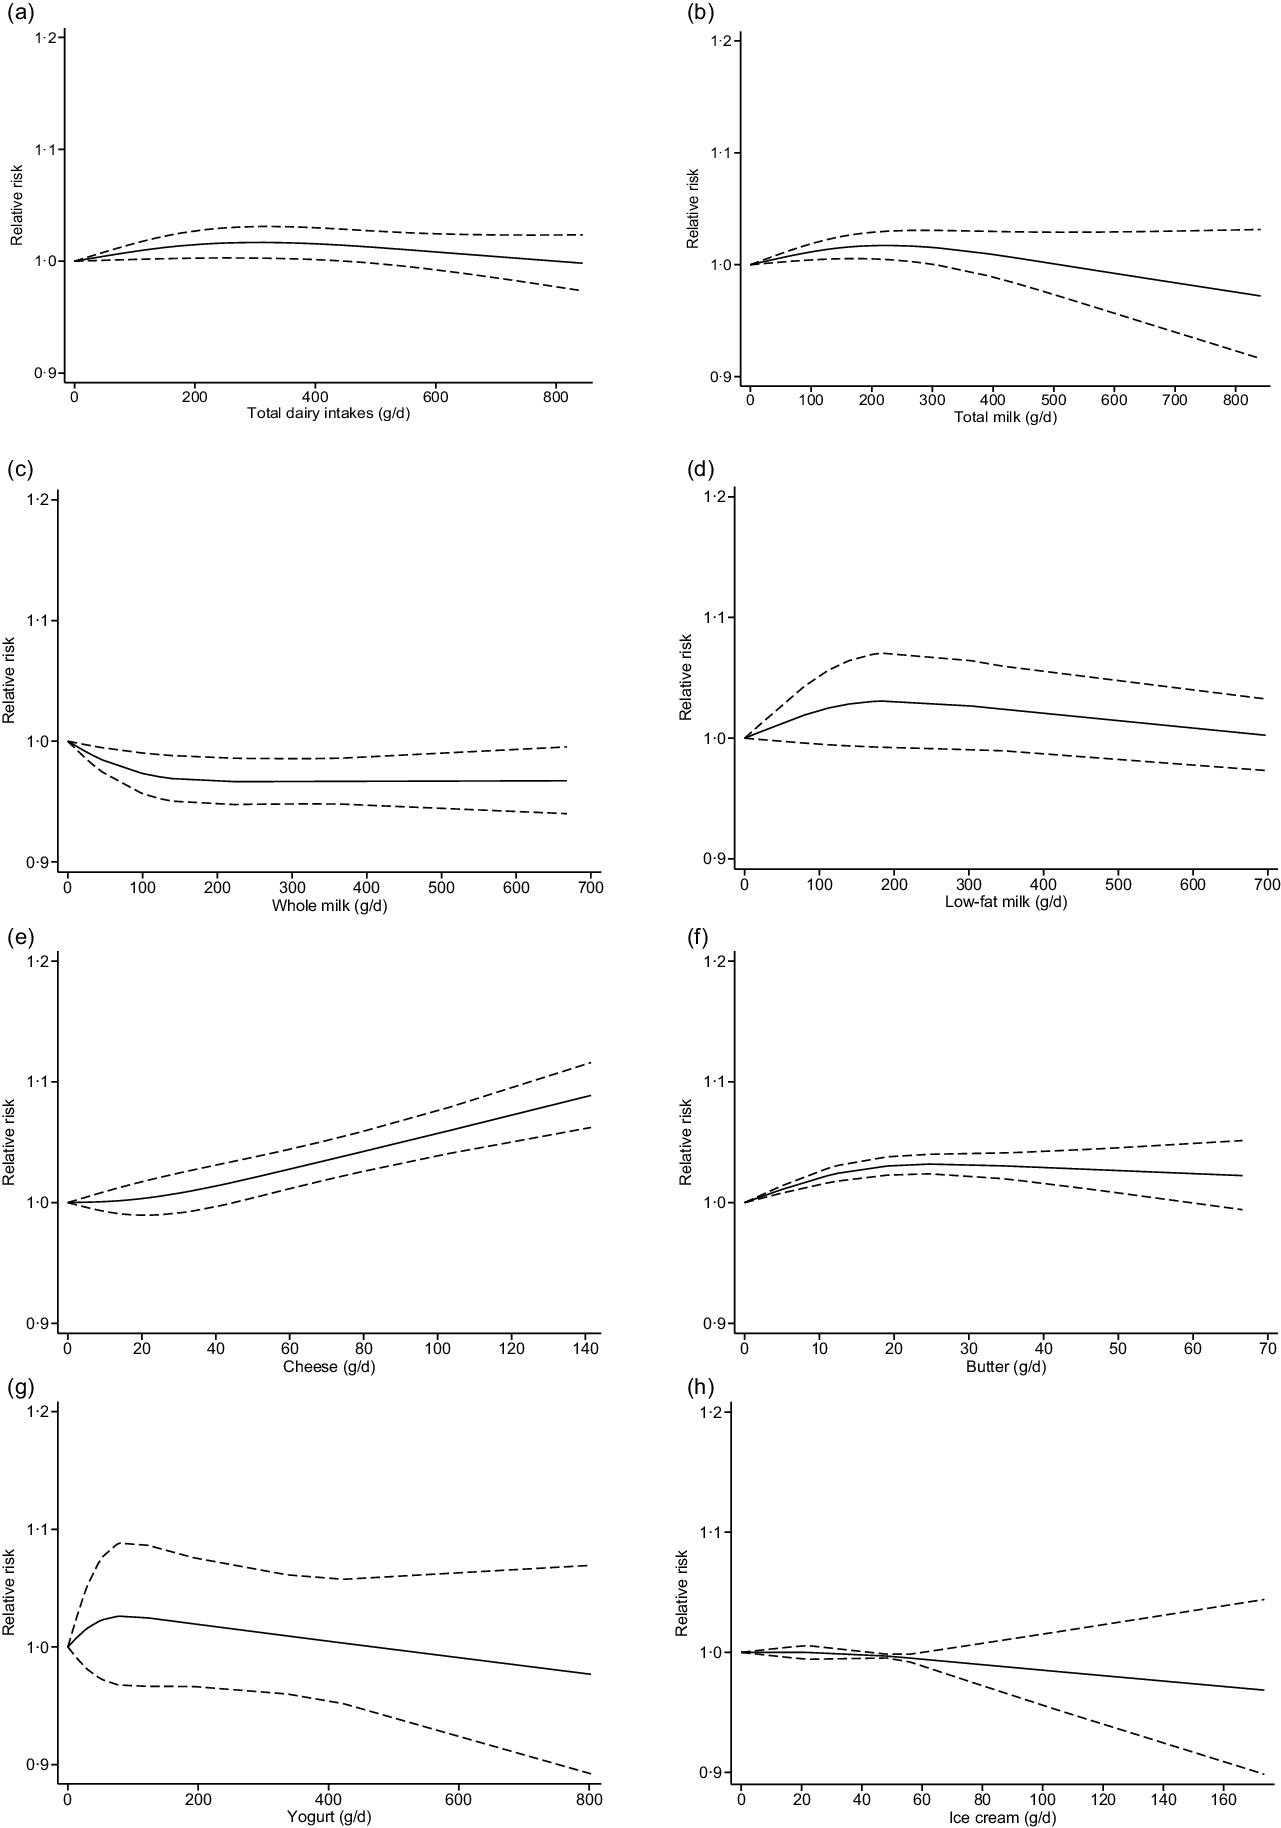
Fig. 4. Nonlinear dose–response relation between daily intakes of total dairy products (a) (P-nonlinearity = 0·03; n 20 studies), total milk (b) (P-nonlinearity < 0·01; n 16 studies), whole milk (c) (P-nonlinearity = 0·04; n 7 studies), skim/low-fat milk (d) (P-nonlinearity = 0·20; n 4 studies), cheese (e) (P-nonlinearity = 0·47; n 15 studies), butter (f) (P-nonlinearity = 0·01; n 4 studies), yogurt (g) (P-nonlinearity = 0·40; n 5 studies) and ice cream (h) (P-nonlinearity = 0·75; n 4 studies) and the risk of prostate cancer.
Total milk
Seventeen studies(Reference Preble, Zhang and Kopp19,Reference Lan, Park and Colditz20,Reference Severson, Nomura and Grove28,Reference Le Marchand, Kolonel and Wilkens31-Reference Schuurman, van den Brandt and Dorant33,Reference Berndt, Carter and Landis37,Reference Allen, Sauvaget and Roddam39,Reference Tseng, Breslow and Graubard40,Reference Tande, Platz and Folsom43,Reference Kesse, Bertrais and Astorg45,Reference Mitrou, Albanes and Weinstein46,Reference Park, Murphy and Wilkens48-Reference Kurahashi, Inoue and Iwasaki52) including 32 690 cases were included in the highest compared with lowest intake category meta-analysis (range of intake: 0–840 g/d). In this analysis, we observed a positive association between the risk of prostate cancer and total milk intake (RR: 1·07; 95 % CI 1·00, 1·14; I 2 = 46 %; P-heterogeneity = 0·02) (online Supplementary Fig. 1). Similarly, an increase in total milk intake by 200 g/d was associated with the risk of prostate cancer (RR: 1·02; 95 % CI 1·01, 1·03). When total milk intake was over 400 g/d, the results were insignificant. There was evidence of a nonlinear association between total milk intake and prostate cancer risk (P-nonlinearity < 0·01; n 16). The risk of prostate cancer increased by 2 % with increasing the intake of total dairy ≤300 g/d (Fig. 4(b)).
Whole milk
Seven studies(Reference Preble, Zhang and Kopp19,Reference Mills, Beeson and Phillips27,Reference Thompson, Garland and Barrett-Connor29,Reference Tseng, Breslow and Graubard40,Reference Park, Murphy and Wilkens48,Reference Song, Chavarro and Cao54,Reference Park, Mitrou and Kipnis56) with 12 929 prostate cancer cases were included in the meta-analysis comparing extreme intake categories (range of intake: 0–668 g/d). An inverse association between the risk of prostate cancer and whole milk intake was observed (RR: 0·93; 95 % CI 0·87, 0·99; I 2 = 0 %; P-heterogeneity = 0·79) when comparing extreme categories (online Supplementary Fig. 2). In the dose–response analysis, an increase in whole milk intake by 100 g/d was inversely associated with the risk of prostate cancer (RR: 0·97; 95 % CI 0·96, 0·99). There was evidence of a nonlinear association between whole milk intake and prostate cancer risk (P-nonlinearity = 0·04; n 7). The risk of prostate cancer decreased by 3 % with increasing the intake of whole milk ≤700 g/d (Fig. 4(c)).
Skim/low-fat milk
Four studies(Reference Preble, Zhang and Kopp19,Reference Veierød, Laake and Thelle32,Reference Song, Chavarro and Cao54,Reference Park, Mitrou and Kipnis56) with 12 534 prostate cancer cases were included in the meta-analysis comparing extreme intake categories (range of intake: 0–697 g/d). Comparing categories of highest and lowest intake of skim/low-fat milk, we observed no association with the risk of prostate cancer (RR: 1·10; 95 % CI 0·96, 1·26; I 2 = 79 %; P-heterogeneity < 0·01) (online Supplementary Fig. 3). In the dose–response analysis, an increase in skim/low-fat milk intake by 80 g/d was associated with the risk of prostate cancer (RR: 1·02; 95 % CI 1·00, 1·04). The results were insignificant when skim/low-fat milk intake was over 100 g/d. No evidence of a nonlinear dose–response association between skim/low-fat milk and the risk of prostate cancer was detected (P-nonlinearity = 0·20; n 4). The risk of prostate cancer increased by 2 % with increasing the intake of skim/low-fat milk ≤80 g/d. No additional risk increasing association is apparent above this value (Fig. 4(d)).
Cheese
Fifteen studies(Reference Lan, Park and Colditz20,Reference Nilsson, Winkvist and Esberg21,Reference Severson, Nomura and Grove28,Reference Schuurman, van den Brandt and Dorant33,Reference Berndt, Carter and Landis37,Reference Allen, Sauvaget and Roddam39,Reference Tseng, Breslow and Graubard40,Reference Kesse, Bertrais and Astorg45,Reference Mitrou, Albanes and Weinstein46,Reference Park, Murphy and Wilkens48,Reference Rohrmann, Platz and Kavanaugh49,Reference Allen, Key and Appleby51,Reference Kurahashi, Inoue and Iwasaki52,Reference Song, Chavarro and Cao54,Reference Park, Mitrou and Kipnis56) with 33 236 prostate cancer cases were included in the meta-analysis comparing extreme intake categories (range of intake: 0–140 g/d). No significant association was observed between the prostate cancer risk and cheese intake (RR: 1·03; 95 % CI 0·99, 1·08; I 2 = 0 %; P-heterogeneity = 0·49) (online Supplementary Fig. 4). An increase in cheese intake by 40 g/d was associated with the risk of prostate cancer (RR: 1·01; 95 % CI 1·00, 1·03). No evidence of a nonlinear dose–response association between cheese and the risk of prostate cancer was found (P-nonlinearity = 0·47; n 15). The risk of prostate cancer increased by 9 % with increasing the intake of cheese ≤ 140 g/d (Fig. 4(e)).
Butter
Five studies(Reference Nilsson, Winkvist and Esberg21,Reference Papadimitriou, Muller and van den Brandt22,Reference Severson, Nomura and Grove28,Reference Allen, Sauvaget and Roddam39,Reference Mitrou, Albanes and Weinstein46) with 2943 prostate cancer cases were included in the highest compared with the lowest intake category meta-analysis (range of intake: 0–67 g/d). A positive association between the prostate cancer risk and butter intake was observed (RR: 1·08; 95 % CI 1·03, 1·12; I 2 = 0 %; P-heterogeneity = 0·42) (online Supplementary Fig. 5). An increase in butter intake by 50 g/d was associated with the risk of prostate cancer (RR: 1·03; 95 % CI 1·01, 1·05). There was evidence of a nonlinear dose–response association between butter and the risk of prostate cancer (P-nonlinearity = 0·01; n 4). The risk of prostate cancer increased by 3 % with increasing the intake of cheese ≤ 50 g/d (Fig. 4(f)).
Yogurt
Seven studies(Reference Berndt, Carter and Landis37,Reference Tseng, Breslow and Graubard40,Reference Kesse, Bertrais and Astorg45,Reference Park, Murphy and Wilkens48,Reference Allen, Key and Appleby51,Reference Kurahashi, Inoue and Iwasaki52,Reference Park, Mitrou and Kipnis56) with 8802 incident cases were included in the meta-analysis comparing highest and lowest intake of yogurt (range of intake: 0–802 g/d). No significant association was detected with the risk of prostate cancer (RR: 1·14; 95 % CI 0·98, 1·32; I 2 = 65 %; P-heterogeneity < 0·01) (online Supplementary Fig. 6). Similarly, in the dose–response analysis, an increase in yogurt intake by 100 g/d was not associated with the risk of prostate cancer (RR: 1·03; 95 % CI 0·97, 1·09). No evidence of a nonlinear dose–response association between yogurt and the risk of prostate cancer was observed (P-nonlinearity = 0·40; n 5) (Fig. 4(g)).
Ice cream
Five studies(Reference Lan, Park and Colditz20,Reference Severson, Nomura and Grove28,Reference Tseng, Breslow and Graubard40,Reference Mitrou, Albanes and Weinstein46,Reference Song, Chavarro and Cao54) with 5268 incident cases were included in the meta-analysis comparing highest and lowest intake of ice cream (range of intake: 0–173 g/d). The association was insignificant between the ice cream intake and the risk of prostate cancer (RR: 0·94; 95 % CI 0·87, 1·01; I 2 = 0 %; P-heterogeneity = 0·52) (online Supplementary Fig. 7). In the dose–response analysis, an increase in ice cream intake by 100 g/d was not associated with the risk of prostate cancer (RR: 0·99; 95 % CI 0·97, 1·01). There was no evidence of a nonlinear dose–response association between ice cream and the risk of prostate cancer (P-nonlinearity = 0·75; n 4) (Fig. 4(h)).
Cream
Two studies(Reference Tseng, Breslow and Graubard40,Reference Mitrou, Albanes and Weinstein46) with 1398 incident cases were included in the meta-analysis. Cream intake was not associated significantly with prostate cancer (RR: 1·07; 95 % CI 0·91, 1·26; I 2 = 0 %; P-heterogeneity = 0·33) (online Supplementary Fig. 8). More studies are needed to evaluate the potential relationship between cream consumption and prostate cancer.
Subgroup analyses
The results of the subgroup analyses are shown in Table 2. For the subgroups stratified by prostate cancer type, follow-up years, treatment era, collection times, adjustment for confounders and geographic location, we only included studies that provided total dairy intake data. As only a few studies provided unadjusted RR, all of the results were summarised using adjusted RR. In the subgroup analysis stratified by years of follow-up, we included twenty-five studies that provided the data of total dairy intake. The pooled RR were 1·03 (95 % CI 0·97, 1·09) in group with a follow-up duration more than 10 years and 1·06 (95 % CI 0·99, 1·14) in group with a follow-up duration less than 10 years. In the subgroup analysis stratified by prostate cancer type, the pooled RR were 0·98 (95 % CI 0·94, 1·03) in the advanced group, 1·10 (95 % CI 0·98, 1·24) in the non-advanced group and 0·92 (95 % CI 0·84, 1·00) in the fatal group (Fig. 5). Based on geographic location, the association was not statistically significant in Europe (RR: 0·95; 95 % CI 0·77, 1·16), whereas it remained significant in the USA (RR: 1·04; 95 % CI 1·00, 1·08) and Asia (RR: 1·63; 95 % CI 1·14, 2·32). The impact of measurement times on the final results was investigated by stratifying analyses according to collection times of dietary information, and significant association only limited in one-time measurement (RR: 1·04; 95 % CI 1·00, 1·08). Men were categorised into two groups stratified by the treatment era: the pre-PSA screening era (before 1991) and the PSA screening era (after 1991).The eras were defined because PSA was initially reported as a first-line screening test for prostate cancer in 1991 and was not routinely used as an aid for early detection before that time(Reference Catalona, Smith and Ratliff57). Three studies conducted in pre-PSA era showed insignificant results (RR: 0·89; 95 % CI 0·74, 1·07) while the results remained significant in the studies conducted in PSA era (RR: 1·05; 95 % CI 1·01, 1·10). In the analyses stratified by adjustment for different confounders, the significant results did not persist in the studies that adjusted for Ca and vitamin D, energy intake, history of diabetes and PSA test.
Table 2. Results of subgroup analyses
(Risk ratios and 95 % confidence intervals)
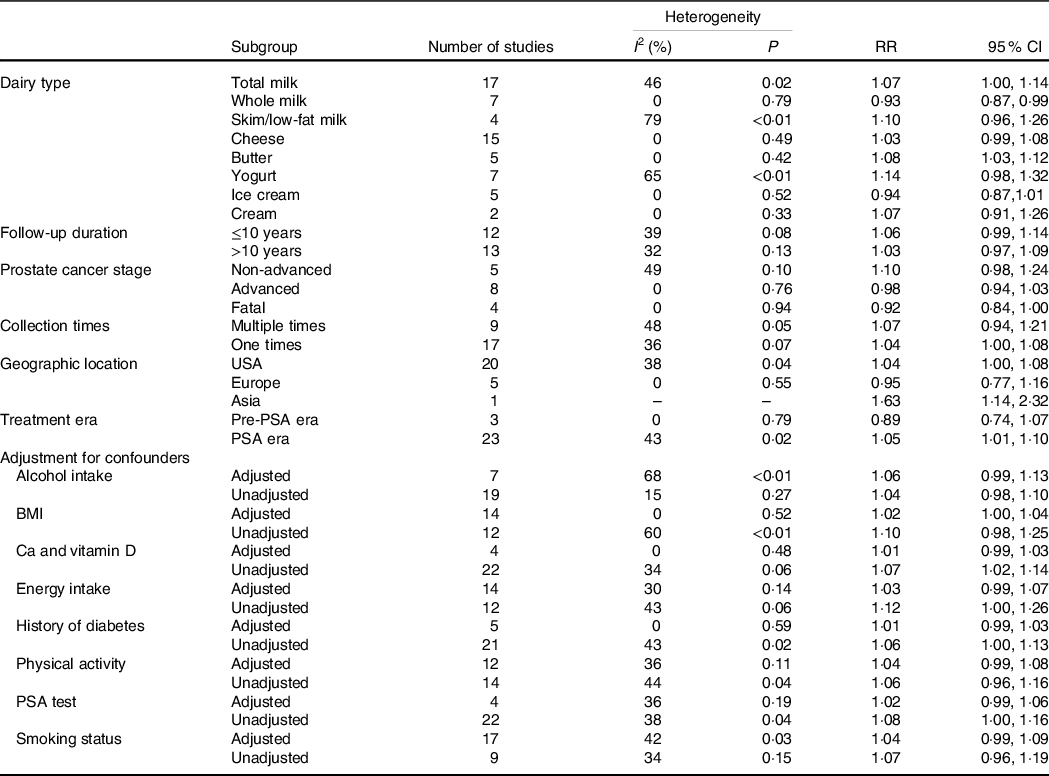
RR, risk ratio; PSA, prostate-specific antigen.
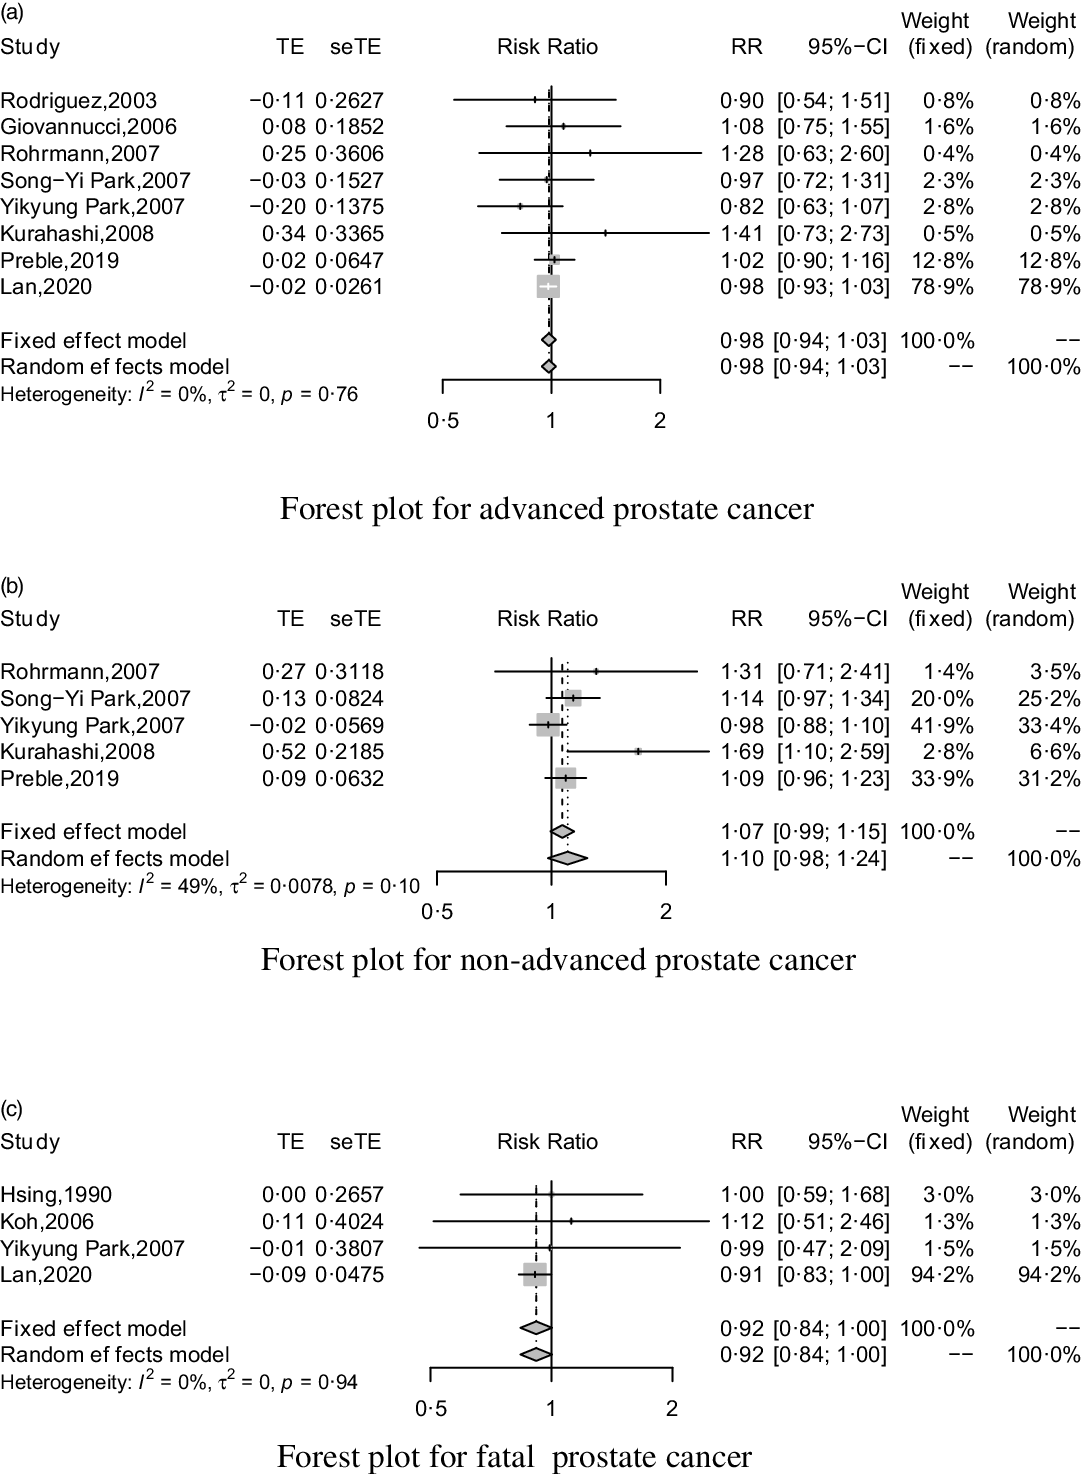
Fig. 5. Forest plot for total dairy products consumption associated with risk of prostate cancer stratified by subtypes. (a) Forest plot for total dairy products consumption associated with risk of advanced prostate cancer. (b) Forest plot for total dairy products consumption associated with risk of non-advanced prostate cancer. (c) Forest plot for total dairy products consumption associated with risk of fatal prostate cancer. RR, relative risk.
Discussion
In our study, we pooled data from thirty-three cohort studies to update the evidence of the relationship between the consumption of dairy products and the risk of prostate cancer. Our study showed an increased risk of prostate cancer with high intakes of total dairy products, milk, cheese and butter. An inverse association was found with whole milk. No relationship was observed between skim/low-fat milk, yogurt, ice cream, cream and prostate cancer risk. In the dose–response analysis, a positive association was present for total dairy, total milk, skim/low-fat milk, cheese and butter. On the other side, whole milk was associated with a lower risk of prostate cancer. We observed some evidence of nonlinearity between the intakes of total dairy, total milk, whole milk and butter with the risk of prostate cancer.
Several meta-analysis articles have explored this topic. Gao et al. (Reference Gao, LaValley and Tucker14) in 2005 included ten prospective studies and found men with the highest intake of dairy products were more likely to develop prostate cancer than men with the lowest intake, with pooled RR 1·11 (95 % CI 1·00, 1·22). In 2008, Huncharek et al.(Reference Huncharek, Muscat and Kupelnick16) pooled eleven cohort studies and found no evidence of an association between dairy or milk intake and risk of prostate cancer, with RR for the highest intake category v. the lowest intake category 1·06 (95 % CI 0·92, 1·22) and 1·06 (95 % CI 0·91, 1·23), respectively. In 2015, Aune et al.(Reference Aune, Navarro Rosenblatt and Chan17) included thirty-two cohort studies in the analysis of dairy product and Ca intake and prostate cancer risk. Comparing the highest with the lowest intakes, the summary RR for total dairy products consumption and prostate cancer risk was 1·09 (95 % CI 1·02, 1·17). In the dose–response analysis, a significant 7 % increase in prostate cancer risk for every 400 g of total dairy products consumed/d was observed. Compared with the previous study, we included a large number of studies with thirty-three in total and carried out more thorough analyses. In addition to the previous findings, we found that butter was also associated with higher prostate cancer risk. In 2018, the World Cancer Research Fund/American Institute for Cancer Research have reported that there is not sufficient evidence to recommend reducing milk and dairy consumption to reduce the risk of cancer(18). Although we found that higher dairy consumption increased prostate cancer risk, the RR for highest compared with lowest intakes was reduced from 9 % to 5 %, which is closer to the actual effect size. In the dose–response analysis, the result became insignificant when total dairy intake was over 500 g/d. This reduction indicates that with more evidence available, the association between dairy product consumption and prostate cancer risk is smaller and better defined.
Several mechanisms may help explain the relationship between dairy product intakes and the increased risk of prostate cancer. Many observational and experimental studies have reported that higher intakes of milk and dairy products are associated with increased circulating concentrations of insulin-like growth factor 1 (IGF-1)(Reference Heaney, McCarron and Dawson-Hughes58-Reference Gunnell, Oliver and Peters60). Qin et al.(Reference Qin, He and Xu61) found that the milk intervention significantly increased 13·8 ng/ml of circulating IGF-1 levels by conducting a meta-analysis of cross-sectional studies and randomised controlled trials. In the past years, several research articles have recognised that the IGF system plays an important role in prostate cancer biology(Reference Gennigens, Menetrier-Caux and Droz62). The IGF system regulates many important cellular processes that are crucial for normal prostate proliferation, differentiation and cellular metabolism(Reference Ryan, Haqq and Simko63). Additionally, IGF-1 also promotes proliferation and inhibits apoptosis in vitro in prostate cancer cells(Reference Cohen, Peehl and Lamson64). Several prospective studies have seen the correlation between IGF-1 and increased prostate cancer risk(Reference Key65,Reference Watts, Fensom and Smith Byrne66) . Results of a meta-analysis estimated that men with the highest IGF-1 levels might have an approximately 70 % increase in risk for prostate cancer(Reference Travis, Appleby and Martin67).
Our study found that the association between prostate cancer and dairy intakes differed by dairy food type. The potential mechanism was that different dairy products were associated with different concentrations of insulin-related/IGF-signalling and inflammatory biomarkers. A number of studies have reported associations between circulating inflammatory biomarkers and prostate cancer risk(Reference Stikbakke, Richardsen and Knutsen68-Reference Toriola, Laukkanen and Kurl70). Shi et al.(Reference Shi, Olivo-Marston and Jin71) assessed the associations between total dairy and individual dairy foods with circulating concentrations of insulin-related/IGF-signalling and inflammation-related biomarkers. They found that higher intakes of low-fat dairy and yogurt were associated with lower IGF-1 concentrations, while higher intakes of milk and butter were associated with higher IGF-1 concentrations. Similarly, our study presented that skim/low-fat milk and yogurt were not associated with prostate cancer risk, while total milk and butter were associated with increased prostate cancer risk. The study also showed that higher intake of full-fat dairy including whole milk was associated with lower concentrations of inflammatory biomarkers. This might explain the inverse relationship between whole milk intake and prostate cancer that we found.
A recent study(Reference Fu, Tabung and Pernar72) determined the association between hyperinsulinaemic dietary patterns, which included full-fat dairy as favourable component, and prostate cancer incidence and mortality. They found that in the multivariable-adjusted analyses, the hyperinsulinaemic diet was associated with advanced and fatal prostate cancer. Hyperinsulinaemia may promote tumour growth directly through insulin receptors or regulation of IGF and their binding proteins (IGFBP), which are involved in cell survival and proliferation. However, in our subgroup analysis stratified by prostate cancer type, we did not find positive association between dairy intakes and advanced or fatal prostate cancer. This finding needs additional study because only four studies were included in the subgroup of fatal prostate cancer.
Oestrogen may be another mechanism through which dairy intake may contribute to the aetiology of prostate cancer(Reference Malekinejad and Rezabakhsh73). Sixty to seventy percentage of animal-derived oestrogens in the human diet come from milk and dairy products(Reference Hartmann, Lacorn and Steinhart74). Moreover, modern genetically improved dairy cows continue to lactate throughout almost the entire pregnancy, leading to large amounts of oestrogens contained in commercial cow’s milk(Reference Maruyama, Oshima and Ohyama75). An ample body of evidence suggests that oestrogens may play a critical role in causing prostate cancer(Reference Barrett-Connor, Garland and McPhillips76-Reference Modugno, Weissfeld and Trump78). As estradiol-17β has been classified as a carcinogen by the International Agency for Research on Cancer, oestrogen contained in dairy products should be considered as a potential risk factor for prostate cancer(Reference Nelles, Hu and Prins79).
Finally, the intakes of dairy products focused on Ca may be associated with an increased risk of prostate cancer. Dairy products are Ca-rich foods. The Health Professional Follow-Up Study analysed the diet of 47 885 men and looked closely at the participants’ consumption of Ca. After a 24-year follow-up, 5861 cases of prostate cancer were identified and the result RR of 1·24 (95 % CI 1·02, 1·51) indicated that prostate cancer was associated with high Ca intake(Reference Wilson, Shui and Mucci80). Some scientists suggested that higher Ca intake may down-regulate the circulating vitamin D concentration, which plays an important role in inhibiting cellular proliferation and neoplastic cell differentiation(Reference Trump and Aragon-Ching81).
Our meta-analysis has three strengths. First, we included thirty-three studies in the main analyses and the ample number of articles allowed us to have adequate statistical power to detect significant relationships. Second, the studies included are all prospective cohorts, thus avoiding recall bias and reducing the risk of selection bias. Third, the robust error meta-regression method did not require the distribution of cases or person-years so more studies were available in the dose–response analysis.
We also acknowledge several potential limitations to the current study. First, the result may be confounded because dairy product intakes are associated with other risk factors such as PSA testing, energy intake, obesity, alcohol and smoking(Reference Giovannucci, Liu and Platz82-Reference Hiatt, Armstrong and Klatsky85). The association between total dairy consumption and prostate cancer became insignificant in the groups that adjusted for PSA test, Ca and vitamin D, history of diabetes and energy intake. Second, studies that adjusted for potential confounding were limited, thus having weaker statistical power. According to recent research studies, around 20–40 % of the prostate cancer cases in the USA and Europe could be due to overdiagnosis through extensive PSA testing(Reference Etzioni, Penson and Legler86). In the four studies that adjusted for PSA testing(Reference Preble, Zhang and Kopp19,Reference Lan, Park and Colditz20,Reference Park, Leitzmann and Subar53,Reference Park, Mitrou and Kipnis56) , the association became insignificant. Therefore, the positive relationship between dairy product intakes and prostate cancer incidence might simply have reflected more cancers being detected. Nonetheless, for most of the dairy product types, studies that adjusted for PSA testing are very few, making it difficult to draw a conclusion. PSA testing is much more common in the USA than in Europe(Reference Allen, Key and Appleby87), so the significant result of USA studies might be impacted by this. As only one study conducted in Asia provided total dairy data, it was hard to draw the conclusion that results differed by geographical location. In addition, people with higher intakes of whole milk or more hyperinsulinaemic diet might have a lower PSA screening rate(Reference Fu, Tabung and Pernar72), thus confounding by PSA screening should be considered a potential bias. Finally, some subgroups were investigated in a limited number of studies. For example, the cream group only included two studies. The non-advanced group and fatal group also lacked abundant data, with merely five and four studies included respectively.
Conclusions
In conclusion, we showed an increased risk of prostate cancer with consumption of total dairy products, milk, cheese and butter but an inverse association for whole milk and no association with skim/low-fat milk, yogurt, ice cream and cream. Additional studies need to further explore the association between dairy product consumption and different subtypes of prostate cancer.
Acknowledgements
The authors would like to thank Tuo Deng for assistance with manuscript revision. This research did not receive any specific grant from funding agencies in the public, commercial or not-for-profit sectors.
Z. Z.: Conceptualisation, Methodology, Formal analysis, Investigation, Data interpretation, Writing – original draft, Writing – review and editing ; D. W.: Methodology, Data interpretation; D. Z.: Methodology, Data interpretation and Data curation; S. G.: Formal analysis and Data curation; X. Z.: Data interpretation and Data curation; Y. Y.: Data interpretation and Data curation; Y. X.: Data interpretation and Data curation. All authors critically reviewed and approved the final manuscript.
There are no conflicts of interest.
Supplementary material
For supplementary material referred to in this article, please visit https://doi.org/10.1017/S0007114522002380