Depression is the leading global cause of disease burden and affects an estimated 300 million people worldwide(Reference Patel, Chisholm and Parikh1). Recently, the China Mental Health Survey which enrolled 32 552 participants between 2013 and 2015 showed that the weighted lifetime prevalence of mood disorders was 7·4 (95 % CI 7·1, 7·8) %(Reference Huang, Wang and Wang2). In China, where resources are scare and individuals with mental health disorders are often stigmatised, reallocation of social and health resources to address mental health disorders can be slow and difficult. A previous study demonstrated that 91·7 % of individuals with mood disorders in China had never received any type of professional help(Reference Phillips, Zhang and Shi3). Considering the related higher prevalence of co-morbid physical health conditions(Reference Segel-Karpas, Palgi and Shrira4), premature mortality rates(Reference Wei, Hou and Zhang5) and societal cost(Reference Ekman, Granstrom and Omerov6) associated with depression, it is important to identify modifiable risk factors and develop preventive strategies for depression, especially in China.
Dietary fibre (DF) is a NSP carbohydrate that usually includes cellulose, insoluble hemicelluloses and lignin(Reference Alba, Macnaughtan and Laws7). Increased DF intake has been associated with lower prevalence of CVD(Reference Soliman8), diabetes(Reference Weickert and Pfeiffer9), colorectal cancer(Reference Bradbury, Appleby and Key10) and liver cancer(Reference Bradbury, Appleby and Key10). Moreover, several studies have reported an inverse association between DF intake and depression prevalence(Reference Woo, Lynn and Lau11–Reference Xu, Li and Song18). However, most of these studies were conducted in high-income countries and territories (according to the classifications from the World Bank(19)), such as the USA(Reference Gangwisch, Hale and Garcia13,Reference Fang, Egleston and Gabriel16,Reference Xu, Li and Song18) , Korea(Reference Kim, Choi and Lee14), Japan(Reference Oishi, Doi and Kawakami12,Reference Miki, Eguchi and Kurotani15,Reference Gopinath, Flood and Burlutksy17) and Hong Kong Special Administration Region of China(Reference Woo, Lynn and Lau11). No study has explored this topic in the Chinese mainland, which is a middle-income country. Moreover, only two previous studies explored the different associations between total, soluble and insoluble DF intake and the prevalence of depressive symptoms(Reference Miki, Eguchi and Kurotani15,Reference Fang, Egleston and Gabriel16) . One study found that intakes of total, soluble and insoluble DF were associated with lower prevalence of depressive symptoms in 1977 Japanese adults after adjustments for age, sex and worksite, but not in fully adjusted models(Reference Miki, Eguchi and Kurotani15). Another study found no significant association between total and insoluble DF intake and the prevalence of depressive symptoms in 225 young American women (aged 24–29 years)(Reference Fang, Egleston and Gabriel16). Considering the relatively small sample sizes, the incomplete adjusted models and the specific study populations in some of these studies, the evidence of the associations between different types and sources of DF intake and the prevalence of depressive symptoms is limited.
We designed this large, cross-sectional study to explore the associations between different types and sources of DF intake and the prevalence of depressive symptoms in a general population in Tianjin, China.
Materials and methods
Participants
This cross-sectional study used data from the Tianjin Chronic Low-grade Systemic Inflammation and Health cohort study, which was a large prospective dynamic cohort study conducted in Tianjin, China(Reference Sun, Wu and Zhang20). The design and data collection of the Tianjin Chronic Low-grade Systemic Inflammation and Health have been previously described in detail(Reference Xia, Xiang and Gu21). The present study was approved by the Institutional Review Board of the Tianjin Medical University and has been performed in accordance with the ethical standards of the 1964 Declaration of Helsinki and its later amendments. All participants gave written informed consent prior to study inclusion.
Between 2013 and 2016, a total of 27 478 participants (mean age 41 years; range 18–91 years) who underwent health examinations and completed a questionnaire reporting personal information, depressive symptoms, dietary intake, lifestyles factors and health conditions were included. Considering that CVD or cancer could affect the associations between DF intake and depressive symptoms, we excluded participants who had a history of CVD (n 1164) or cancer (n 195). Moreover, we excluded participants with missing data (more than ten food items) on the FFQ (n 1406) or extreme values in total energy intake (≤ 1674 or ≥ 41 840 kJ/d) (n 228), or those with missing data on other variables (n 179). Finally, a total of 24 306 participants were included for analysis.
Assessment of dietary data
Dietary intake was assessed using a modified version of the FFQ which included 100 food items (the initial version of the FFQ included eighty-one food items(Reference Jia, Xia and Zhang22)) with specified serving sizes. In the present study, all participants had information on more than ninety food items. The FFQ includes seven categories (‘almost never’, ‘less than once a week’, ‘once a week’, ‘two to three times a week’, ‘four to six times a week’, ‘once a day’ and ‘two or more times a day’) for foods and eight categories (‘almost never’, ‘less than once a week’, ‘once a week’, ‘two to three times a week’, ‘four to six times a week’, ‘once a day’, ‘two or more times a day’ and ‘four or more times a day’) for beverages consumed in the last month. The reproducibility and validity of the questionnaire were assessed in a random sample of 150 participants from our cohort using data from repeated measurements of the FFQ approximately 3 months apart, and 4-d weighed food records. The Spearman’s rank correlation coefficient for energy intake between the two FFQ was 0·68 (P < 0·05). The correlation coefficients for food items (i.e. fruits, vegetables, fish, meat and beverages) between the two FFQ ranged from 0·62 to 0·79 (all P < 0·05). Meanwhile, the Spearman’s rank correlation coefficient for energy intake by weighed food records and the FFQ was 0·49 (P < 0·05). Correlation coefficients for nutrients (i.e. vitamin C, vitamin E, PUFA, SFA, carbohydrate and Ca) using weighed food records and the FFQ ranged from 0·35 to 0·54 and 0·39 to 0·72 before and after adjustment of energy intake, respectively (all P < 0·05). The correlation coefficients for DF, insoluble DF and soluble DF using weighed food records and the FFQ were 0·44, 0·49 and 0·42 before adjustment of energy intake and 0·57, 0·63 and 0·53 after adjustment of energy intake, respectively.
Mean daily intake of nutrients, including DF, was calculated using an ad hoc computer programme developed to analyse the FFQ. Consumption of food items was calculated by multiplying fitted portion sizes (according to sex, g/time) by the frequency at which each food item was consumed per d. Furthermore, the Chinese food composition tables(Reference Yang, Wang and Pan23) were used as the nutrient database to calculate the nutrient intake (including total, insoluble and soluble DF). Nutrient intake was calculated by first multiplying grams consumed for each food item by its nutrient content per gram, then adding the nutrient contributions across all food items. Factor analysis was applied to generate major dietary patterns and factor loadings for all 100 foods and beverages in grams. Varimax rotation was applied for greater interpretability. After evaluation of eigenvalues (>1) and the scree test, three factors were determined. Factors were named descriptively according to the food items showing high factor loadings (absolute value > 0·3), with respect to each dietary pattern as follows: vegetables pattern, sweet foods pattern and animal foods pattern. Dietary pattern scores were used for further analyses as confounding factors. The factor loadings of food items in dietary patterns are presented in online Supplementary Table S1.
Assessment of depressive symptoms
Depressive symptoms were assessed using the Chinese version of the Zung Self-Rating Depression Scale (SDS), a useful and well-validated questionnaire in the Chinese population(Reference Lee, Chiu and Wing24). The SDS includes twenty items, either positive or negative, which respondents are required to rate on a scale of 1–4. Sum totals of the twenty items produce a score ranging from 20 to 80, with greater values indicating increased severity of depressive symptoms. We conducted a screening test to calculate the sensitivity and specificity of the SDS in the study population (120 patients with clinically diagnosed depression and 120 healthy controls). Sensitivity and specificity were 83·6 and 96·4 %, respectively, for the Diagnostic and Statistical Manual of Mental Disorders (fourth edition) criteria for depressive symptoms, when an SDS score of 45 was used as a cut-off(Reference Xia, Wang and Yu25). In the present study, a cut-off score of 45 was used to determine the presence of depressive symptoms.
Assessment and definition of other variables
A questionnaire was used to collect information on socio-demographic variables, including sex, age, educational level, employment, smoking status, drinking status, marital status, whether one visits friends, household composition and household income. Physical activity during the most recent week was assessed using the short form of the International Physical Activity Questionnaire(Reference Craig, Marshall and Sjostrom26). The questionnaire asked whether participants had performed any activities from the following categories during the previous week: walking, moderate activity (household activities or child care) and vigorous activity (running, swimming or other sports activities). Metabolic equivalent hours per week were calculated using corresponding metabolic equivalent coefficients (3·3, 4·0 and 8·0, respectively) according to the following formula: metabolic equivalent coefficient of activity × duration (h) × frequency (d). Total physical activity levels were assessed by combining scores for different activities. BMI was calculated as weight in kilograms divided by height squared in metres (kg/m2). Blood pressure was measured twice from the upper left arm using a TM-2655 P automatic device (A&D Co.) after 5 min of rest in a seated position. The mean of these two measurements was taken as blood pressure value. Hypertension was defined as average systolic blood pressure ≥ 140 mmHg, average diastolic blood pressure ≥ 90 mmHg or use of antihypertensive medications(Reference James, Oparil and Carter27). Fasting blood glucose and lipids were collected in siliconised vacuum plastic tubes. Fasting blood glucose was measured using the glucose oxidase method. TAG and total cholesterol were measured by enzymatic methods. HDL-cholesterol was measured using the chemical precipitation method, with reagents from Roche Diagnostics on an automatic biochemistry analyser (Roche Cobas 8000 modular analyser). HbA1c separation and quantification were conducted using a HPLC analyser (HLC-723 G8; Tosoh). Additionally, an oral glucose tolerance test was performed, and postprandial glucose levels were determined in blood samples obtained 2 h after oral administration of a standard 75 g glucose solution. Type 2 diabetes was defined as having fasting blood glucose ≥ 7·0 mmol/l, 2-h postprandial blood glucose ≥ 11·1 mmol/l, HbA1c ≥ 6·5 % (48 mmol/mol) or a history of diabetes based on the 2014 American Diabetes Association criteria(28). Hyperlipidaemia was defined as total cholesterol ≥ 5·20 mmol/l, TAG ≥ 1·70 mmol/l or self-reported clinically diagnosed hyperlipidaemia, according to 2016 Chinese guidelines for the management of dyslipidaemia in adults(29).
Statistical analysis
Population characteristics were described according to the presence of depressive symptoms by sex. Continuous variables were presented as least square means and 95 % CI. Categorical variables were presented as percentage. ANOVA or χ 2 tests were used to evaluate differences in continuous and categorical variables, between participants with and without depressive symptoms. Quartiles were categorised across the DF intake (g/4184 kJ), based on the distribution of DF intake according to sex, and used for further analyses. Associations between quartile categories of DF intake and depressive symptoms were examined using logistical regression analysis. OR and 95 % CI were calculated. Moreover, in order to increase analytic rigor, we also conducted the Benjamini–Hochberg procedure to calculate adjusted P values. A crude model was used to calculate crude OR, without any adjustments. Model 1 was adjusted for age and BMI. Model 2 additionally adjusted for type 2 diabetes, hypertension, hyperlipidaemia, physical activity, smoking status, drinking status, educational level, household income, employment status, marital status, whether one visited friends, household composition, energy intake (kJ/d) and family disease history (including CVD, hypertension and diabetes), based on model 1. Model 3 additionally adjusted for dietary pattern scores (including vegetables pattern, sweet foods pattern and animal foods pattern) based on model 2. Moreover, in the sensitivity analysis, we explored the linear associations between DF intake (per 1 g increase) and depressive symptoms. The associations between different types of DF per 4184 kJ intake and leucocyte count were detected using ANCOVA in model 3. All analyses were performed according to sex using the Statistical Analysis System 9.3 edition for Windows (SAS Institute Inc.). All P values were two-tailed and the difference was considered to be significant when P < 0·05.
Results
Characteristics of participants
Among the 24 306 participants, 53·8 % (n 13 080) were men and 46·2 % (n 11 226) were women. Prevalence rates of depressive symptoms were 15·9 % (n 2075) and 18·2 % (n 2044) in men and women, respectively. Both soluble and insoluble DF contributed to total DF. The percentages of soluble DF that contributed to total, cereal, vegetable, fruit, soya and tuber DF were 48, 18, 39, 59, 71 and 19 % in men and 46, 16, 40, 54, 70 and 20 % in women, respectively. The percentages of cereal, vegetable, fruit, soya and tuber DF contributed to total DF were 16, 19, 35, 13 and 7 % in men and 15, 18, 39, 13 and 8 % in women, respectively. The mean (sd) of total DF intake per d (in g) were 24·17 (sd 15·60) and 22·38 (sd 14·74) in men and women, respectively. The range of total DF intake per d (g) was 0·11–75·64 and 1·57–64·00 in men and women, respectively.
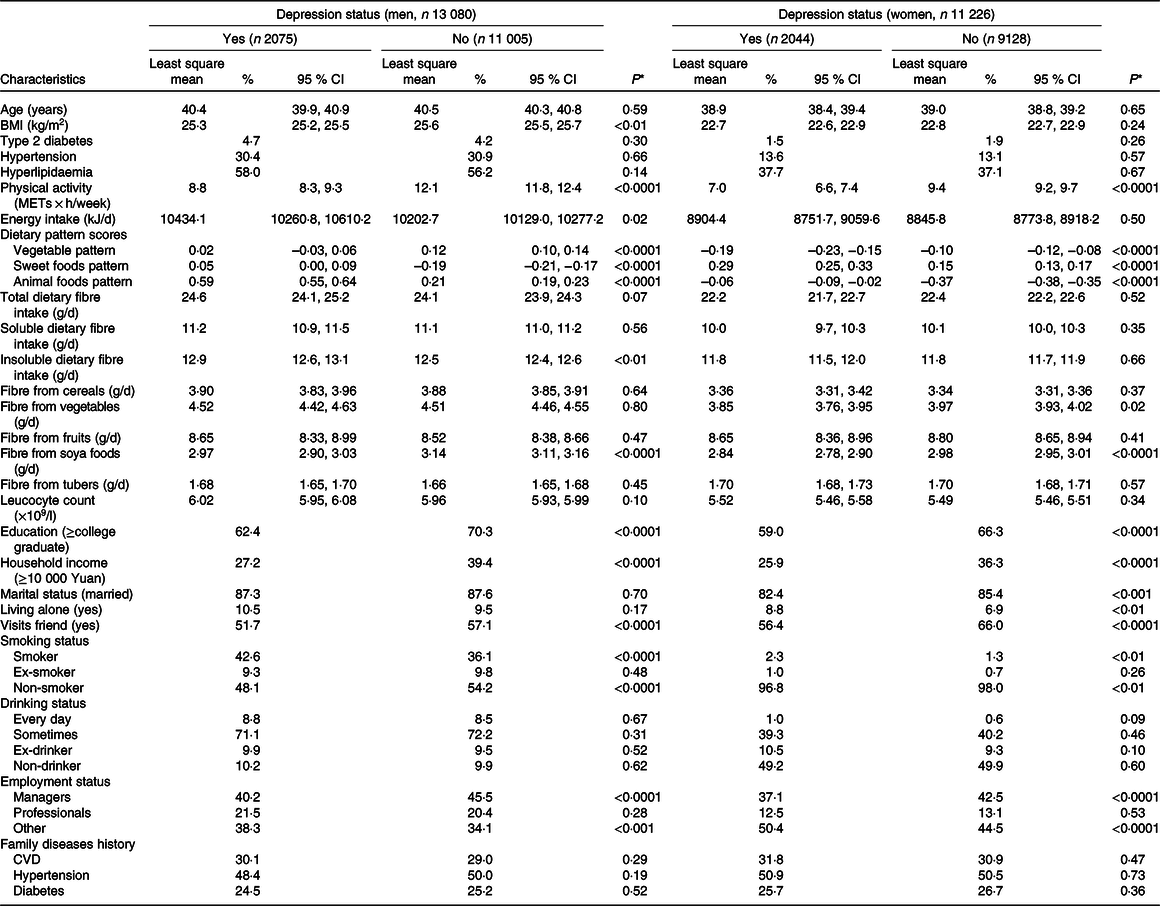
Socio-demographic, behavioural, anthropometric, dietary and clinical characteristics of participants according to depressive symptoms by sex are presented in Table 1. In men, participants with depressive symptoms tended to be current smokers, were less likely to be employed as a manager, visited fewer friends and had lower levels of BMI, physical activity, educational status and household income. Men with depressive symptoms had higher intake of total energy, sweet foods, animal foods and insoluble DF but lower intake of vegetables and DF from soya foods. In women, participants with depressive symptoms tended to be current smokers, were less likely to be employed as a manager and had lower levels of physical activity and household income. They were also less likely to be married or visit friends but were more likely to live alone. Women with depressive symptoms also had higher intake of sweet foods and animal foods, but a lower intake of vegetables, and DF from soya foods and vegetables (all P values < 0·05). Those with and without depressive symptoms did not differ significantly in their intake of total, soluble, cereals, fruits and tubers DF.
Table 1. Participant characteristics according to depressive symptoms
(Numbers and percentages; mean values and 95 % confidence intervals)

* ANOVA or χ 2 test.
Dietary fibre intake and depressive symptoms
Associations between total DF intake (g/4184 kJ) and prevalence of depressive symptoms are presented in Table 2. Compared with participants in the lowest quartile, the OR of depressive symptoms across increasing consumption of DF were 0·88 (95 % CI 0·77, 1·01), 0·77 (95 % CI 0·67, 0·90) and 0·83 (95 % CI 0·69, 0·99) in men. The adjusted P values for the second, third and fourth quartiles were 0·2976, 0·0028 and 0·0407, respectively. However, no linear association between total DF intake and depressive symptoms was found in men (online Supplementary Table S3). No significant associations between total DF intake and depressive symptoms were found in women after adjusting for confounding factors.
Table 2. Associations between total dietary fibre per 4184 kJ intake and depressive symptoms by sex
(Odds ratios and 95 % confidence intervals; median values and interquartile ranges (IQR); mean values and standard deviations)

SDS, Self-Rating Depression Scale.
* Adjusted for age and BMI.
† Additionally adjusted for type 2 diabetes, hypertension, hyperlipidaemia, physical activity, smoking status, drinking status, educational level, household income, employment status, marital status, whether one visits friends, household composition, energy intake (kJ/d) and family disease history (including CVD, hypertension and diabetes) based on model 1.
‡ Additionally adjusted for dietary pattern scores (including vegetables pattern, sweet foods pattern and animal foods pattern) based on model 2.
Soluble and insoluble dietary fibre intake and depressive symptoms
Table 3 presents the associations between soluble and insoluble DF intake (g/4184 kJ) and prevalence of depressive symptoms. Compared with participants in the lowest quartile, the OR of depressive symptoms across increasing soluble DF intake were 0·83 (95 % CI 0·72, 0·95), 0·75 (95 % CI 0·65, 0·87) and 0·74 (95 % CI 0·63, 0·87) in men after adjustments. In women, compared with participants in the lowest quartile, the OR of depressive symptoms across increasing soluble DF intake were 0·83 (95 % CI 0·72, 0·95), 0·92 (95 % CI 0·80, 1·06) and 0·83 (95 % CI 0·71, 0·98) after adjustments. No associations between insoluble DF intake and prevalence of depressive symptoms were found in either men or women after adjusting for confounding factors. No significant linear association between soluble/insoluble DF intake and depressive symptoms was found (online Supplementary Table S3).
Table 3. Associations between different types of dietary fibre per 4184 kJ intake and depressive symptoms by sex
(Odds ratios and 95 % confidence intervals; median values and interquartile ranges (IQR); mean values and standard deviations)
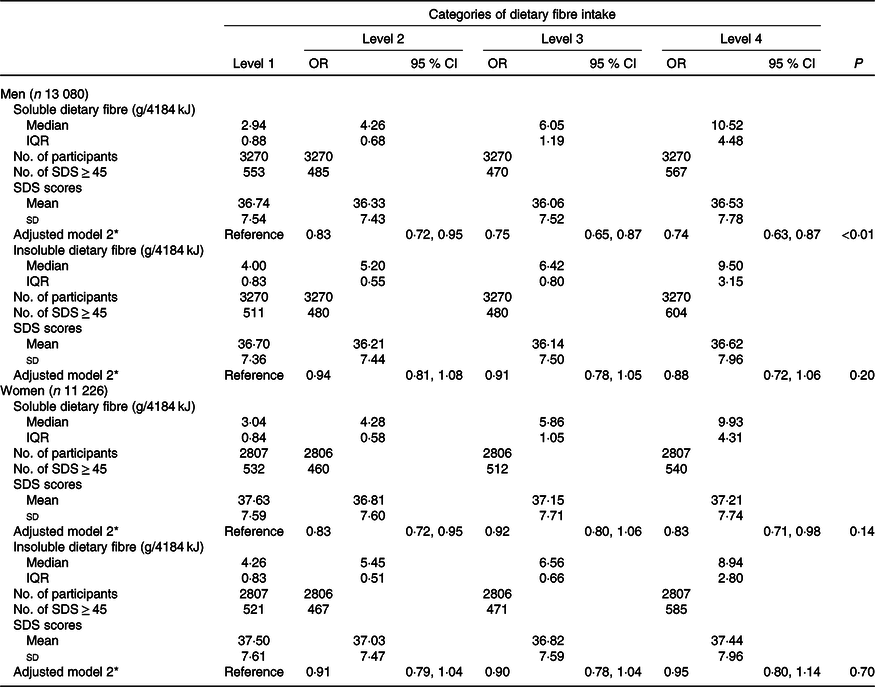
SDS, Self-Rating Depression Scale.
* Adjusted for age, BMI, type 2 diabetes, hypertension, hyperlipidaemia, physical activity, smoking status, drinking status, educational level, household income, employment status, marital status, whether one visits friends, household composition, energy intake (kJ/d), family disease history (including CVD, hypertension and diabetes) and dietary pattern scores (including vegetables pattern, sweet foods pattern and animal foods pattern).
Major sources of dietary fibre intake and depressive symptoms
Associations between major sources of DF intake and the prevalence of depressive symptoms are presented in Table 4 (detailed information can be found in online Supplementary Table S2). Compared with participants in the lowest quartile, the OR of depressive symptoms for participants in the highest quartile of DF intake from vegetables and soya foods were 0·79 (95 % CI 0·65, 0·96) and 0·69 (95 % CI 0·60, 0·81), respectively, in men. The same associations were observed in women. Compared with participants in the lowest quartile, the OR of depressive symptoms for participants in the highest quartile of DF intake from vegetables and soya foods were 0·77 (95 % CI 0·64, 0·93) and 0·82 (95 % CI 0·70, 0·95), respectively, in women. However, as presented in online Supplementary Table S3, only fibre from soya foods was inversely associated with depressive symptoms in men (β –0·148; P < 0·0001) and women (β –0·069; P = 0·04). No other significant linear associations between other types or sources of DF intake and depressive symptoms were found.
Table 4. Associations between major sources of dietary fibre per 4184 kJ intake and depressive symptoms by sex
(Odds ratios and 95 % confidence intervals)

* Adjusted for age, BMI, type 2 diabetes, hypertension, hyperlipidaemia, physical activity, smoking status, drinking status, educational level, household income, employment status, marital status, whether one visits friends, household composition, energy intake (kJ/d), family disease history (including CVD, hypertension and diabetes) and dietary pattern scores (including vegetables pattern, sweet foods pattern and animal foods pattern).
Discussion
To the best of our knowledge, the present study presents the first comprehensive analysis of the associations between the intake of different types and sources of DF, and the prevalence of depressive symptoms in a large sample from the general Chinese population (mean age 41 years; range 18–91 years). Results suggested that a higher intake of soluble, but not insoluble, DF was associated with lower prevalence of depressive symptoms in both men and women. A higher DF intake from vegetables and soya foods was associated with lower prevalence of depressive symptoms in both men and women.
Most previous studies explored the associations between total DF intake and depressive symptoms in specific populations, such as older adults(Reference Woo, Lynn and Lau11–Reference Gangwisch, Hale and Garcia13,Reference Gopinath, Flood and Burlutksy17) , adolescent girls(Reference Kim, Choi and Lee14) and young women(Reference Fang, Egleston and Gabriel16). Even though inverse associations between total DF intake and prevalence of depressive symptoms were found in these studies(Reference Woo, Lynn and Lau11–Reference Kim, Choi and Lee14,Reference Fang, Egleston and Gabriel16,Reference Gopinath, Flood and Burlutksy17) , analyses conducted in specific populations would limit the generalisation of their findings. Only two studies explored the associations between total DF intake and prevalence of depressive symptoms in general populations(Reference Miki, Eguchi and Kurotani15,Reference Xu, Li and Song18) . One study demonstrated that higher total DF intake was associated with lower prevalence of depressive symptoms in 1977 Japanese adults (aged 19–69 years) after adjusting for age, sex and worksite(Reference Miki, Eguchi and Kurotani15). However, the inverse association between total DF intake and depressive symptoms became non-significant after further adjustments for other confounding factors (including socio-demographic, behavioural, physical activity, sleep duration and dietary factors)(Reference Miki, Eguchi and Kurotani15). Another study of 16 807 American adults found that a higher total intake of DF was associated with lower prevalence of depressive symptoms(Reference Xu, Li and Song18). Compared with participants in the lowest quartile for total DF intake, the OR of depressive symptoms for participants in the highest quartile was 0·59 (95 % CI 0·44, 0·79), after adjustment for confounding factors(Reference Xu, Li and Song18).
The results suggested that total DF intake was inversely associated with the prevalence of depressive symptoms in men but not in women. The underlying mechanisms for sex differences in the associations between total DF intake and depressive symptoms remain unclear. One possible reason could be that the dietary habits appear to be different between men and women. The residual effect of dietary habits still exists even though we have adjusted for dietary pattern scores. Dietary habits were found to be different between men and women(Reference Xu, Qiao and Huang30). These variations in diet can lead to differences in the types and sources of DF intake, which in turn can lead to different associations between DF intake and depressive symptoms. As shown in Table 1, compared with men, women were more likely to consume the sweet pattern (identified by high intake of fruits and sweet foods). Meanwhile, the percentage of fruit DF that contributed to total DF was higher in women (39 %) than in men (35 %). A higher total DF intake from high-fructose foods (i.e. fruits) leads to a higher intake of fructose. Previous studies suggested that a high-fructose diet was positively associated with depression-like behaviour(Reference Harrell, Zainaldin and McFarlane31). Thus, these associations between total DF intake and prevalence of depressive symptoms could be affected by fructose. Moreover, in the unadjusted models, we found that the fourth quartile of total DF intake had the highest prevalence of depressive symptoms. However, the adjustment for dietary patterns reversed the associations between a higher fibre intake and higher odds of having a high depression score. The reason could be that fibre-rich foods also contain other components (e.g. fructose in preserved fruit) which contributed to the high prevalence of depressive symptoms. These associations had been reversed after adjusting for dietary patterns because the differences in diet (i.e. fruits) were adjusted.
In line with previous studies(Reference Miki, Eguchi and Kurotani15,Reference Fang, Egleston and Gabriel16) , we found no association between insoluble DF intake and the prevalence of depressive symptoms after adjusting for confounding factors. We also found that a higher soluble DF intake was associated with a lower prevalence of depressive symptoms in both men and women. To the best of our knowledge, only one previous study has explored the association between soluble DF intake and depressive symptoms(Reference Miki, Eguchi and Kurotani15). Compared with participants in the lowest tertile of soluble DF intake, the OR of depressive symptoms for participants in the second and third tertiles were 0·998 (95 % CI 0·75, 1·32) and 0·99 (95 % CI 0·68, 1·44), respectively(Reference Miki, Eguchi and Kurotani15). The median intake of soluble DF in the second and third tertiles was 1·4 and 1·9 g/4184 kJ per d, respectively(Reference Miki, Eguchi and Kurotani15). In the present study, the median of soluble DF intake in the fourth quartiles was 10·52 (interquartile range 4·48) and 9·93 (interquartile range 4·31) g/4184 kJ per d in men and women, respectively. Low soluble DF intake may not be enough to affect depressive symptoms. The differences of soluble DF intake between studies could be due to different dietary habits in the study populations (e.g. high intake of walnut and soya foods, which are rich in soluble DF, in our study). Moreover, the FFQ in the present study included 100 food items which is more than the FFQ used in the previous study, that included forty-six food items(Reference Miki, Eguchi and Kurotani15). Food intake information in the present study was more comprehensive than in the previous study(Reference Miki, Eguchi and Kurotani15). However, we only found significant linear associations between DF from soya foods and depressive symptoms. There could be several reasons for this. First, the associations between one unit (g) of DF and depressive symptoms were too small to be detected. Second, when different types or sources of DF were merged together, the associations between them and depressive symptoms could have been masked by each other. Third, it is also possible that the associations between other kinds or sources of DF intake and depressive symptoms could be non-linear. Thus, future studies are needed to explore the linearity of the associations between DF intake and depressive symptoms.
There are several possible mechanisms that can explain the negative association between DF intake and prevalence of depressive symptoms. First, previous observational studies demonstrated that DF intake was associated with lower levels of inflammatory markers, such as C-reactive protein(Reference Ajani, Ford and Mokdad32,Reference Bo, Durazzo and Guidi33) and IL-6(Reference Ma, Hebert and Li34). A link between inflammation and depression has long been established(Reference Howren, Lamkin and Suls35). Inflammation may contribute to inverse associations between total DF intake and prevalence of depressive symptoms. However, a previous meta-analysis suggested that only one out of seven intervention studies reported significant anti-inflammatory effects of DF intake(Reference Buyken, Goletzke and Joslowski36). We also did not find significant associations between DF intake and leucocyte count (online Supplementary Table S4). Considering that data for C-reactive protein or IL-6 were not available in our study, further studies are needed to investigate the role of inflammation in the associations between DF intake and depressive symptoms. Second, DF intake could be linked to depressive symptoms via the microbiota–gut–brain axis. SCFA, such as formate, acetate, propionate and butyrate, are the main products resultant from the fermentation of DF by intestinal bacterial(Reference Flint, Bayer and Rincon37). A previous study found negative correlations between faecal SCFA and depressive symptoms(Reference Skonieczna-Żydecka, Grochans and Maciejewska38). Regarding different types of DF, previous studies suggested that soluble DF has greater fermentability and could synthesise more SCFA than insoluble DF(Reference Mortensen and Nordgaard-Andersen39,Reference Farooq, Mohsin and Liu40) . This could partly explain why associations between DF intake and depressive symptoms were only significant for soluble DF but not insoluble DF. With regard to different sources of DF intake, we found that DF intake from vegetables and soya foods, but not cereals, fruits and tubers, was associated with depressive symptoms. One possible reason could be that vegetables and soya foods may more effectively stimulate colonic fermentation and lead to higher proportions of SCFA(Reference Titgemeyer, Bourquin and Fahey41,Reference McBurney and Thompson42) . Another reason could be that there were other components of vegetables and soya foods, such as sulforaphane(Reference Yao, Zhang and Ishima43) and soya isoflavone(Reference Miyake, Tanaka and Okubo44), that contributed to the observed associations.
The present study had several strengths. First, we adjusted for potentially confounding factors, including socio-demographic, behavioural, anthropometric, dietary and clinical factors. Second, the large sample size provided sufficient statistical power to detect the associations between DF intake and prevalence of depressive symptoms. Third, the comprehensive analyses provided associations between different types and sources of DF intake and prevalence of depressive symptoms.
Some limitations are also notable. First, there could have been recall bias in the study, and, therefore, reported food intake could have been inaccurate, due to the nature of self-report FFQ. Second, it is impossible to infer causality due to the cross-sectional study design. For example, depressive symptoms could affect dietary behaviours resulting in lower DF intake in participants with more depressive symptoms. Third, even though many covariates were considered, we cannot rule out the possibility that residual and unmeasured factors might have contributed to the observed associations. Fourth, depressive symptoms were evaluated by using the SDS, a self-reported questionnaire, rather than diagnostic psychiatric interviews. However, the SDS is a useful and well-validated questionnaire in Chinese populations(Reference Lee, Chiu and Wing24). Moreover, we conducted a screening test to validate the SDS in our sample. Sensitivity and specificity were 83·6 and 96·4 %, respectively, for the Diagnostic and Statistical Manual of Mental Disorders criteria for depressive symptoms, when an SDS score of 45 was used as a cut-off. Fifth, with the exception of DF from soya foods, no significant linear association between other kinds or sources of DF intake (treated as continuous variables) and depressive symptoms was found. Using quartiles of DF intake as independent variables and median value of each quartile as a continuous variable to study the linear trend in the main analyses may lead to a loss of statistical power.
Results suggested that there were sex differences in the associations between DF intake and depressive symptoms. First, total DF intake was associated with depressive symptoms only in men. Second, the linear trend between soluble DF intake and depressive symptoms was observed only in men, too. Moreover, the association between DF intake and depressive symptoms was only significant for soluble DF but not insoluble DF. Further studies are needed to classify the mechanisms underlying those different associations. Furthermore, prospective cohort studies and randomised controlled trials are needed to validate these findings.
Conclusion
Findings in the present study suggest that a higher intake of soluble, vegetable and soya DF is associated with a lower prevalence of depressive symptoms in both men and women. The present study is only one step in the process, and the results should be confirmed through prospective and interventional studies.
Acknowledgements
We gratefully thank all the participants in the study and Tianjin Medical University General Hospital-Health Management Center for the opportunity to perform the study.
The present study was supported by grants from the National Natural Science Foundation of China (no. 81903302 and 91746205), China Postdoctoral Science Foundation (no. 2018M641753) and 345 Talent Project of Shengjing Hospital of China Medical University (no. M0294).
Y. X., K. N. and Y. Z., contributed to the study conception and design; Y. X., Y. L., S. Z., Q. Z., L. L., G. M., H. W., S. S., X. W., M. Z., Q. J. and K. S. contributed to data collection, assembly, analysis and interpretation of the data; Y. X. and Q. W. contributed to the revising of the manuscript; Y. X., K. N. and Y, Z., contributed to the manuscript drafting and approval of the final version of the manuscript.
The authors declare that they have no conflicts of interest.
Supplementary material
For supplementary material referred to in this article, please visit https://doi.org/10.1017/S0007114520003566