Diabetes mellitus is a heterogeneous group of metabolic abnormalities, associated with microvascular complications related to hyperglycaemia, and other metabolic disorders, implying a higher risk of developing CVD( 1 – Reference Ogurtsova, da Rocha Fernandes and Huang 3 ). Risk factor control, including intensive glycaemic control, reduces macro- and microvascular complications( 1 – Reference Ogurtsova, da Rocha Fernandes and Huang 3 ). Being a promising nutritional strategy to prevent metabolic diseases, dietary fibre, especially resistant starches (RS), has been widely studied( Reference Kaczmarczyk, Miller and Freund 4 – Reference Slavin 6 ).
Starches and their derivatives have been widely used in food processing, pharmaceuticals, chemicals, due to their structural plasticity( Reference Guo, Jia and Zhao 7 ). The C-type starches are carbohydrate polymers that have specific crystal adjustability, being found in seeds or rhizomes of various legumes, medicinal plants and crops.
Most RS and slowly digestible starches are C-type starches and cannot be converted to glucose after incubation with digestive enzymes, such as pancreatic amylase and amyloglucosidase at 37ºC. Both RS and slowly digestible starches can decrease the starch hydrolysis rate in vivo and can be considered dietary fibre. The RS are known to modulate insulin sensitivity in healthy and obese volunteers as well as in patients with the metabolic syndrome( Reference Robertson, Bickerton and Dennis 8 – Reference Maki, Pelkman and Finocchiaro 11 ), thus contributing to improve the glycaemic response.
There are five types of RS( Reference Birt, Boylston and Hendrich 12 ): RS I, which is a physically inaccessible starch surrounded by a protein matrix and cell wall material; RS II refers to the granular starch with the B- or C-polymorph content, being highly resistant to enzymatic hydrolysis; RS III consists of retrograded starch polymers (mainly amylose) produced when starch reaches near-refrigeration temperatures (4–5ºC) after gelatinisation; RS IV is a chemically modified starch formed either by cross-linking or by adding chemical derivatives; and RS V is the result of a starch–lipid interaction, in which amylose and amylopectin long-branch chains form single-helical complexes with fatty acids and alcohols.
Green banana biomass contains a significant amount of type III RS, and its hydrolysis products are not absorbed in the small intestine. The physiological effects of RS are similar to those of dietary fibres, slowing down gastric emptying, increasing satiety, improving insulin secretion and producing SCFA by fermentation in the small intestine( Reference Evert, Boucher and Cypress 13 ). Foods containing RS can modify postprandial glycaemia, prevent hypoglycaemia and reduce hyperglycaemia.
Long-term studies evaluating the RS efficacy in individuals with diabetes or pre-diabetes are scarce in the literature. Therefore, the aim of our study was to investigate the effects of a 24-week supplementation with RS from green banana biomass on changes in levels of glycated Hb (HbA1c), fasting plasma glucose, homeostasis model assessment of insulin resistance (HOMA-IR) and body composition in subjects with pre-diabetes or type 2 diabetes.
Methods
Study design
The present study was a 24-week, prospective, randomised, open-label trial, with parallel arms and blinded endpoints. The study protocol was approved by the local Ethics Committee (Comitê de Ética em Pesquisa da Universidade Federal de São Paulo, CEP-UNIFESP, CAAE: 48643415.2.0000.5505). It was also registered (NCT03230123) under the BIOMEL Study (Effects of Green Banana BIOmass Consumption in Patients with Pre-diabetes and Diabetes MELlitus) acronym and can be accessed through the Internet (https://clinicaltrials.gov/).
Participants were consecutively included in the study after they read and signed the written informed consent form that is obtained before any study procedure.
The study was conducted at the Department of Medicine, Universidade Federal de Sao Paulo, SP, Brazil. The recruitment process began in February 2016, and the intervention was conducted until March 2017. The calculation of sample size took into account variations in HbA1c, with a type I error α of 0·05 and a type II error β of 0·2 (80 % power). Reduction in HBA1c between 6-month intervention and baseline was the primary outcome. Reduction in body weight, BMI, waist circumference and percentage of fat mass between assessments were the secondary outcomes.
Inclusion and exclusion criteria
Patients of both sexes aged 18–85 years, with HbA1c ≥ 6·5 % for diabetic patients or between 5·7 and 6·4 %, for pre-diabetic patients(1–Reference Ogurtsova, da Rocha Fernandes and Huang3), on a stable dose of anti-diabetic drugs and without anticipation of dosage changes during the study were included in the study protocol. Subjects using insulin, those who needed change in dose or addition of medication for diabetes, with any malignancy except basal-cell carcinoma, heart failure (New York Heart Association class III or IV), renal failure (estimated glomerular filtration rate < 30 ml/min) or under dialysis therapy, AIDS, uncontrolled hypothyroidism (thyroid-stimulating hormone > 10 μIU/ml), active liver disease, severe psychiatric disorders or any other disease that, in the opinion of the investigator, could interfere with the results were excluded from the study protocol.
Participants
A total of 142 participants were screened; eleven of them were excluded due to their levels of HbA1c (<5·7 %; n 7) or need for addition of anti-hyperglycaemic drugs during the study (n 4). In all, 131 eligible patients were assigned to either diet intervention plus green banana biomass (G1, n 68) or diet intervention alone (G2, n 63) in a 1:1 ratio, using a random-number generator program. All patients received nutritional support for pre-diabetes and diabetes, according to the current guideline recommendations( Reference Wheeler, Dunbar and Jaacks 14 , 15 ). Thirteen patients were discontinued due to their need for insulin (six in G1, seven in G2), and five subjects in G2 did not comply with the diet intervention. Sixty-one individuals in the biomass group (G1) and fifty-two in the control group (G2) concluded the study protocol. Subjects in the G1 group consumed a diet with the addition of green banana biomass (40 g/d, RS: approximately 4·5 g) and those in the G2 group consumed diet alone. Body composition measurements and laboratory analyses were collected at baseline and 6 months after the participants were included in the study; dietary questionnaires and nutrition counselling were assessed at baseline, 1, 3 and 6 months (Fig. 1).
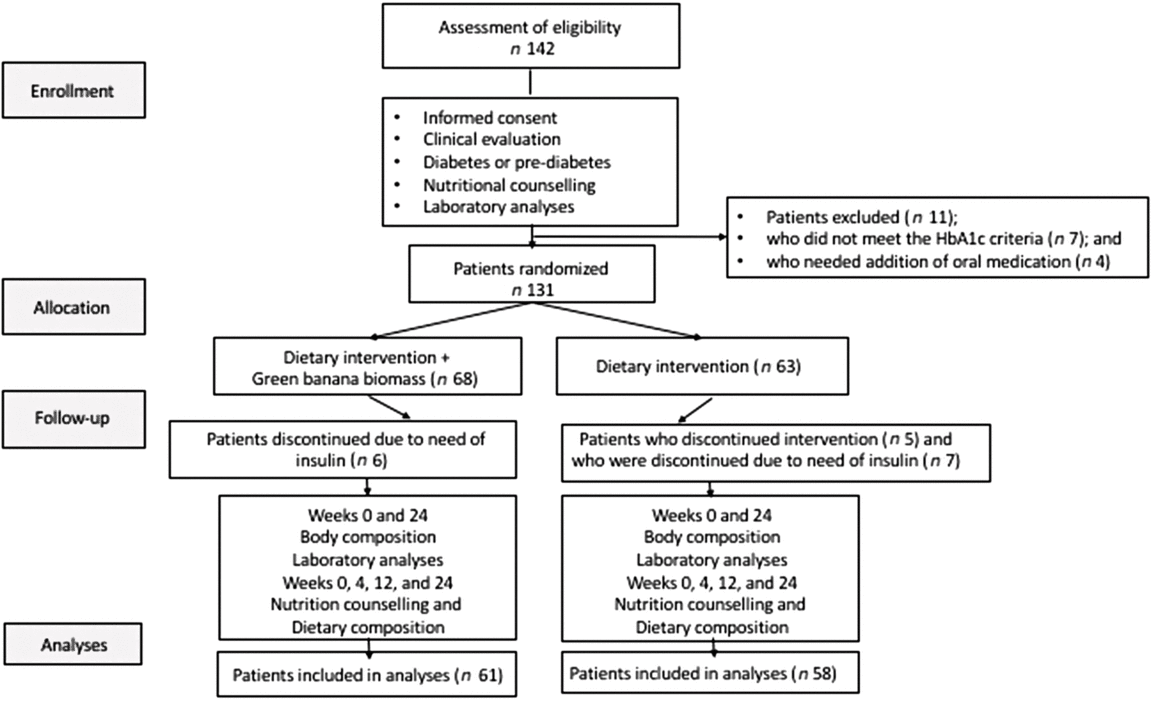
Fig. 1. Design of the BIOMEL Study (Effects of Green Banana BIOmass Consumption in Patients with Pre-diabetes and Diabetes MELlitus). Assessment of eligibility, enrolment, allocation to therapies, follow-up and analyses. A total of 142 participants were screened; eleven were excluded due to their glycated Hb (HbA1c) levels <5·7 % (n 7) or to their need to add anti-hyperglycaemic drugs during the protocol (n 4); 131 eligible patients were assigned to one of two groups, diet intervention plus green banana biomass (G1, n 68) or diet intervention alone (G2, n 63) in a 1:1 ratio. All patients received nutritional support for pre-diabetes and diabetes; thirteen patients were discontinued due to need of insulin (six in G1, seven in G2), and five subjects in G2 discontinued the diet intervention; sixty-one individuals in the biomass group (G1) and fifty-two in the control group (G2) concluded the study protocol. Body composition measurements and laboratory analyses were collected at baseline and 6 months; dietary questionnaires and nutrition counselling were assessed at baseline, 1, 3 and 6 months.
Interventions
Diet plan
The dietary plan was individualised, and all participants with pre-diabetes or diabetes received nutritional support according to the Brazilian Society of Diabetes( 16 ), taking into account the total energy expenditure, based on three standardised menus (20–25 kcal/kg (84–105 kJ/kg) of current weight, for weight reduction; 25–30 kcal/kg (105–126 kJ/kg) of current weight, for weight maintenance; and 30–35 kcal/kg (126–146 kJ/kg) of current weight, for weight gain)( Reference Martins and Cardoso 17 ). Macronutrient distribution was adjusted according to the Acceptable Macronutrient Distribution Range( 18 ). Subjects were advised to substitute equivalent foods using a food replacement list based on the MyPlate’s food groups( 19 ).
Green banana biomass
Subjects in the intervention group received plastic receptacles containing 1 kg of green banana biomass, which was kept refrigerated and consumed as two tablespoons 40 g/d, thus providing approximately 4·5 g of RS. The product was added to any food preparation without heating. The RS from green banana biomass was standardised and produced by Essência do Vale Alimentos (Cruzeiro) according to the technical recommendations. Nutrition information and the amount of RS in green banana biomass are shown in the online Supplementary Tables S1 and S2 ( Reference Goñi, García-Díaz and Mañas 20 ). Green banana biomass was well tolerated, and no subject discontinued its use due to any side effect, such as diarrhoea, constipation or abdominal bloating. The green banana biomass was consumed at therapeutic doses, and the participants were recommended to increase water intake.
Evaluation of food consumption
Dietary intake was estimated using 24-h food records, applied at baseline, 1, 3 and 6 months. The amounts of energy intake, macro- and micronutrients, total lipids, cholesterol, carbohydrates, fatty acids and vitamins were calculated using the Avanutri Software (Avanutri Revolution, v. 4.0), based on the Brazilian Food Composition( 21 ), Chemical Food Composition tables( Reference Philippi 22 ) and information from the Brazilian Institute of Geography and Statistics( 23 ). Standardised FFQ were also applied at the same time points( Reference Slater, Philippi and Marchioni 24 ). Such questionnaires allow one to objectively record both the frequency (daily, weekly, monthly or annually) and amount (quantities) of food consumption. This tool was aimed at evaluating the diet of population groups with a list of foods and food preparations( Reference Slater, Philippi and Marchioni 24 ).
The food portion size was based on the Brazilian standard kitchen utensils, and all participants were advised to use them for measuring their own consumption. An adapted FFQ, including vegetable foods, was used to assess the consumption of phytosterols, as described by Martins et al.( Reference Martins, Fonseca and Ballus 25 ). Compliance with dietary plan and RS consumption was assessed every month, closely monitoring each patient during the procedure. Side effects were also assessed at these visits.
Anthropometric parameters and bioelectrical impedance analysis
Body composition (weight, height, BMI, waist and hip circumferences and waist:hip ratio) was measured using standard procedures. Bioelectrical impedance was analysed using a portable, battery-powered bioelectrical impedance analyser (Biodynamics 450, TBW®). It emits an imperceptible electrical current that travels through the body water compartment, thus assessing the degree of resistance to current flow and determining body weight (kg) and composition.
The operation principle takes into account that the majority of body water is located in the muscle tissue, which offers less impedance to current flow, and thus, greater current flows indicate a greater fat-free mass. The estimated fat-free mass is then used to calculate fat percentage.
Patient information was conducted to the analyser through a connection with the patient’s wrist and ankle. Connections to the patient were obtained using standard ECG sensor pad electrodes. Resistance and reactance were measured directly from the body. The analyser used regression analyses and computed as follows: resistance (R), reactance (X), phase angle (α), body capacitance (C), fat-free mass, body cell mass, extracellular mass, fat mass, BMI, BMR, total body water, intracellular water, extracellular water, total body water/fat-free mass and total body water /total weight. Participants were asked to wear light clothes, advised to fast for 4 h, refrain from alcohol, caffeine and chocolate consumption, not to perform physical exercise, discontinue diuretics 24 h prior to the test and empty the bladder before the procedure. Investigators who performed bioelectrical impedance analysis were blinded to patients’ allocation.
Clinical assessment
Medical visits were performed at baseline and 6 months after intervention. Information on demographic data, medical history, concomitant medication and adverse events was recorded. Clinical examination was performed at the same time points, with assessment of vital signs (systolic and diastolic blood pressure and heart rate).
Laboratory parameters
Overnight fasting blood samples were obtained for all participants at baseline and 6 months of intervention. Commercial kits (Cobas Mira®) were used in the analysis (automated enzymatic assay) of the following biomarkers: blood glucose, HbA1c, %, total cholesterol, HDL-cholesterol and TAG.
The Friedewald equation was used to calculate the LDL-cholesterol concentration when TAG were <400 mg/dl (4·5 mmol/l) ( Reference Friedewald, Levy and Fredrickson 26 ). Fasting insulin was measured using the immunofluorometric assay. The HOMA-IR (fasting insulin (μIU/ml) × fasting glucose (mg/dl)/405) was calculated, with the cut-off value set at ≥2·8( Reference Matthews, Hosker and Rudenski 27 ).
All analyses were performed at the Central Laboratory, Universidade Federal de São Paulo, UNIFESP, in a blinded fashion.
Statistical analysis
Categorical variables are expressed as n and percentage and were compared between groups using the Pearson’s χ 2 test. The Kolmogorov–Smirnov test was used to assess normality. Numerical variables were expressed as means and standard deviations, when Gaussian distribution was observed, or medians and interquartile ranges, when non-Gaussian distribution was observed.
Groups were compared using the Student’s t or Mann–Whitney U tests, as appropriate. Within-group comparisons were carried out using the paired t or Wilcoxon tests. Exploratory analysis of patients with diabetes and pre-diabetes was performed by treatment arm. All analyses were based on the ’intention-to-treat’ principle.
Statistical significance was set at P values < 0·05. All analyses were performed using the Statistical Package for Social Sciences (SPSS v. 18·0) programme.
Results
Characteristics
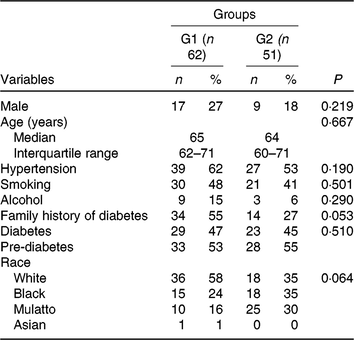
Baseline characteristics were similar in both groups (Table 1). Male subjects were similarly represented in the green banana biomass (G1, 27 %) and control (G2, 18 %) groups (NS); their median ages were 65 (IQR 62–71) years in G1 and 64 (IQR 60–71) years in G2. Part of them had diabetes (47 % in G1; 45 % in G2) and the remainder had pre-diabetes.
Table 1. Demographic and clinical characteristics of participants who received nutritional support plus green banana biomass (G1) or diet alone (control; G2)* (Numbers of participants and percentages; medians and interquartile ranges)
* Categorical variables were compared between groups using the χ 2 test. Age was compared between groups using the using the Mann–Whitney U test.
Many of them had hypertension (62 % in G1; 53 % in G2), whereas others had family history of diabetes (55 % in G1; 27 % in G2). Regarding race, distribution of patients was not different between groups.
Anthropometric measures and vital signs assessment
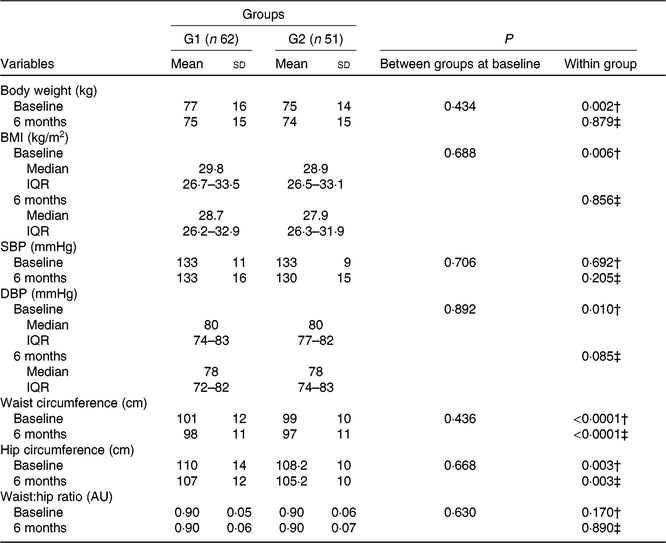
Anthropometric data and vital signs at baseline and after 6 months of intervention are shown in Table 2. Subjects with pre-diabetes and diabetes were overweight, with blood pressure of 133/80 mmHg, without difference between groups regarding anthropometric measures or vital signs.
Table 2. Anthropometric characteristics and vital signs of participants who received nutritional counselling plus green banana biomass (G1) or diet alone (control; G2), according to the treatment arm at baseline and end of intervention* (Mean values and standard deviations; medians and interquartile ranges (IQR))
SBP, systolic blood pressure; DBP, diastolic blood pressure; AU, arbitrary units.
* Numerical variables were compared between groups using the Student’s t or Mann–Whitney U test; within-group comparisons were made using the paired t or Wilcoxon test when appropriate.
† Comparisons between baseline and 6-month periods in G1.
‡ Comparisons between baseline and 6-month periods in G2.
After 6 months of intervention, subjects in the green banana biomass group (G1) showed a reduction in body weight (P = 0·002, Fig. 2(a)), BMI (P = 0·006, Fig. 2(b)), waist (P < 0·0001, Fig. 2(c)) and hip (P = 0·003, Fig. 2(d)) circumferences and decrease in diastolic blood pressure (P = 0·010) (Table 2). Controls showed reduction in waist (P < 0·0001) and hip (P = 0·003) circumferences.

Fig. 2. Box-plots showing the distribution of body weight, kg (a), BMI, kg/m2 (b), waist circumference, cm (c) and hip circumference, cm (d) at baseline (![]() ) and 6-month intervention (
) and 6-month intervention (![]() ) with resistant starch (RS) from green banana biomass (G1) or controls (G2). Groups were comparable at baseline and 6 months (NS). In G1, weight loss (P = 0·002) (a), and reduction in BMI (P = 0·006) (b) were observed at 6 months. In both groups, reduction was observed in waist and hip circumferences (P < 0·0001 and P = 0·003 in G1 and P < 0·0001 and P = 0·003 in G2, respectively) (c) and (d). Boxes represent medians, 25th and 75th percentiles; whiskers represent extreme values.
) with resistant starch (RS) from green banana biomass (G1) or controls (G2). Groups were comparable at baseline and 6 months (NS). In G1, weight loss (P = 0·002) (a), and reduction in BMI (P = 0·006) (b) were observed at 6 months. In both groups, reduction was observed in waist and hip circumferences (P < 0·0001 and P = 0·003 in G1 and P < 0·0001 and P = 0·003 in G2, respectively) (c) and (d). Boxes represent medians, 25th and 75th percentiles; whiskers represent extreme values.
Laboratory results
Baseline laboratory parameters were comparable, except for HDL-cholesterol that was lower in the green banana biomass group. After 6 months of intervention, a significant reduction in blood glucose (P = 0·021) and HbA1c (P < 0·0001) was observed in G1, whereas a reduction in HbA1c (P = 0·002) and HDL-cholesterol (P = 0·020) was observed in G2 (Table 3; Fig. 3(a) and (b)). Basal insulin plasma levels and HOMA-IR did not significantly change after interventions (Table 3).
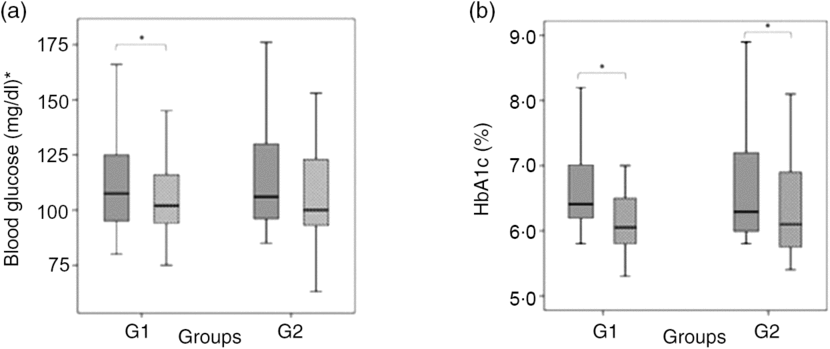
Fig. 3. Box-plots showing the distribution of blood glucose, mg/dl (a), and glycated Hb (HbA1c), % (b) at baseline (![]() ) and after 6 months of intervention (
) and after 6 months of intervention (![]() ) with resistant starch (RS) from green banana biomass (G1) or controls (G2). Groups were comparable at baseline and 6 months (NS). Significant reductions were observed in blood glucose (P = 0·021) and HbA1c (P < 0·0001) in G1, and in HbA1c (P = 0·002) in G2 (a) and (b). Boxes represent medians, 25th and 75th percentiles; whiskers represent extreme values. * To convert glucose in mg/dl to mmol/l, multiply by 0·0555.
) with resistant starch (RS) from green banana biomass (G1) or controls (G2). Groups were comparable at baseline and 6 months (NS). Significant reductions were observed in blood glucose (P = 0·021) and HbA1c (P < 0·0001) in G1, and in HbA1c (P = 0·002) in G2 (a) and (b). Boxes represent medians, 25th and 75th percentiles; whiskers represent extreme values. * To convert glucose in mg/dl to mmol/l, multiply by 0·0555.
Table 3. Laboratory characteristics of participants who received nutritional counselling plus green banana biomass (G1) or diet alone (control; G2) according to treatment arm, at baseline and end of study* (Mean values and standard deviations; medians and interquartile ranges (IQR))
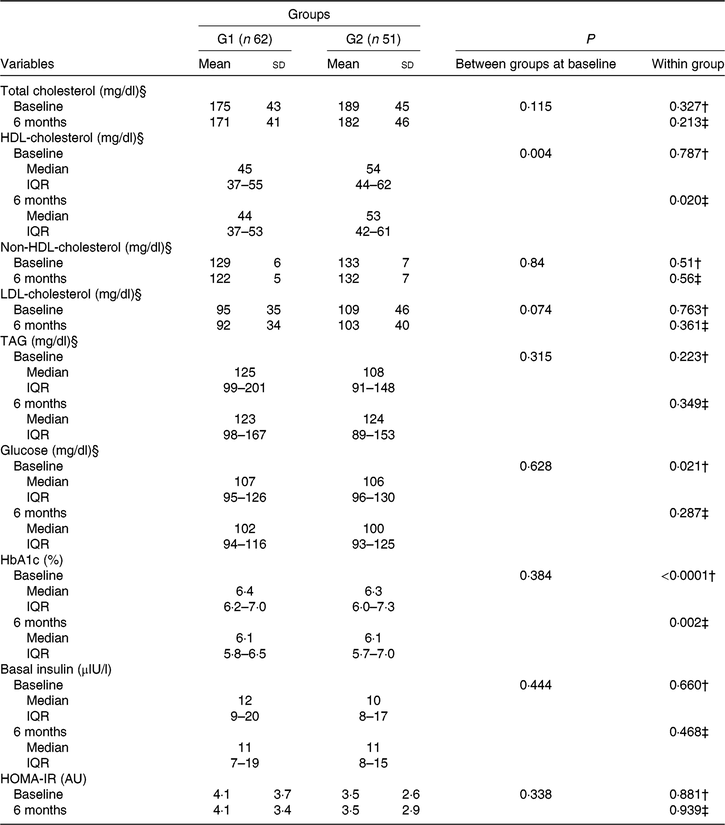
HbA1c, glycated Hb; HOMA-IR, homeostasis model assessment of insulin resistance.
* Numerical variables were compared between groups using the Student’s t or Mann–Whitney U test; within-group comparisons were made using the paired t or Wilcoxon test when appropriate.
† Comparisons between baseline and 6-month periods in G1.
‡ Comparisons between baseline and 6-month periods in G2.
§ To convert cholesterol in mg/dl to mmol/l, multiply by 0·0259. To convert TAG in mg/dl to mmol/l, multiply by 0·0113. To convert glucose in mg/dl to mmol/l, multiply by 0·0555.
Percentage change between groups in laboratory parameters was tested, and a higher percentage reduction in HDL-cholesterol was observed in G2 (P = 0·021; Mann–Whitney U test), but no difference between groups was observed for other parameters (data not shown).
In pre-diabetes, non-significant differences were observed in the percentage reduction in HbA1c (P = 0·085) and fasting glucose (P = 0·077) in our exploratory analyses (Table 4). Treatments did not affect percentage changes in either lipid or glucose parameters in patients with diabetes (Table 4).
Table 4. Exploratory analyses of change values (% change from baseline) in lipid and glucose metabolism parameters, by group and the presence of type 2 diabetes or pre-diabetes† (Medians and interquartile ranges (IQR))
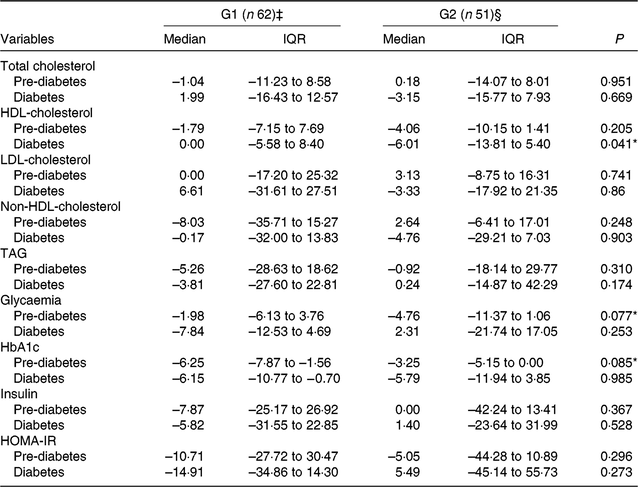
G1, green banana biomass group; G2, control group; HbA1c, glycated Hb; HOMA-IR, homeostasis model assessment of insulin resistance.
* P < 0·05, Mann–Whitney U test.
† Medians were compared using the Mann–Whitney U test.
‡ Pre-diabetes (n 33); diabetes (n 29).
§ Pre-diabetes (n 28); diabetes (n 23).
Diet composition
At baseline, both groups were comparable regarding nutrient intake (Table 5). After 6 months, increase in fibre consumption (G1, P < 0·0001; G2, P = 0·020; Wilcoxon test) and reduction in both lipid consumption (G1, P = 0·050, and G2, P = 0·005; paired t test) and polyunsaturated fat (G1, P < 0·0001, and G2, P = 0·014; Wilcoxon test) were observed; an increase in the ingestion of cholesterol was also observed in G1 (P = 0·018; Wilcoxon test; Table 5).
Table 5. Diet composition of participants who received nutritional counselling plus green banana biomass (G1) or diet alone (control; G2), according to group, at baseline and after intervention*
(Mean values and standard deviations; medians and interquartile ranges (IQR))
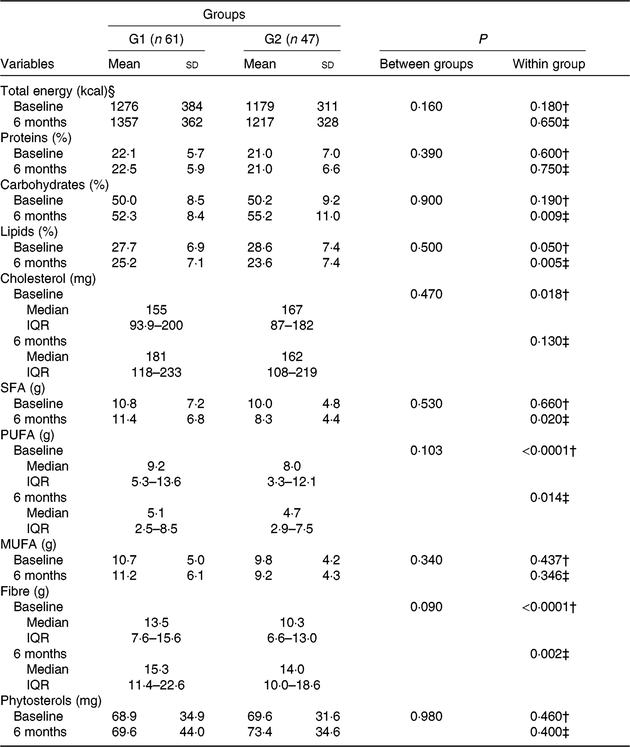
* Numerical variables were compared between groups using the Student’s t or Mann-Whitney U test; within-group comparisons were made using the paired t or Wilcoxon test when appropriate.
† Comparisons between baseline and 6-month periods after intervention in G1.
‡ Comparisons between baseline and 6-month periods in G2.
§ To convert energy in kcal to kJ, multiply by 4·184.
The ingestion of micronutrients from diet was evaluated at baseline and 6 months. Both groups were comparable regarding intake of nutrients, except for vitamin A (higher in controls, P = 0·041; Mann–Whitney U test) and manganese (lower in controls, P = 0·041; Student’s t test for unpaired samples). In G1, reduction in the intake of vitamins B1 (P = 0·010; Wilcoxon test) and E (P < 0·0001; Wilcoxon test) and increase in the intake of vitamins B2 (P < 0·0001), B5 (P = 0·0001), B6 (P < 0·0001), B12 (P = 0·01), C (P = 0·001) and folic acid (P = 0·0001) (Wilcoxon test) were observed.
Regarding minerals, increase in the ingestion of Ca (P = 0·011; paired t test), Se (P = 0·003; Wilcoxon test) and K (P = 0·001; paired t test) and reduction in Na consumption (P = 0·004; paired t test) were observed in G1. In controls, reduction in the intake of vitamin E (P = 0·009; Wilcoxon test); increase in the intake of vitamins B6 (P = 0·02; Wilcoxon test), folic acid (P = 0·048; Wilcoxon test), B5 (P = 0·02; Wilcoxon test), K (P = 0·02) and Mn (P = 0·03); and reduction in Na consumption (P = 0·001; paired t test for all) were observed (data not shown).
Bioelectrical impedance
In the bioelectrical impedance parameters, no significant difference between groups was observed at baseline (Table 6). Consumption of RS promoted reduction in body weight (P = 0·002) and fat mass percentage (P = 0·002) and increase in lean mass percentage (P = 0·011; paired t test for all; Table 6).
Table 6. Bioelectrical impedance characteristics of participants who received nutritional counselling plus green banana biomass (G1) or diet alone (control; G2), according to the treatment arm at baseline and 6 months after intervention* (Mean values and standard deviations)

α, Phase angle; C, body capacitance; R, resistance R; X, reactance; BCM, body cell mass; ECM, extracellular mass; LM, lean mass; FM, fat mass; ICW, intracellular water; ECW, extracellular water; TBW, total body water.
* Mean values were compared between groups using the Student’s t test; within group, comparisons were made using the paired t test.
† Comparisons between baseline and 6-month periods after intervention in G1.
‡ Comparisons between baseline and 6-month periods in G2.
§ To convert energy in kcal to kJ, multiply by 4·184.
Discussion
Our study showed that in subjects with pre-diabetes and diabetes the consumption of RS from green banana biomass added to a diet for 6 months was followed by reduction in body weight, BMI, waist and hip circumferences, diastolic blood pressure, decrease in glucose and HbA1c levels, decrease in fat mass and increase in lean mass percentages.
The diet intervention reduced waist and hip circumferences as well as HbA1c and HDL-cholesterol blood concentrations.
RS have been analysed in animal models and kinetic and short-term human studies, and their effects on glucose metabolism, inflammation, and prevention of diabetes were evaluated.
The hypoglycaemic effects of low, medium and high doses of RS II were studied in rats with type 2 diabetes( Reference Sun, Ma and Zhang 28 ). Regulation in the levels of plasma and liver lipids, fructosamine, oral glucose tolerance test, insulin and glucose metabolism was improved in diabetic rats taking RS II. In the pancreas, the expression levels of insulin receptor substrates 1 and 2 were enhanced after RS II was consumed. These results from a study with diabetic rats fed RS suggested that decreases in blood glucose levels are regulated through the alteration in the expression levels of genes related to glucose metabolism. In other study with Zucker diabetic fatty rats, RS decreased the levels of HbA1c, blood glucose, HOMA-IR, and delayed the onset of diabetes as compared with other non-digestible starch-based diets( Reference Hedemann, Hermansen and Pedersen 29 ). In conventionalised mice fed RS under a Western diet, insulin sensitivity was improved and Western diet-induced changes in microbiome composition were restored. Reduction was observed in the gene expression of adipose tissue macrophage markers and caecal concentrations of various bile acids. These effects of RS were also observed in germ-free littermates. Improvement in insulin levels was independent of the microbiota and may involve changes in the bile acid cycle and adipose tissue immune modulation( Reference Bindels, Segura Munoz and Gomes-Neto 30 ).
In enzyme kinetic studies, consumption of retrograded starch depleted total digestible starch and slowed down the rate of intestinal digestion through direct inhibition of α-amylase, with important implications for the prevention and management of type 2 diabetes and CVD( Reference Patel, Royall and Gaisford 31 ).
In elderly fragile patients with type 2 diabetes, who used an enteral diabetes–specific formula containing RS IV for 6 weeks, a reduction in the dietary glycaemic response has been proposed as a way to explain the response to the risk of diabetes complications( Reference Mesa García, García-Rodríguez and Rico 32 ). HbA1c, E-selectin and monocyte chemo attractant protein-1 were significantly decreased, tending to decrease the soluble vascular cell adhesion molecule and plasminogen activator inhibitor-1.
In women with pre-diabetes, RS II significantly decreased HbA1c, TNF-α and TAG and increased HDL-cholesterol when compared with placebo, suggesting that RS II is effective as an adjunct therapy in diabetes( Reference Gargari, Namazi and Khalili 33 ). In addition, RS II may improve glycaemic status, endotoxemia and oxidative stress markers in patients with type 2 diabetes( Reference Karimi, Farhangi and Sarmadi 34 ).
The mean decrease in HbA1c in our results was 0·3 %, similar to the decrease reported in other studies( Reference Mesa García, García-Rodríguez and Rico 32 , Reference Gargari, Namazi and Khalili 33 ). In our study, these effects were observed without any change in the anti-diabetic medication. In addition, this is the longest clinical trial evaluating the effects of RS in patients with pre-diabetes and diabetes. Recently, the results of a randomised clinical trial evaluating the 12-week effect of RS in subjects with pre-diabetes were published( Reference Peterson, Beyl and Marlatt 35 ). Compared with controls, RS II did not significantly improve the glycaemic level and other CVD risk factors in pre-diabetes. These authors showed a reduction (0·1 ± 0·2 %) in HbA1c, with no effect on insulin secretion, insulin sensitivity and the area under the glucose or insulin curves compared with the baseline. The ectopic fat, energy expenditure and other cardiovascular risk factors were unaffected. In our randomised trial, the sample population was larger, and the duration of treatment was longer than in previous studies, and both glucose metabolism and body composition were improved. Our study tested RS from banana biomass in humans.
The effects of acute ingestion of native banana starch on the glycaemic response were assessed by continuous glucose monitoring of obese and lean subjects. The native banana starch reduced the 48-h glycaemia in lean and obese groups separately as well as in a combined group as compared with digestible maize starch. The native banana starch also reduced the postprandial glucose and insulin responses after a meal tolerance test( Reference Jiménez-Domínguez, Ble-Castillo and Aparicio-Trápala 36 ).
A simple method for preparation of modified starches from banana (Musa AAB) and their biological activities were tested in diabetic rats( Reference Reddy, Suriya and Vidya 37 ). The modified starches exhibited beneficial effects in diabetic rats fed a high-fat diet. The RS III was effective in regulating serum glucose and lipid profile and suppressing the oxidative stress.
Prevention of diabetes complications is an important application of RS. The potential implications of dietary RS for glucose homeostasis and kidney health have been assessed in obesity-associated diabetes, examining the mechanisms underlying the protective effect of RS.
Replacing simple carbohydrates by RS could be an effective dietary strategy to prevent hyperglycaemia secondary complications( Reference Koh and Rowling 38 ).
Our study is in line with the beneficial effects of RS reported in both animal and human studies. Short-term clinical trials provide evidence that different sources of RS can improve glucose metabolism and anthropometric parameters and delay diabetes onset and complications. In view of our results and considering the long duration of our study and its large sample size as compared with previous studies, RS from green banana biomass seems an attractive and inexpensive option for subjects with pre-diabetes or diabetes.
Study limitations and potential bias
Both diet interventions were not only effective but closely monitored and may have reduced the impact of the active treatment.
In conclusion, these results are promising and encourage the use of new bioactive starches with potential clinical applications to improve glucose metabolism and body composition in subjects with pre-diabetes and diabetes.
Acknowledgements
E. S. C. participated in the study design, performed data collection, participated in data analyses and interpretation and drafted and approved the final version of the manuscript.
J. T. K., H. T. B. and T. T. F. performed data collection, participated in data analyses and interpretation and revised and approved the final version of the manuscript.
H. A. F. and A. M. F. N. participated in data interpretation and revised and approved the final version of the manuscript.
C. N. F., F. A. F. and M. C. I. participated in the study conception and design, participated in data analysis and interpretation, and drafted, revised and approved the final version of the manuscript.
This study was funded by the National Institute of Science and Technology of Complex Fluids (INCT-FCx) and the Sao Paulo Research Foundation (FAPESP), research grant no. 2008/57685-7. E. S. C. received a research grant from the Coordination for the Improvement of Higher Education Personnel (CAPES). The green banana biomass was a gift from Essência do Vale Alimentos (Cruzeiro, SP, Brazil), which did not influence our results.
There were no conflicts of interest.
Supplementary material
For supplementary material/s referred to in this article, please visit https://doi.org/10.1017/S0007114519000576


