Chronic kidney disease (CKD) is a major worldwide public health problem, with an estimated 38 million people over age 30 years are likely to develop CKD by 2030( Reference Hoerger, Simpson and Yarnoff 1 ). Deficiency of nutritional 25-hydroxyvitamin D (25(OH)D) is highly prevalent in patients with CKD and is a key feature of the chronic kidney disease mineral and bone disorder( Reference Moe, Drueke and Cunningham 2 , 3 ). Although the mechanisms responsible for widespread 25(OH)D deficiency are not fully defined, data suggest a strong inverse association between 25(OH)D concentrations and mortality in this population( Reference Navaneethan, Schold and Arrigain 4 – Reference Ravani, Malberti and Tripepi 7 ). As such, CKD patients constitute a critical population in which to test the efficacy of therapies designed to replete 25(OH)D concentrations.
Two forms of nutritional vitamin D currently exist for the correction of 25(OH)D deficiency, ergocalciferol (D2), a plant-based sterol, and cholecalciferol (D3), an animal-based sterol. Traditionally, these therapies were thought to possess similar efficacy for 25(OH)D repletion, but more recent evidence may refute this notion( Reference Heaney, Recker and Grote 8 – Reference Glendenning, Chew and Inderjeeth 14 ). The recommendations of the international Kidney Disease: Improving Global Outcomes organisation do not specify which of these agents is more effective for 25(OH)D repletion( 3 ). In contrast, the traditional therapy recommended by the Kidney Disease Outcomes and Quality Initiative organisation, which produces clinical practice guidelines for care in the USA, is ergocalciferol( Reference National Kidney Foundation 15 ). Evidence from our group and others, however, suggests that ergocalciferol is poorly effective for correcting 25(OH)D deficiency in CKD( Reference Mangoo-Karim, Da Silva Abreu and Yanev 13 , Reference Qunibi, Abdellatif and Sankar 16 ).
As discussed at length in a recent review article( Reference Kramer, Berns and Choi 17 ), considerable controversy still exists regarding supplementation strategies for the correction of nutritional vitamin D deficiency in patients with CKD, even after years of investigation. To date, there have been no well-designed trials conducted to test the relative efficacy of various nutritional vitamin D formulations in CKD patients, a population exhibiting unique mineral metabolism physiology. To address this knowledge gap( Reference Levey, Eckardt and Tsukamoto 18 ), we conducted a randomised clinical trial of cholecalciferol v. ergocalciferol for 25(OH)D repletion of nutritional vitamin D insufficiency in non-dialysis-dependent stage 3–5 CKD patients.
Methods
Study participants
Participants were recruited from the University of Kansas Medical Center (KUMC) outpatient nephrology clinics. Inclusion criteria included estimated glomerular filtration rate (eGFR) <60 ml/min per 1·73 m2, as calculated by the MDRD formula( Reference Levey, Coresh and Greene 19 ), and serum concentrations of 25(OH)D<30 ng/ml. Exclusion criteria included dialysis dependence, presence of gastrointestinal disorders (short bowel syndrome, abnormal bowel structure secondary to surgical manipulation, inflammatory bowel disease, coeliac disease, disorders of fat absorption or chronic diarrhoea), liver cirrhosis, chronic inflammatory disease (e.g. systemic lupus erythematosis, rheumatoid arthritis), previous organ transplantation, use of immunosuppressants or bile acid sequestrants, presence of chronic infection, substance abuse, heavy proteinuria (≥3000 mg/24 h), treatment with calcitriol or vitamin D receptor agonists, or current nutritional vitamin D therapy of ≥75 μg (3000 IU) daily.
Study design
This was a randomised, two-arm, parallel clinical trial. The investigators were blinded to treatment assignment. Participants were not informed as to what arm they were assigned to, but strict participant blinding was not possible as study drugs were not compounded into identical-appearing formulations. The study was conducted according to the guidelines laid down in the Declarations of Helsinki, and all procedures involving human participants were approved by the Human Subjects Committee (institutional review board) at KUMC. Written informed consent was obtained from all participants. The study was registered with clinicaltrials.gov (https://clinicaltrials.gov) as study number NCT01835691.
The primary end point was the change in 25(OH)D between treatment arms following 12 weeks of treatment. Other end points included change in 25(OH)D from baseline to week 18 (6 weeks after therapy), between-group comparisons of absolute 25(OH)D concentrations at individual time points, and changes in parathyroid hormone (PTH), 1,25-dihydroxyvitamin D (1,25(OH)2D), and the D2 and D3 sub-fractions of both 25(OH)D and 1,25(OH)2D.
Fig. 1 outlines the study design implemented for this investigation. All participants were randomised in a 1:1 ratio by random drawing to receive either oral cholecalciferol (Bio-Tech Pharmacal) at a dose of 1250μg (50 000 IU) once weekly or ergocalciferol (Sanofi-Aventis) 1250μg (50 000 IU) once weekly for 12 weeks. Given our experience with the generally suboptimal performance of ergocalciferol in this setting( Reference Mangoo-Karim, Da Silva Abreu and Yanev 13 , Reference Sanchez, Mangoo-Karim and Stubbs 20 ) and to maximise the potential that ergocalciferol would successfully replete 25(OH)D levels, we elected to administer the drug at dose of 1250μg (50 000 IU)/week in the closely monitored setting of a clinical trial. The decision to administer 1250μg (50 000 IU) of cholecalciferol weekly was made because of a desire to compare equal-unit doses of the two compounds. This choice was driven in part by Endocrine Society guidelines, which do not distinguish between compounds when making dose recommendations for repletion of 25(OH)D deficiency( Reference Holick, Binkley and Bischoff-Ferrari 21 ). Randomisation occurred via drawing lots, distributed equally between two colours, from an opaque container; participants therefore had an equal chance of randomisation to either arm. The association between the colour drawn and the treatment assigned was unknown to both the participants and the investigators; for safety reasons, the research nurse coordinator (alone) was aware of treatment assignment. Patients taking low-dose vitamin D supplements at the time of enrolment were instructed to cease taking any supplementation except for that provided by the trial. Investigators remained blinded to study group assignment throughout the entire course of the study. Following discontinuation of the study drug, study participants were followed-up for an additional 6 weeks to obtain post-treatment 25(OH)D concentrations in steady state. Blood samples were collected at baseline (immediately pre-treatment), week 6 (mid-treatment), week 12 (immediately upon cessation of treatment) and week 18 (6 weeks after therapy). For safety purposes, patients achieving a total 25(OH)D concentration>80 ng/ml at 6 weeks discontinued therapy, but remained in the study to complete all remaining study visits.
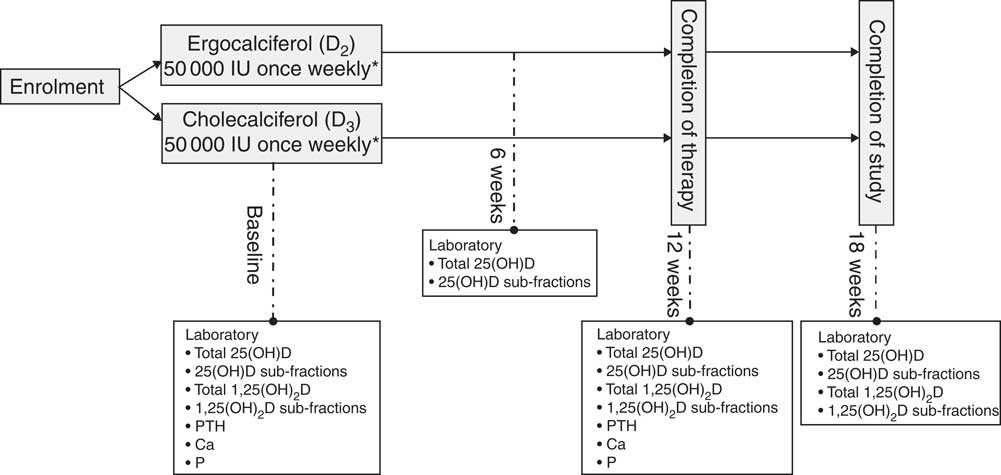
Fig. 1 Study design. 25(OH)D, 25-Hydroxyvitamin D; 1,25(OH)2D, 1,25-dihydroxyvitamin D; PTH, parathyroid hormone. *1250μg once weekly.
Laboratory analyses
Serum Ca and P were measured using a spectrophotometric method and intact PTH using an immunoassay by Quest Diagnostics. Serum concentrations of total 25(OH)D, 1,25(OH)2D, and their D2 and D3 sub-fractions were quantitated using ultra-HPLC-tandem MS (UHPLC-MS/MS) by Quest Diagnostics. All serum measurements were performed at the time of each blood draw.
Statistical analysis
Target sample size was based on the expected difference in the proportion of participants in each group to achieve a 25(OH)D level>30 ng/ml. We anticipated 40 % in the ergocalciferol group would become replete v. 85 % in the cholecalciferol group. On the basis of this, power calculations for Fisher’s exact test indicated that this study would have approximately 87 % power to detect such differences with twenty-five participants per treatment arm (nQuery Advisor, 1995–2007). We increased the target sample size to thirty per treatment to account for attrition; however, enrolment was discontinued after randomisation of forty-four participants because of funding and logistical reasons.
Descriptive statistics were generated to compare the treatment groups using screening and baseline assessments. Comparisons of categorical measures between groups used Pearson’s χ 2 statistic; a non-parametric exact test was substituted for expected cell counts <5. Continuous measures were compared using the two-sample t test. Assumptions for this test were examined using residual analysis, and when assumptions were violated the non-parametric Wilcoxon’s ranked-sum test was used. For PTH, relative changes from baseline were also generated and tested, as a sensitivity analysis, and then compared by the two-sample t test. Linear mixed models were utilised to compare treatment arms for the continuous measures collected over time. Residuals were assessed to evaluate each model’s fit to underlying assumptions. When model assumptions were violated, linear mixed models were generated on rank data rather than original measures. Linear contrasts from these models were used to test for between-group differences in changes from baseline to 12- and 18-week follow-up among measures. P<0·05 was considered statistically significant.
Measures of 25(OH)D and 1,25(OH)D below the detection threshold of the assay were assigned the imputed values at this detection limit. In addition, to assess the sensitivity of our findings, we conducted per protocol analyses that replaced the 12- and 18-week measures with their 6- and 12-week measures for the two participants who exceeded our pre-specified 25(OH)D threshold to remain on active treatment after week 6. This alternative method of analysis did not alter our final results.
Results
Fig. 2 summarises study participant enrolment, randomisation and disposition throughout the trial; fifty-five patients exhibiting vitamin D insufficiency by routine outpatient clinical laboratory values were consented for participation between January 2012 and September 2014. After baseline testing to confirm 25(OH)D insufficiency by the UHPLC-MS/MS method, the 25(OH)D concentrations on nine patients no longer met our inclusion criteria, and therefore were excluded. An additional two patients withdrew consent. A total of forty-four patients satisfied all inclusion/exclusion criteria and were ultimately randomised to a treatment arm.
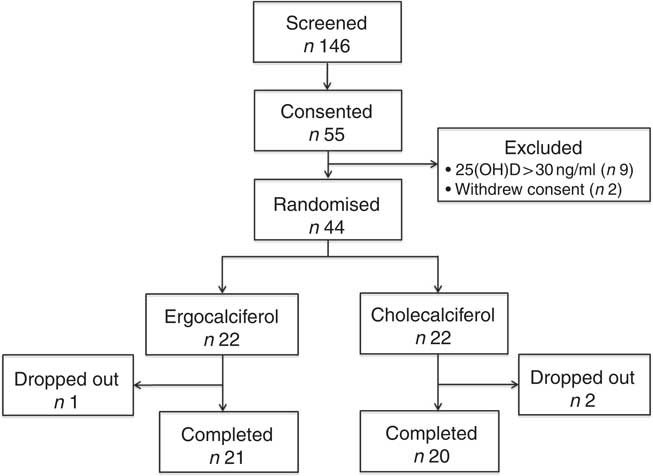
Fig. 2 Trial enrolment, randomisation and disposition.
Following study initiation, two participants from the cholecalciferol arm dropped out before completion of the study drug course (both due to acute illnesses unrelated to therapy), and one participant in the ergocalciferol arm was lost to follow-up before 12 weeks. A total of twenty and twenty-one participants ultimately completed 12 weeks of cholecalciferol and ergocalciferol therapy, respectively; two participants in the cholecalciferol arm and no participants in the ergocalciferol arm achieved 25(OH)D concentrations>80 ng/ml at the mid-treatment (week 6) blood draw, and therapy was discontinued at this time; however, these participants remained in the study for the final two study visits. Between the 12- and 18-week time points (after cessation of therapy), four participants in the cholecalciferol arm dropped out (one was lost to follow-up and three were hospitalised for unrelated illnesses), whereas one participant in the ergocalciferol arm dropped out at this time point because of dialysis initiation.
Table 1 lists the baseline demographic characteristics for each treatment group. We observed relatively equal between-group distributions for age, sex, race, BMI, presence of diabetes and aetiology of CKD. Likewise, comparison of between-group differences in baseline laboratory parameters revealed similar distributions of baseline measurements for vitamin D metabolites, Ca and P. Baseline serum 25(OH)D concentrations were no different at 20·5 (sd 5·5) and 20·9 (sd 6·3) ng/ml in the ergocalciferol- and cholecalciferol-treated groups, respectively. The cholecalciferol group did exhibit slightly higher baseline values for eGFR (42·5 (sd 9·6) v. 37·5 (sd 11·2) ml/min per 1·73 m2 for the ergocalciferol group) and fewer patients exhibited at least moderate proteinuria (10·0 % of patients with moderate proteinuria v. 23·8 % of patients in the ergocalciferol group); however, these differences were not statistically significant. The ergocalciferol group had a higher mean baseline PTH concentration v. the cholecalciferol group (149·0 (sd 194·8) v. 76·6 (sd 58·3) pg/ml, respectively, P=0·02).
Table 1 Participant characteristicsFootnote * (Mean values and standard deviations; number of subjects and percentages)
CKD, chronic kidney disease; PKD, polycystic kidney disease; eGFR, estimated glomerular filtration rate; PTH, parathyroid hormone; 25(OH)D, 25-hydroxyvitamin D; 1,25 (OH)2D, 1,25-dihydroxyvitamin D.
* Proteinuria definition: none=urine protein:creatinine ratio≤0·3 or negative urinalysis; mild=urine protein/creatinine between 0·3 and 1·0 or urine dipstick of trace to 1+; moderate=urine protein:creatinine ratio≥1·0 or urine dipstick >1+.
† Indicates non-parametric testing used.
‡ Assumed unequal variances.
Serum mineral metabolism parameters
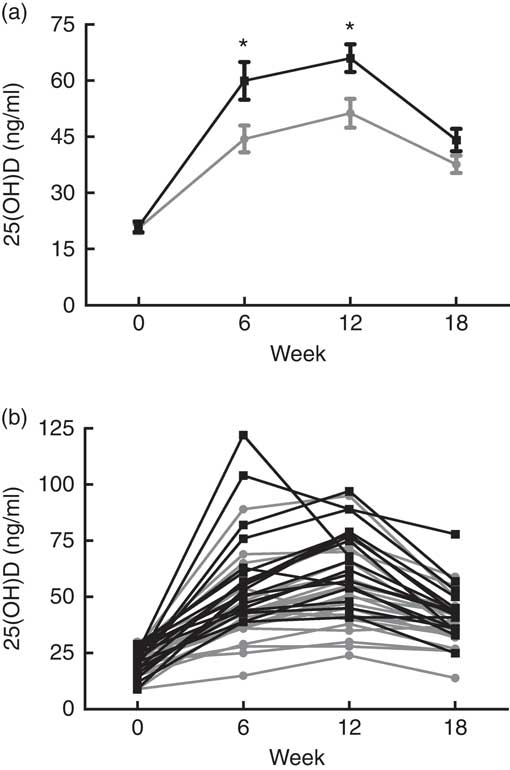
Table 2 illustrates the change in vitamin D metabolites (both total and D2/D3 sub-fractions) and mineral metabolism parameters during the study period estimated from linear mixed models. We observed a greater change in total 25(OH)D in the cholecalciferol group from baseline to week 12 (mean change 45·0 (sd 16·5) v. 30·7 (sd 15·3) ng/ml; P<0·01). However, total 25(OH)D changes appeared similar between these two groups when comparing the change from baseline to 18 weeks (mean change 22·4 (sd 12·7) ng/ml for cholecalciferol v. 17·6 (sd 8·9) ng/ml for ergocalciferol; P=0·17). To provide insight into the relative performance of the competing treatments over the course of the study, Fig. 3 illustrates both mean serum 25(OH)D concentrations organised by the study group (Fig. 3(a)) and individual serum 25(OH)D concentrations organised by study participant (Fig. 3(b)).

Fig. 3 Serum concentrations of 25-hydroxyvitamin D (25(OH)D), grouped by treatment assignment, over the 18-week study course. (a) Mean 25(OH)D values per study group at each time point. (b) Individual 25(OH)D values for each patient at each time point. * Comparisons between treatment arms at specified time points (*P<0·01). ![]() , Ergocalciferol;
, Ergocalciferol; ![]() , cholecalciferol.
, cholecalciferol.
Table 2 Change in vitamin D metabolites and related markers of mineral metabolism (Mean values and standard deviations)
PTH, parathyroid hormone; 25(OH)D, 25-hydroxyvitamin D; 1,25(OH)2D, 1,25-dihydroxyvitamin D.
* For the comparison between baseline and 18 weeks of the noted parameter, sample sizes were sixteen for the cholecalciferol group and twenty for the ergocalciferol group.
† P<0·01 for between-group differences at the noted time interval from the linear mixed model.
‡ P<0·001 for between- group differences at the noted time interval from the linear mixed model.
§ For comparison between baseline and 18 weeks of the noted parameter, sample sizes were sixteen for the cholecalciferol group and nineteen for the ergocalciferol group.
|| Linear mixed model of ranks used for analysis because of violations in normality assumptions for linear mixed model of raw (unranked) measures resulted in P=0·14; however, using relative change from baseline due to the high difference in baseline PTH between groups, this comparison becomes significant (P=0·02).
There were no between-group differences for the change in total 1,25(OH)2D, Ca or P. None of the participants in either arm developed hypercalcaemia. Participants in the cholecalciferol group did appear to have a greater mean reduction in serum PTH in response to therapy compared with ergocalciferol-treated participants (change, −15·3 (sd 34·5) pg/ml for cholecalciferol v. 2·3 (sd 38·3) pg/ml for ergocalciferol; P=0·14 using rank-based linear mixed model; a sensitivity analysis using relative change from baseline, conducted because of the high difference in baseline PTH levels between groups, demonstrated statistical significance at P=0·02).
Impact of ergocalciferol and cholecalciferol sub-fraction changes on repletion of total 25-hydroxyvitamin D
In addition, we assessed the change in D2 and D3 sub-fractions of 25(OH)D over the study period (Table 2). Although participants treated with ergocalciferol exhibited a rise in 25(OH)D2 by 12 weeks (39·8 (sd 16·0) ng/ml), this increase was accompanied by a substantial reduction in 25(OH)D3 concentrations (−11·9 (sd 4·8) ng/ml), which likely contributed to a less robust increase in total 25(OH)D values with ergocalciferol supplementation. In contrast, the participants treated with cholecalciferol demonstrated an expected rise in 25(OH)D3, but only a trivial reduction in 25(OH)D2. Likewise, a similar pattern was observed in the D2 and D3 sub-fraction changes for 1,25(OH)2D, with the ergocalciferol group exhibiting a significant decline in 1,25(OH)2D3 by 12 weeks (−17·7 (sd 9·7) pg/ml), whereas the cholecalciferol group showed only a minor comparable reduction in 1,25(OH)2D3 (−2·6 (sd 7·8) pg/ml). Similar patterns were observed in the data from 18 weeks for both the 25(OH)D and 1,25(OH)2D sub-fractions. Sensitivity analyses using both the rank-based and the per-protocol approaches described above resulted in comparable findings (data not shown).
Discussion
Nutritional vitamin D deficiency is commonly observed in patients with impaired kidney function, a group that exhibits distinctive derangements in mineral metabolism that contribute to a spectrum of bone and cardiovascular pathologies( Reference Moe, Drueke and Cunningham 2 , Reference Stubbs, Zhang and Friedman 22 ). Despite evidence in the general population that cholecalciferol may be superior to ergocalciferol for 25(OH)D repletion( Reference Qunibi, Abdellatif and Sankar 16 , Reference Tripkovic, Lambert and Hart 23 , Reference Lehmann, Hirche and Stangl 24 ), traditional US guidelines for the treatment of 25(OH)D deficiency in individuals with CKD suggest the use of an ergocalciferol-based regimen( Reference National Kidney Foundation 15 ), although international guidelines provide no specific recommendations as to which agent is preferred( 3 ). Accumulating data imply that ergocalciferol therapy is often ineffective in raising 25(OH)D concentrations into the optimal range in CKD patients( Reference Mangoo-Karim, Da Silva Abreu and Yanev 13 , Reference Qunibi, Abdellatif and Sankar 16 ). Despite this evidence, no well-designed trials have compared ergocalciferol and cholecalciferol therapy for 25(OH)D repletion in this unique patient population( Reference Kramer, Berns and Choi 17 ).
To address this knowledge gap, we performed a randomised, two-arm, parallel clinical trial comparing the relative efficacy of ergocalciferol and cholecalciferol for 25(OH)D repletion in a non-dialysis-dependent stage 3–5 CKD population exhibiting vitamin D insufficiency. Consistent with previous observations in the general population( Reference Tripkovic, Lambert and Hart 23 , Reference Lehmann, Hirche and Stangl 24 ), we found that cholecalciferol generated a greater initial increase in total serum 25(OH)D compared with ergocalciferol over a 12-week course of therapy (Table 2). Furthermore, examination of individual participant responses demonstrated that nearly all the individuals exhibiting a pronounced rise in 25(OH)D were in the cholecalciferol group, whereas nearly all of the poor responders (e.g. those not attaining 30 ng/ml) were in the ergocalciferol group (Fig. 3(b)). These results suggest that cholecalciferol is likely to be substantially more effective than ergocalciferol for initial treatment of nutritional vitamin D insufficiency in CKD patients. This apparent superiority of cholecalciferol, however, was transient. Following the discontinuation of therapy, 25(OH)D concentrations dramatically declined in the cholecalciferol group, with the result being only a slightly higher (approximately 6 ng/ml) mean 25(OH)D concentration in the cholecalciferol arm 6 weeks after treatment. This suggests that aggressive maintenance therapy may be necessary to capitalise on any initial advantage conferred by cholecalciferol.
There has been a long-standing debate regarding the relative efficacy of these two therapies for 25(OH)D repletion in the general population, with several studies concluding cholecalciferol to be superior and others observing no apparent difference. In 2012, Tripkovic et al.( Reference Tripkovic, Lambert and Hart 23 ) performed a systematic review of the published literature comparing ergocalciferol with cholecalciferol in the general population. The authors summarised findings from seven studies that incorporated prospective, parallel study designs to directly assess the relative efficacy of these therapies. Of the seven existing studies, five concluded cholecalciferol to be significantly more effective than ergocalciferol, and two observed no difference. In a more recent trial by Lehmann et al.( Reference Lehmann, Hirche and Stangl 24 ), in which 107 healthy volunteers were randomised to ergocalciferol, cholecalciferol or placebo therapy, cholecalciferol was superior to ergocalciferol for repletion of 25(OH)D at 4 and 8 weeks of therapy with 50μg (2000IU) daily dosing. In a smaller study by Biancuzzo et al.( Reference Biancuzzo, Clarke and Reitz 25 ), investigators performed a sub-analysis of patients receiving ergocalciferol, cholecalciferol or placebo as part of a parent study examining the effects of orange juice fortification with vitamin D v. capsule supplementation alone. This smaller investigation observed similar efficacy of these two therapies in raising 25(OH)D concentrations after 11 weeks of 25μg (1000 IU) daily dosing.
The discordance of the highlighted studies may be partially explained by the variability in vitamin D dosing. As such, it is noteworthy that ergocalciferol and cholecalciferol were administered at substantially lower doses (25μg (1000 IU) daily) in all of the studies that reported similar efficacy of the two compounds, findings that may be the result of insufficient statistical power. In contrast, all investigations concluding cholecalciferol to be superior incorporated a more aggressive dosing strategy (1250-1500μg (50 000–60 000 IU) monthly), suggesting that the relative superiority of cholecalciferol may become apparent only at higher doses. In addition, it is also conceivable that the timing of serum sampling for 25(OH)D measurements in relation to treatment administration could have impacted outcomes of interest. In our CKD cohort, total 25(OH)D concentrations demonstrated a fairly dramatic decline in the cholecalciferol group following discontinuation of therapy. By contrast, a previous study by Armas et al.( Reference Armas, Hollis and Heaney 9 ) conducted in healthy volunteers found that a single oral dose 1250μg (50 000 IU) of cholecalciferol had a more sustained effect on total serum 25(OH)D concentrations over a 4-week period compared with ergocalciferol. It is therefore unclear whether this is a phenomenon specific to patients with CKD, a group known to exhibit unique alterations to pathways regulating vitamin D metabolism( Reference Stubbs, Zhang and Friedman 22 ). Furthermore, previous evidence suggests that the 25(OH)D3 sub-fraction may have a higher affinity for vitamin D-binding protein, perhaps reflecting a greater stability of D3 metabolites in the peripheral circulation( Reference Hollis 26 ). Taken as a whole, these previous observations have led some to propose that cholecalciferol is likely to have substantially greater potency for the repletion of 25(OH)D in the general population.
It is notable that a consistent observation of several previous investigations was a marked decline in the 25(OH)D3 sub-fraction in participants treated with ergocalciferol( Reference Armas, Hollis and Heaney 9 , Reference Lehmann, Hirche and Stangl 24 , Reference Tjellesen, Hummer and Christiansen 27 ), a finding similar to that of our CKD cohort. At baseline, 25(OH)D was comprised almost exclusively of the 25(OH)D3 sub-fraction, with very low to undetectable levels of 25(OH)D2 in most participants. The observed decline in the 25(OH)D3 sub-fraction with ergocalciferol therapy would result in a less robust increase in total 25(OH)D, unless this was offset by a dramatic rise in the 25(OH)D2 sub-fraction. That the cholecalciferol-treated participants did not experience an analogous decrease in the 25(OH)D2 sub-fraction may explain why cholecalciferol was more effective than ergocalciferol. Therefore, the superiority of cholecalciferol in raising total 25(OH)D concentrations may be a result of both cholecalciferol’s greater effectiveness for increasing 25(OH)D3 (compared with the effectiveness of ergocalciferol in raising its respective D2 sub-fraction) as well as its less-pronounced effect in lowering 25(OH)D2 (compared with the reduction of 25(OH)D3 by ergocalciferol).
This investigation has both important strengths and limitations. The strengths of this study include (1) a randomised study design with parallel participant enrolment and investigator blinding, (2) use of the gold standard assay for quantification of both total 25(OH)D and 25(OH)D sub-fractions, (3) a roughly equal distribution of important demographic characteristics such as BMI, race and baseline 25(OH)D between study arms and (4) an evaluation of the duration of 25(OH)D changes following discontinuation of therapy. There are important limitations of this investigation, however: (1) although the investigators were blinded to treatment assignment and the participants were not told of their respective assignment, the physical appearance of the pills was not identical, meaning that it is possible that participants might have ascertained their treatment assignments; (2) there was no placebo arm nor was there an arm testing lower daily doses of these formulations (e.g. 50–75μg (2000–3000 IU)/d, such as is often administered in clinical practice); (3) the trial was underpowered given difficulties with recruitment, which may have impacted the quality of randomisation; this is evident by the slightly lower eGFR and higher proteinuria burden and PTH levels in the ergocalciferol arm; and (4) as we recruited only stage 3–5 CKD patients, our findings may not be applicable to patients with lesser degrees of CKD or those requiring dialysis.
The present investigation is notable as the first randomised clinical trial to compare the efficacy of ergocalciferol v. cholecalciferol with regard to 25(OH)D repletion in a CKD population. With this investigation, we observed cholecalciferol to be superior for raising total serum 25(OH)D concentrations during active therapy; yet, this superiority was lost following cessation of therapy when patients reached steady state. This suggests that cholecalciferol may be more effective than ergocalciferol in raising 25(OH)D levels when given in equal-unit doses, but that maintenance therapy is likely required to sustain these levels in the goal range. Our study cannot rule out the possibility that higher doses of ergocalciferol could be as effective as 1250μg (50 000IU) of cholecalciferol weekly when given for initial repletion. Taken together, observations from this study highlight two important points that should be considered for future guideline formation for 25(OH)D repletion in CKD patients: (1) cholecalciferol may be superior to ergocalciferol in raising 25(OH)D concentrations with initial therapy, and (2) there is a need for vitamin D maintenance therapy in CKD patients following discontinuation of the initial repletion dosing.
Acknowledgements
The authors gratefully acknowledge Cathy Creed for her dedication to this study.
This work was supported by a Clinical Pilot Grant (to J. B. W. and J. R. S.) from Frontiers: The Heartland Institute for Clinical and Translational Research (NCATS; grant no. UL1TR000001).
The author’s contributions are as follows: J. B. W., J. D. M. and J. R. S. designed the study; J. B. W., J. R. S. and C. K. conducted the study; J. B. W., C. K., J. D. M. and J. R. S. performed data analysis; J. B. W., C. K., J. D. M. and J. R. S. wrote the manuscript; J. B. W. and J. R. S. had primary responsibility for the final content. All the authors read and approved the final version of the manuscript.
The authors have no financial or personal conflicts to declare.