


The parameters that have been traditionally measured in the study of body composition are body weight, BMI and other indirect measurements of body fat distribution and abdominal obesity, such as waist perimeter and the waist height and waist hips indices(Reference Flegal, Kit and Orpana1). More recently, the proliferation and validation of different impedancemetry devices(Reference Karelis, Chamberland and Aubertin-Leheudre2) have allowed evaluating the composition and distribution of body fat and relating body fat mass and lean mass to mortality. In this sense, the review conducted by Lee et al.(Reference Lee and Giovannucci3) in 2018 suggests that an increase in the content of fat mass and/or a decrease in lean mass could be associated with an increase in mortality.
During menopause, women undergo a series of physiological changes that include an increase in the levels of total cholesterol and LDL-cholesterol, with the consequent increase in cardiovascular risk(Reference Agrinier, Cournot and Dallongeville4). The increase of age is also associated with a redistribution of fat tissue, with an increment in central localisation, which favours greater abdominal obesity and, ultimately, greater frequency of metabolic complications(Reference JafariNasabian, Inglis and Reilly5).
Among the interventions that assess the changes in body composition, some have shown beneficial results in body distribution and composition in postmenopausal women using isolated physical activity programmes(Reference Friedenreich, Neilson and O’Reilly6,Reference Irwin, Yasui and Ulrich7) . Other interventions, such as the one designed by Seimon et al.(Reference Seimon, Wild-Taylor and Keating8), combine physical activity with energy restriction and with a slight increase of protein intake, obtaining improvements in body weight and fat mass. This moderate increase in the intake of proteins has also been reported by other authors as a possible cause of body fat percentage decrease(Reference Nabuco, Tomeleri and Junior9). The modification of the amounts of macronutrients in the habitual diet was pointed out in the Women’s Health Initiative Dietary Modification Trial(Reference Carty, Kooperberg and Neuhouser10), where the group of postmenopausal women assigned to an intervention based on lower fat intake (<20 % energy) obtained a decrease in body fat percentage and body fat mass after 1 year of follow-up.
However, the effect of polyphenols on the modification of body composition in postmenopausal women is still unclear. In the trial carried out by Choquette et al.(Reference Choquette, Riesco and Cormier11), the addition of 70 mg/d of isoflavones to the habitual diet of the participants caused a reduction in leg fat percentage, although there were no changes for this parameter in other body parts or in the body as a whole. A daily supplement in the form of a chocolate snack(Reference Piehowski, Preston and Miller12) has been reported to decrease both body fat mass and percentage in overweight/obese premenopausal women. However, this study combined the supplement with energy restriction, thereby the isolated effect of the supplement could not be determined.
The aim of the present study was to analyse the effect of the daily addition of 10 g of chocolate with a high concentration of cocoa (99 %) to the habitual diet, for 6 months, on the body composition of postmenopausal women.
Methods
Design and setting
Controlled randomised trial with two parallel groups. The sample recruitment and the evaluation visits were conducted between June 2018 and August 2019. This clinical trial was registered in ClinicalTrials.gov (NCT03492983), and its protocol has been published(Reference Garcia-Yu, Garcia-Ortiz and Gomez-Marcos13). This manuscript includes results on body composition as a secondary outcome from the intervention study. Results on blood pressure, as the main outcome of the trial, have been previously published(Reference Garcia-Yu, Garcia-Ortiz and Gomez-Marcos14).
Study participants and recruitment
The sample recruitment was carried out in the doctor’s offices of four urban primary healthcare centres of Salamanca, Spain, through a consecutive sampling of women who met the inclusion criteria. The evaluations were performed in the Primary Care Research Service of Salamanca, which is part of the Spanish Research Network for Preventive Activities and Health Promotion in Primary Care and of the Biomedical Research Institute of Salamanca. The study included 140 women aged between 50 and 64 years and in the period of postmenopause, defined as amenorrhoea for at least twelve consecutive months. Potential participants were excluded based on the following criteria: personal history of CVD; personal history of diabetes mellitus, high blood pressure or dyslipidaemia under pharmacological treatment; hypoenergetic diets; clinically proven neurological and/or neuropsychological disease; treatment with hormone replacement therapy; habitual weekly consumption of over 210 g of cocoa; cocoa intolerance and/or allergy; intolerance and/or allergy to any of the compounds of the study supplement.
The final sample consisted of 132 women. The evaluation of body composition through impedancemetry was not performed in the eight women who were excluded from the analysis, since they met some of the circumstances described by the manufacturer of the measuring device, which advised against the realisation of such procedure in them. These situations include people with pacemakers or any other electronic medical device in their bodies; people who could have difficulties in the analysis, such as being under 110 cm in height; people with limb amputations or people carrying metal prostheses.
Sample size
The sample size was estimated based on the estimated changes in the main outcome of this trial, that is, systolic blood pressure (SBP). To detect a minimum difference of 2·9 mmHg in SBP between the two groups, 140 participants (seventy per group) were needed, considering given α- and β-risks of 0·05 and 0·20, respectively, in bilateral contrast and a standard deviation (SD) of 5·8 mmHg and assuming a predicted drop-out rate of 10 % during follow-up. This estimate considered the results obtained in a similar study in which a decrease in SBP of 6·5 (sd 5·8) mmHg was observed(Reference Grassi, Desideri and Necozione15). This estimate powers to detect a difference of 0·8 % or higher in body fat percentage as statistically significant (P < 0·05).
Procedures and randomisation
All participants had a baseline assessment and a follow-up evaluation 6 months after the former, in which the study variables were measured (Fig. 1). The intervention group (IG) also conducted five chocolate re-supply visits at 1, 2, 3, 4 and 5 months after the baseline evaluation. No procedures were performed in these visits other than the provision of the necessary chocolate until the next visit and the collection of a calendar with the record of the chocolate intakes of the participants.
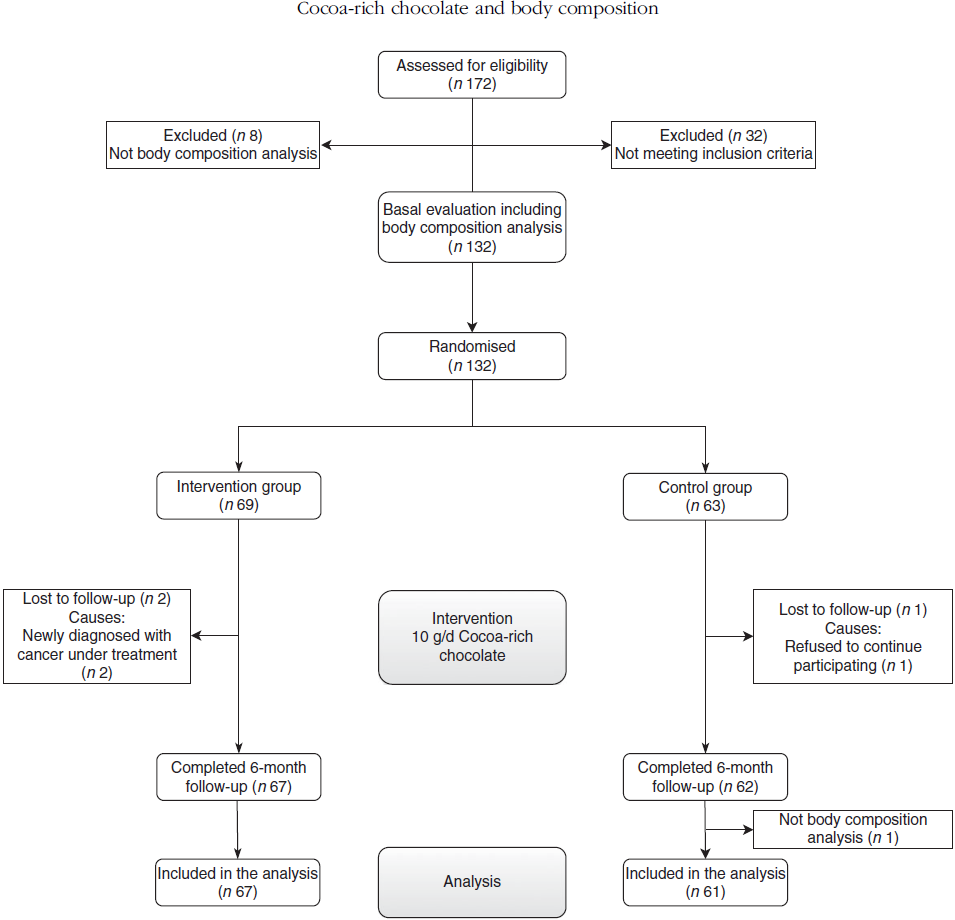
Fig. 1. Flow chart of the analysis of body composition of the participants.
The postmenopausal women were randomly assigned to two groups: an IG and a control group (CG). The assignation sequence was generated by an independent researcher using the Epidat 4.2 software(16). The participants received their randomisation number based on the order of their baseline evaluation visit; such number remained hidden until they were assigned to each group. To ensure that the blinding was maintained, the participants were given clear instructions not to disclose which treatment they had been randomised to while being interviewed by the blind assessors. The information about treatment allocation was stored in a secure locker in case of emergency unblinding.
Due to the characteristics of the intervention, it was not possible to blind the participants. To minimise contamination between groups, the researcher who conducted the evaluations was different from the one who re-supplied the chocolate to the IG.
Intervention
The participants of the CG did not receive any type of intervention. Those of the IG were provided with chocolate (99 % cocoa) and the instructions for the daily intake of 10 g of this supplement in addition to their habitual diet for 6 months. In the first re-supply visit, they were instructed in how to consume and store the chocolate, recommending that the daily intake should be at the same time of the day. Moreover, a calendar was given to each participant, in which they were asked to record the time and date of each intake; these calendars were given back to the researchers in each re-supply visit.
The daily nutritional intake of 10 g of this chocolate is 247 kJ (59 kcal), 0·8 g of carbohydrates, 1·5 g of protein and 5·1 g of fat, of which 3·1 g are saturated fat. The intake of polyphenols per 10 g of this product is 65·4 mg. The polyphenolic profile per 10 g of this compound consists in 26·1 mg epicatechin, 10·4 mg catechin, 0·58 mg protocatechuic acid, 1·76 mg procyanidin dimer (B3), 14·4 mg procyanidin dimer (B2), 8·53 mg procyanidin trimer (C1), 3·54 mg procyanidin A hexoside, 0·02 mg quercetin glucoside and 0·03 mg quercetin arabinoside. The participants of both groups were instructed to follow their usual dietary pattern without modifying their eating habits during the study period.
Main outcomes
Analysis of body composition
The measurements of body composition by impedancemetry were performed using an Inbody 230 multifrequency analyser (Inbody)(Reference Karelis, Chamberland and Aubertin-Leheudre2). This is a segmental impedance device with which ten measurements were performed using two different frequencies (20 and 100 kHz) in each segment (right arm, left arm, trunk, right leg and left leg). The data were calculated by the algorithm of the manufacturer and include fat mass, fat-free mass, skeletal muscle mass, total body water, proteins and minerals. Furthermore, the device calculated the total body weight (kg). To determine the body composition measurements, the recommendations of the manufacturer were followed: the test was conducted before or two hours after a meal; the participants were asked to go to the bathroom before the beginning of the analysis, to avoid biological errors derived from including the weight of urine and/or faeces; they were asked to do no physical exercise before the analysis; they had to stand for 5 min before the analysis, avoiding to lie down and sitting for long periods, since this could induce changes in the results due to the tendency of water to move towards the lower limbs when the person stands up; the analysis was not performed after a shower or sauna session, or during menstruation; lastly, the room was kept at a stable temperature of 20–25°C, maintaining the same conditions in both evaluation sessions.
Body height and BMI
Body height was measured by recording the average of two readings rounded to the nearest centimetre using a stadiometer (Seca 222, Medical Scale and Measurement System). BMI was calculated by dividing weight (kg) by height squared (m2).
Nutritional composition of the habitual diet and consumption of chocolate
The nutritional composition of the habitual diet of the participants was estimated using a 24-h record of three non-consecutive days before each visit, including business and non-business days. The data were processed using the EVIDENT II application(Reference Recio-Rodriguez, Rodriguez-Martin and Gonzalez-Sanchez17), which has been validated for the estimation of energy intake (kcal) and macronutrient intake (carbohydrates, lipids, proteins, cholesterol and fibre). The nutritional intake calculations include the energy intake from the intervention. The consumption of chocolate was evaluated in each visit (baseline and at 6 months) through a series of questions about the amount, type and frequency of consumption in the period between visits.
Blood pressure
SBP and diastolic blood pressure were measured using a validated Omron M10-IT sphygmomanometer (Omron Healthcare), following the recommendations of the European Society of Hypertension(Reference O’Brien, Asmar and Beilin18).
Other measurements
Serum insulin concentrations (mg/dl) were measured, and insulin resistance was determined using the homoeostasis model assessment of insulin resistance index (HOMA-IR). At the baseline evaluation, the researchers gathered information of clinical and sociodemographic variables, such as gestational diabetes, hypertension and dyslipidaemia under treatment, pharmacological treatment and time elapsed since menopause diagnosis. A more detailed description of the methodology used and of the measuring of other physical variables, such as alcohol consumption and/or smoking, can be found in the previously published study protocol(Reference Garcia-Yu, Garcia-Ortiz and Gomez-Marcos13).
Data collection, data management and monitoring
The collection of data in each evaluation visit was carried out by a nurse who was previously trained for this purpose. Each participant was identified with a unique code, which referred to the data gathered in each of the measurements. These codes and data were used to create a database that could only be accessed by the researchers of the study. The principal investigator conducted a data cleansing process at the end of the study.
Ethical considerations
The study was approved by the Clinical Research Ethics Committee of the Health Area of Salamanca (‘CREC of the Health Area of Salamanca’) in February 2018. The participants signed an informed consent in accordance with the Declaration of Helsinki. They were informed about the objectives of the project and the risks and benefits of the explorations to be carried out. The confidentiality of the participants’ data was guaranteed at all times in accordance with the provisions of the Organic Law 3/2018, of 5th December, of Personal Data Protection and guarantee of digital rights, and Regulation 2016/679 of the European Parliament and of the Council of 27th April 2016 for Data Protection, and under the conditions established by Spanish Law 14/2007 of biomedical research.
Statistical analyses
The statistical analyses were carried out following the study protocol(Reference Garcia-Yu, Garcia-Ortiz and Gomez-Marcos13). The data were checked for normal distribution, and most data were considered normally distributed. The characteristics of the population are presented as mean and standard deviation for the continuous variables and as frequency distribution for the qualitative variables. For the baseline data, the χ 2 test and the Student’s t test were used to compare the qualitative variables and the means, respectively, between the two groups. Paired t tests were performed to compare changes from baseline (Post v. Pre) within the same group. ANCOVA with baseline body composition variables as covariates was used to compare the changes between the two groups. The effect size was calculated by the standardised mean difference (Cohen’s d). All analyses were performed using SPSS version 23.0 (IBM Corp), and an α-risk of 0·05 was established as the limit of statistical significance.
Results
Baseline characteristics of the participants
This study included 132 women (sixty-nine in IG and sixty-three in CG). The results of the effect of the intervention on the variables of body composition include 128 cases (sixty-seven in IG and sixty one in CG). There were three losses in the second evaluation (two in IG and one in CG). Moreover, another woman from the CG was not included in the analyses, since the impedancemetry analysis was not conducted in her at 6-month follow-up (Fig. 1). In the baseline evaluation, no differences were observed in any of the clinical or sociodemographic variables analysed (age, time elapsed since the beginning of menopause, history of hypertension and dyslipidaemia under treatment, gestational diabetes, pharmacological treatment, physical activity, smoking, SBP, diastolic blood pressure, serum insulin and HOMA-IR values). The baseline consumption of chocolate was similar in both groups (IG 69·6 (sd 71·8) v. CG 71·8 (sd 69·6) g/week), with no differences in the weekly consumption of chocolate with over 70 % cocoa (Table 1).
Table 1. Baseline characteristics of the study population
(Mean values and standard deviations; numbers and percentages)

Intragroup and intergroup differences in variables of body composition
The IG did not show changes in body weight after the intervention (baseline evaluation 65·66 (sd 10·36) kg; evaluation at 6 months 65·34 (sd 10·33) kg), although the most relevant results show a significant decrease in body fat mass (baseline 26·27 (sd 7·72) kg; 6 months 25·80 (sd 7·65) kg; P = 0·030) and body fat percentage (baseline 39·30 (sd 6·33) %; 6 months 38·75 (sd 6·60) %; P = 0·005). No significant differences were observed in the rest of the analysed variables (total body water, proteins, minerals and skeletal muscle mass) (Table 2).
Table 2. Change in body composition variables
(Mean values and standard deviations; 95 % confidence intervals)

IG, intervention group; CG, control group.
* Intragroup comparison by the paired Student’s t test.
† Intergroup comparison unadjusted.
‡ Intergroup comparison adjusted by baseline body composition variables.
On the other hand, within the CG, there were no relevant differences in any of the analysed variables of body composition between the baseline measurements and the measurements at 6 months. Body weight did not change (baseline evaluation 64·34 (sd 8·79) kg; evaluation at 6 months 64·52 (sd 8·91) kg); the same result was obtained for body fat percentage (baseline 38·57 (sd 5·50) %; 6 months 38·81 (sd 5·38) %).
The main effect of the intervention showed a favourable decrease in the IG for both body fat mass (–0·63; 95 % CI –1·15, –0·111 kg; P = 0·019) (Cohen’s d = –0·450) and body fat percentage (–0·79; 95 % CI –1·31, –0·26 %; P = 0·004) (Cohen’s d = –0·539). A favourable decrease was also observed in the IG for BMI, although it was not significant (–0·20; 95 % CI –0·44, 0·03 g/m2; P = 0·092) (Cohen’s d = –0·345). No significant differences were found between groups in minerals, proteins, total body water or skeletal muscle mass.
Changes in body composition by body segment
Both body fat mass and fat percentage showed a decrease in the IG for the three body segments analysed (trunk, arms and legs). On the other hand, the CG did not show such reduction. The differences in mean values showed a favourable change in the IG (P < 0·05) for all measurements, except for trunk fat mass (P = 0·065). The decrease was more pronounced in body fat percentage (trunk –0·73 (95 % CI –1·20, –0·26); arms –1·01 (95 % CI –1·59, –0·43); legs –0·76 (95 % CI –1·21, –0·31)). The intervention also showed favourable results in the IG for body fat mass in arms and legs, with no significant change in the trunk (Table 3).
Table 3. Change in body composition variables by segments (trunk, arms and legs)
(Mean values and standard deviations; 95 % confidence intervals)
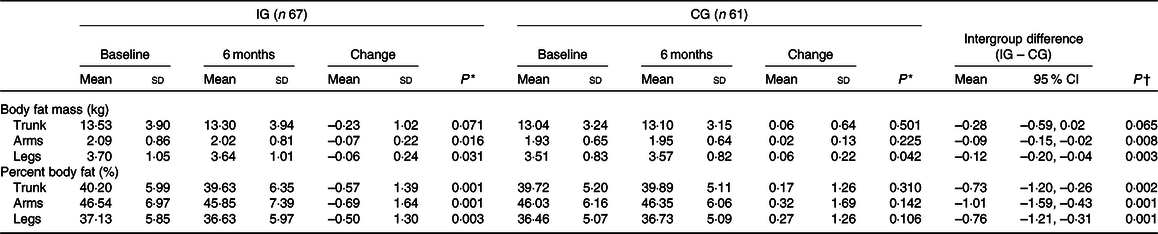
IG, intervention group; CG, control group.
* Intragroup comparison by the paired Student’s t test.
† Intergroup comparison by the Student’s t test.
Changes in nutritional composition
The intervention did not alter the nutritional composition of the groups. There were no differences in the intake of energy (kJ), carbohydrates, lipids or fibre. However, there was an increase in the consumption of proteins in the IG (baseline 76·5 (sd 16·8) g, 6 months 82·4 (sd 17·4) g). There were no differences between the two groups in any of the variables of nutritional composition (Table 4).
Table 4. Change in nutritional composition
(Mean values and standard deviations; 95 % confidence intervals)
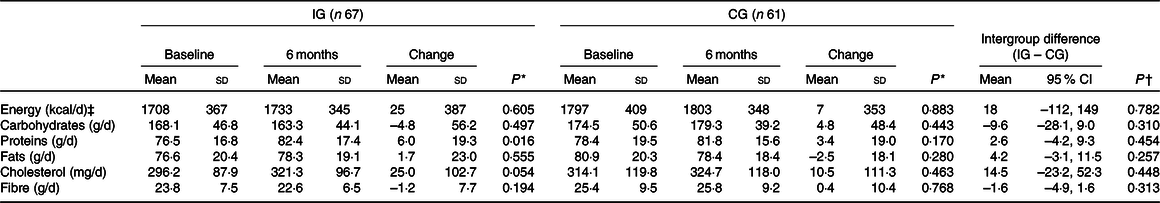
IG, intervention group; CG, control group.
* Intragroup comparison by the paired Student’s t test.
† Intergroup comparison by the Student’s t test.
‡ To convert kcal to kJ, multiply by 4·184.
Other variables measured remained unchanged. No differences in SBP or diastolic blood pressure were observed between groups. There were no significant changes in serum insulin (–0·37 mg/dl; 95 % CI –1·88, 1·14; P = 0·631) and in HOMA-IR (–0·07; 95 % CI –0·48, 0·34; P = 0·743) between the two groups.
Discussion
The main finding of this study is the beneficial effect of the daily consumption of 10 g of cocoa-rich chocolate on the body composition of postmenopausal women. After 6 months of intervention, a decrease of both body fat mass and fat percentage was achieved with respect to the CG. No relevant differences were observed in terms of body weight, BMI or other aspects of body composition. Moreover, there were no changes in the habitual dietary intake.
This is one of the first studies conducted in humans to show the beneficial effects that the compounds of cocoa can have on markers of body composition and fat distribution. Among the main compounds present in cocoa, polyphenols have shown high antioxidant capacity and potential coadjuvant capacity in certain metabolic mechanisms. In a trial conducted in rats, small doses of cocoa extract supplements were enough to counteract obesity and type 2 diabetes, providing new ideas about the possible application of cocoa supplements in the management of metabolic syndrome(Reference Aranaz, Romo-Hualde and Navarro-Herrera19). Likewise, another laboratory trial concluded that cocoa and its flavonoids could improve endothelial dysfunction and contribute with their reducing effect on arterial pressure(Reference Rabadan-Chavez, Reyes-Maldonado and Quevedo-Corona20). Although polyphenols and their impact on obesity are still poorly known, some studies have suggested that they can have a positive effect on glucose regulation, adipogenesis, lipolysis, lipid metabolism and appetite control(Reference Gu, Yu and Lambert21–Reference Huang, Tung and Huang24).
Improvements in insulin sensitivity, with decreased insulin levels and HOMA-IR, have been observed after dark chocolate ingestion in previous studies conducted in healthy persons(Reference Grassi, Lippi and Necozione25). Whilst others have not shown differences in these parameters after chocolate intake(Reference Lee, Berryman and West26), which is consistent with our findings. Desideri et al.(Reference Desideri, Kwik-Uribe and Grassi27) observed an improvement in HOMA-IR, but no differences in plasma insulin levels after cocoa flavanols ingestion in elderly subjects with mild cognitive impairment. This discrepancy may be explained by differences in the methods used in every research. This significant finding could be explained by other effects on gastrointestinal peptide hormones or neurohormonal regulation of gastrointestinal function, satiety and satiation; however, these were not measured in this trial. It would be interesting for future studies to explore these as possible mechanistic effects.
There is evidence of an increase in percent body fat, as well as a central and visceral redistribution of fat mass, with ageing(Reference He, Li and Tang28). Additionally, menopause is an important change in women in terms of body composition. Toth et al.(Reference Toth, Tchernof and Sites29,Reference Toth, Tchernof and Sites30) associated menopause with an increase of abdominal fat and quantified these changes in 49 % more abdominal fat with respect to premenopausal women. The meta-analysis carried out by Ambikairajah et al.(Reference Ambikairajah, Walsh and Tabatabaei-Jafari31) showed an increase in body fat percentage (2·88 %; 95 % CI 2·13, 3·63 %) and trunk fat percentage (5·49 %; 95 % CI 3·91, 7·06 %) between premenopausal and postmenopausal women, though the change in fat mass quantity was attributable predominantly to increasing age. Furthermore, their results showed a decrease in total leg fat percentage and an increase in measures of central fat suggesting changes in fat mass distribution during menopause. In addition, it has to be mentioned that Mahabir et al.(Reference Mahabir, Baer and Johnson32) reported that a one-unit change for body fat percentage was associated with a substantial change in serum leptin. There is evidence suggesting that this hormone could be a potential biomarker for breast cancer risk in women, especially overweight/obese and postmenopausal women(Reference Pan, Deng and Cui33) and that higher levels of circulating leptin have been associated with increased severity of non-alcoholic fatty liver disease(Reference Polyzos, Aronis and Kountouras34). In turn, such changes in the regional distribution of fat have been correlated to an increase in cardiometabolic risk in this population(Reference Peppa, Koliaki and Hadjidakis35). Therefore, it is necessary to know the variation of fat distribution among postmenopausal women as a consequence of interventions such as the one presented in this study. Aerobic physical activity combined with resistance exercises in 3 weekly sessions have shown to reduce body fat mass and fat percentage in all body segments, that is, trunk, arms and legs(Reference Choquette, Riesco and Cormier11). The intervention conducted by Choquette et al.(Reference Choquette, Riesco and Cormier11) also included a group with a polyphenol supplement (isoflavones), which only showed such reduction in the legs. Therefore, it is worth highlighting the decrease achieved in our study for body fat mass in general and in the trunk, arms and legs, which shows the magnitude of the results presented in this manuscript. The findings of our trial may be clinically relevant and even more considering that these changes occurred after a nutritional intervention with a commercially available chocolate. Moreover, this intervention showed no adverse effects on any of the parameters evaluated.
In the present study, there were no significant changes in body weight or in BMI after the 6 months of intervention. The results are in line with those of a recent meta-analysis of thirty-five randomised clinical trials about the impact of cocoa on body weight and BMI(Reference Kord-Varkaneh, Ghaedi and Nazary-Vanani36). That meta-analysis suggested that cocoa supplements do not have a significant effect on body weight (–0·108 kg, 95 % CI –0·262, 0·046, P = 0·168) or on BMI (–0·014 kg/m2, 95 % CI –0·105, 0·077, P = 0·759). However, a subgroup analysis revealed that body weight and BMI decreased with cocoa supplements of ≥30 g of chocolate per d in trials of 4–8 weeks. In our work, we observed a change in body composition, with no effect on body weight, although a greater decrease (–0·49 kg (95 % CI –1·08, 0·10)) was observed with respect to the meta-analysis conducted by Kord-Varkaneh et al.(Reference Kord-Varkaneh, Ghaedi and Nazary-Vanani36). Therefore, the daily contribution of energy content from the chocolate supplement (10 g; 247 kJ (59 kcal)) did not seem to have a negative influence on body weight. Likewise, it did not appear to alter the mean energy intake of the participants (75 kJ (18 kcal) (95 % CI –112, 149)). Moreover, no relevant increase was observed in total body water, fat-free mass or skeletal muscle mass. All these parameters showed a slight increase in the IG.
The use of a placebo control in dietary studies must be attempted if possible. Similar studies evaluating the effects of chocolate intake have used white chocolate as a suitable placebo. Providing a placebo compound to the CG could have controlled for some confounding factors, such as preload effect on energy content taken during subsequent meal and would probably have allowed to assess the effects considering the polyphenol composition of the chocolate. However, this would also have potentially affected other metabolic variables and would not have allowed to evaluate the effects of the intake of the chocolate as a whole. Supporting this, Almoosawi et al.(Reference Almoosawi, Tsang and Ostertag37) pointed out the possibility of adverse effects occurring with polyphenol-poor chocolate placebo, reporting that in the absence of polyphenols, high-fat products such as chocolate may adversely affect metabolism, causing deleterious effects. Nevertheless, the clinical trial that this study is part of aimed to evaluate the effect of adding a daily amount of 10 g of chocolate high in cocoa content (99 %) and polyphenols to the normal diet on blood pressure, vascular function, cognitive performance, quality of life and body composition in postmenopausal women. The chocolate used in the intervention is commercially available; this makes the results of this study more accessible than those of other studies in which laboratory supplements are used. Moreover, this provided a real clinical context and allowed us to assess the potential benefits, as well as potential harms, of the intake of this compound as a whole, as pretended.
The limitations of this study include, on the one hand, the limited amount of polyphenols in the amount of chocolate administered to the IG with respect to other studies. However, this intervention attained the study objective by providing a commercial supplement to the habitual diet. This makes the results of this study more accessible than those of other studies in which laboratory supplements are used, although the intake of polyphenols from this amount of chocolate may not be enough to show relevant changes in the magnitude of the effect. On the other hand, it was not possible to blind the participants due to the nature of the intervention.
In conclusion, the daily addition of 10 g of cocoa-rich chocolate to the habitual diet of postmenopausal women reduces body fat mass and body fat percentage without altering body weight. Future studies should focus on the mechanisms through which the main compounds of cocoa produce these effects, in order to determine the most suitable amount and duration of the intake of these compounds.
Acknowledgements
The authors are grateful to all the volunteers for their participation, and the professionals involved in the study: J. I. R.-R., J. A. M.-F., L. G.-O., M. A. G.-M., I. A. G.-Y., Rosario Alonso-Domínguez, Sara Mora-Simón, Natalia Sánchez-Aguadero, Jesús González-Sánchez, Cristina Agudo-Conde, C. L.-S., Benigna Sánchez-Salgado, Carmen Castaño-Sánchez, E. R.-S., Susana González-Manzano, Olaya Tamayo-Morales and Susana González-Sánchez.
This study was supported in part by grants funded by Gerencia Regional de Salud de Castilla y León (GRS 1583/B/17). Lindt & Sprüngli provided the necessary chocolate for the implementation of the study. This company did not play any role in the design of the study, data analysis, reporting of results or the decision to present the manuscript for publication.
I. A. G.-Y., J. A. M.-F. and J. I. R.-R. designed the study; I. A. G.-Y., J. I. R.-R., L. G.-O., E. R.-S., M. A. G.-M. and C. L.-S. conducted research; I. A. G.-Y., J. A. M.-F. and J. I. R.-R. analysed data; I. A. G.-Y., J. A. M.-F. and J. I. R.-R. had primary responsibility for final content. All authors read and approved the final manuscript.
The authors declare that they have no conflicts of interest.


