


Generally, protein is the most abundant nutrient in fish feed(Reference Nwanna, Lemme and Metwally1) and is the most crucial nutrient for keeping fish in healthy condition. Fishmeal is considered the most nutritious and digestible feed for farmed fish. However, as the feed demand increases, the amount of fishmeal used in aquaculture compound feeds decreases to offset its high cost(Reference Green2). It is worth noting that the substitution of different protein resources for fishmeal usually results in a deficient supply of essential amino acids (AA). Supplementation with exogenous AA can constitute the ‘key components of cost-effective fish feed formulations’(3). In view of sustainable fish nutrition, more knowledge concerning the protein and crystalline AA utilisation efficiency of fish feeds are indispensable. Methionine (Met) is the first limiting AA in common plant protein sources, such as soyabean meal, peanut meal and copra meal(Reference Kwasek, Terova and Lee4). Therefore, supplementation with exogenous Met is particularly important to avoid disturbances to protein metabolism and reduce nitrogen losses in farmed fish(Reference Figueiredo-Silva, Lemme and Sangsue5–Reference Tulli, Messina and Calligaris7).
Free AA derived from the diet or protein degradation are efficiently absorbed by epithelial cells along the digestive tract through specific transporters(Reference Bröer8), which facilitate cellular AA supply and homeostasis(Reference Taylor9). The sites of Met absorption in the fish intestine differ according to the species. The highest uptake occurs in the foregut area, though Met absorption occurs throughout the intestine of the Nile tilapia, Oreochromis niloticus (Reference Segovia-Quintero and Reigh10). However, Met absorption in the green sturgeon, Acipenser medirostris, occurs mainly in the midgut and hindgut(Reference Bakke, Tashjian and Wang11). The Met transport mechanism relies mainly on a high-affinity transport system in gilthead bream, Sparus aurata, and is obligatorily dependent on the presence of Na+ and Cl–(Reference Cozzi, Lorenzo and Gómez12). System B0 and AlaSerCys (ASC)-like Na+-dependent neutral AA transporters have been reported to improve the absorption of Met in human intestinal epithelial cells (Caco-2)(Reference Chen, Zhu and Hu13), in the brush-border membrane vesicles of the chicken jejunum(Reference Soriano-García, Torras-Llort and Ferrer14) and in shrimp hepatopancreatic cells(Reference Duka and Ahearn15). ASCT2 (SLC1A5) and B0AT1 (SLC6A19) were expressed in all examined mammal tissues and were located in the brush borders of epithelial cells where they mediated the transportation of neutral AA(Reference Huang, Li and Zhang16–Reference Fuchs and Bode18). The former is an Na+- and Cl–-dependent transporter, which actively transports most neutral AA except for aromatic ones, and is mainly expressed in the kidney and intestine. The latter is an Na+-dependent, Cl–-independent and pH-sensitive transporter, with the highest transport efficiency for leucine, isoleucine, Met and valine(Reference Bröer, Klingel and Kowalczuk19). However, little information about ASCT2 and B0AT1 is available for marine fish. Previous studies have provided the gene expression profiles and dietary regulation of these two transporters in turbot, Scophthalmus maximus L.(Reference Xu, He and Mai20, Reference Song, Xu and Zhou21).
AA transporters act not only as carriers but also as sensors to detect AA concentrations and/or cell growth factor, so as to activate an intra-cellular target of the rapamycin (TOR) pathway(Reference Goberdhan, Meredith and Boyd22–Reference Zhang, Ren and Zeng24). Met can significantly affect the secretion of the growth hormone (GH)–insulin-like growth factor-I (IGF-I) axis and the regulation of protein metabolism in rainbow trout, Oncorhynchus mykiss (Reference Rolland, Dalsgaard and Holm25, Reference Gaylord, Barrows and Teague26). IGF-I binding with its receptor in the cell membrane can activate the TOR protein via the phosphoinositide 3-kinase (PI3K)/protein kinase B (Akt) pathway. TOR modulates the activity of two important translation regulators, ribosomal p70-S6 kinase (S6K) and 4E-binding protein (4E-BP), to affect protein synthesis in animals(Reference Wullschleger, Loewith and Hall27). Met, as a signal molecule involved in the modulation of both IGF-I and AA transporter mRNA expression(Reference Flora, Dionello and Benitez28–Reference Liu, Ke and Dan30), regulates the TOR signalling pathway and influences muscle protein synthesis in fish such as rainbow trout(Reference Rolland, Dalsgaard and Holm25, Reference Belghit, Skibacassy and Geurden31) and turbot(Reference Jiang, Bian and Zhou32).
An economically important carnivorous marine fish, cobia, is globally distributed. It supports recreational and commercial fisheries in the Gulf of Mexico and US Atlantic Ocean and has been widely reared in southern China(Reference Tien, Chinh and Huong33–Reference Zhou, Wu and Tan35). Although the dietary Met requirements of cobia have been reported(Reference Zhou, Wu and Tan35, Reference Wang, Mai and Xu36), no information is available on how an optimal Met diet affects growth, regulates key AA transporter genes and affects protein metabolism. Therefore, this research aims to determine the mechanism by which dietary Met influences the growth of juvenile cobia via the TOR signalling pathway.
Materials and methods
Experimental design
Seven isonitrogenous and isolipidic diets were formulated, containing 0·72, 0·90, 1·00, 1·24, 1·41, 1·63 and 1·86 % Met (Table 1). l-Aspartic acid and glycine were used to substitute for Met in the low-Met diets. Ingredients were ground, weighed and then well mixed with fish oil, soya oil, and soya lecithin. After mixing, water was added to produce a mash suitable for extrusion. The diets were sieved into the 2-mm-diameter pellet size and then air-dried at room temperature until the moisture was reduced to approximately 10 %. The pellets were packaged in Ziploc bags and stored at –20°C until use. The AA concentrations of the diets were measured by an automatic AA analyser (A300; MembraPure). The AA composition of each diet is presented in Table 2.
Table 1. Composition and nutrient levels of experimental diets (% DM)
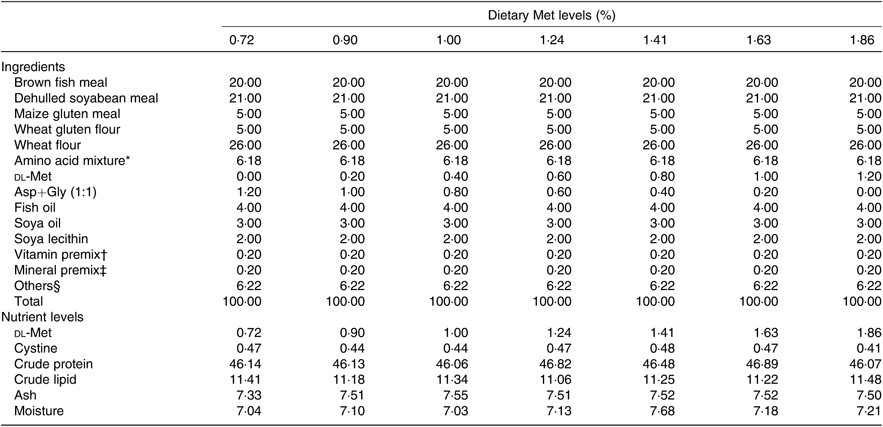
Met, methionine; Asp, aspartic acid; Gly, glycine.
* Amino acid mixture (per 100 g diet): l-lysine, 0·320 g; l-histidine, 0·381 g; leucine, 1·041 g; l-isoleucine, 0·303 g; l-phenylalanine, 0·854 g; l-valine, 0·857 g; l-aspartic acid, 1·21 g; glycine, 1·21 g. Amino acids obtained from Shanghai Sanjie Biochemical Technology Co., Ltd.
† Vitamin premix was obtained from Qingdao Master Biotechnology Co., Ltd.
‡ Mineral premix was obtained from Qingdao Master Biotechnology Co., Ltd.
§ Others: microcrystalline cellulose 3·72 %; vitamin C, 0·35 %; choline chloride, 0·50 %; Ca(H2PO4)2, 1·50 %; antioxidant, 0·05 %; attractant, 0·1 %.
Table 2. Amino acid composition of the test ingredients used in the experiment (% DM)
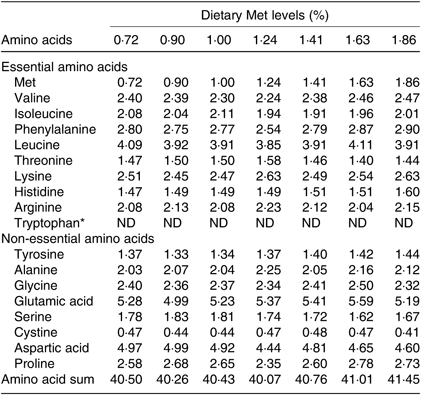
Met, methionine; ND, not determined.
* Tryptophan was not determined.
Fish rearing
Cobia were bought from a commercial hatchery in Wenchang, China. All fish were fed with commercial feed and acclimated to the experimental conditions for 7 d. At the initiation of the feeding trial, fish were fasted for 24 h. Healthy cobia (mean initial weight 9·79 (se 0·04) g) were randomly assigned into seven groups in triplicate with forty individuals per sea cage (1·0 × 1·0 × 2·0 m). The fish were slowly and evenly fed by hand to apparent satiation twice daily at 07.00 and 18.00 hours. Throughout the feeding trial the water temperature fluctuated from 28 to 30°C, the dissolved oxygen concentration was >7·0 mg/l and the salinity was 24–26 g/l.
Sample collection
At the end of 8th week, 24 h after the last feed, the fish in each cage were counted and weighed. Fish were anaesthetised with benzocaine (30 mg/l). Three fish from each tank were randomly selected and their blood samples were drawn from the caudal vein with a 1-mL syringe. Blood samples were centrifuged (3000 g for 10 min) at 4°C and the serum was separated and stored at –80°C for later serum hormone level and glucose (GLU) analyses. The intestinal tract, liver and dorsal muscle of three fish from each cage were sampled and pooled in a centrifuge tube with RNAlater® solution (Ambion) and frozen at –80°C until analysis of gene expression. The dorsal muscle was dissected, immediately frozen in liquid N2 and stored in a freezer at –80°C prior to protein expression analysis.
Serum hormone and glucose concentration
Serum insulin (INS) levels were measured by time-resolved fluoroimmunoassay, according to Andoh(Reference Tadashi37). This assay uses anti-barfin flounder insulin-II antiserum and B1 monobiotinylated barfin flounder insulin-I, which were synthesised chemically (Peptide Institute). Insulin-I of known concentrations was used as a standard. The cross-reactivities of insulin-I and -II were identical in this time-resolved fluoroimmunoassay(Reference Tadashi37). No significant cross-reactivity was observed in the fractions collected during reversed-phase chromatography of the serum, except for those containing INS, suggesting that the antiserum does not recognise preproinsulin, proinsulin, or their intermediates. The inter- and intra-assay CV were 7·0 and 7·6 %, respectively. Samples were measured in duplicate.
Serum GH levels were measured using 125I-labelled recombinant salmon GH (rsGH: lot no. DAB-GHB1; GroPep) for labelled samples, unlabelled rsGH as a standard and anti-salmon GH primary antibody (lot no. AJI-PAN1; GroPep), as previously described(Reference Shepherd, Drennon and Johnson38). The inter- and intra-assay CV were 7·0 and 7·6 %, respectively. Samples were measured in duplicate.
Serum IGF-I levels were measured by time-resolved fluoroimmunoassay using anti-barramundi IGF-I anti-serum (GroPep) and flounder 125I-IGF-I as the labelled ligand(Reference Baños, Planas and Gutiérrez39). Flounder IGF-I was also purchased from GroPep and used at known concentration as a standard. The inter- and intra-assay CV were 5·0 and 6·0 %, respectively. Samples were measured in duplicate.
Serum GLU concentrations were measured by a fully automatic biochemical analyser (Hitachi) with the matching commercial reagent kit (Nanjing Whitman Biotech Co., Ltd.). Samples were measured in duplicate.
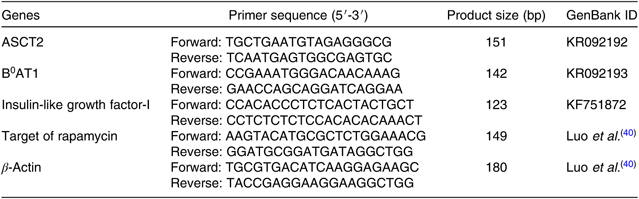
RNA extraction and quantitative PCR analysis
The total RNA of the intestinal tract, liver and dorsal muscle of cobia were extracted using Trizol Reagent (Takara). The integrity of the total RNA sample was tested by electrophoresing on a 1·2 % denaturing agarose gel, while the purity and concentration were determined by a Nano Drop® ND-2000 spectrophotometer. The absorption ratios (260:280 nm) for all the samples were approximately 2·00. Subsequently, 1 μg of the total RNA was reverse-transcribed into complementary DNA (cDNA) using the Prime Script™ RT reagent kit with genomic DNA Eraser (Takara), according to the manufacturers’ instructions. Primers were then designed using Primer 5 software. All primer sequences used in the present study are listed in Table 3. Targeted gene expression levels were determined using a quantitative real-time PCR detection system (ABI 7500; Applied Biosystems) using a SYBR® Premix Ex TaqTM system. The thermal cycle program was as follows: initial denaturation at 95°C for 2 min followed by forty cycles of 95°C for 10 s, 59°C for 10 s and 72°C for 20 s. At the end of each reaction, a melting curve analysis was performed to confirm the specificity of production. In addition, the amplification efficiency of the primers was analysed according to the equation E=10(–1/slope) – 1. The amplification efficiencies ranged between 0·92 and 1·05. To calculate relative expression levels, the comparative cycle threshold (CT) method (2−ΔΔCt method) was used, as described by Yao et al. (Reference Yao, Kong and Wang41).
Table 3. Nucleotide sequence of primers for real-time quantitative PCR amplification
Protein extraction and Western blot analysis
Dorsal muscles (approximately 40 mg) were homogenised with Bioprep-24 Homogeniser (Allsheng) on ice and lysed in Enhanced RIPA Lysis Buffer (50-mM Tris, 150-mM NaCl, 1 % Triton X-100, 0·1 % SDS, 1-mM EDTA, pH 7·4; Biosharp Biotech) with a protease and phosphatase inhibitor cocktail (Thermo Fisher Scientific). Lysates were centrifuged at 12 000 g for 20 min at 4°C. Protein concentrations were determined using a BCA Protein Assay kit (Thermo Fisher Scientific) with bovine serum albumin as a standard. Lysates (30 µg of total protein) were separated by SDS-PAGE and transferred to 0·45-µm polyvinylidene difluoride membranes (Millipore) for Western blot analysis. Proteins were blocked with 5 % non-fat dry milk for 1 h at room temperature. Appropriate primary antibodies were purchased from Cell Signaling Technology Inc.: phosphor-TOR (Ser2448; rabbit no. 2971), TOR (rabbit no. 2972), phospho-p70-S6K (Ser371; rabbit no. 9208), p70-S6K (rabbit no. 9202), phospho-4E-BP1 (Thr37/46; rabbit no. 9459) and 4E-BP1 (rabbit no. 9452). Antibody for glyceraldehyde-3-phosphate dehydrogenase was from Hangzhou Goodhere Biotechnology. Since mammalian antibodies were used, AA sequences of the studied cobia proteins were aligned in the NCBI database (https://blast.ncbi.nlm.nih.gov/Blast.cgi) to check the identity of the antibodies. In previous studies, all antigenic regions of these antibodies have been successfully used in turbot(Reference Wang, He and Mai42), rainbow trout(Reference Dai, Panserat and Mennigen43) and zebrafish(Reference Tian, Wang and Wang44). Then membranes were incubated with horseradish peroxidase (HRP)-labelled goat anti-rabbit IgG (H+L) second antibody (Beijing Ray Antibody Biotech) and developed using Chemiluminescent HRP Substrate (Millipore). The bands were visualised using the Fluorescence Imaging System (Tanon-5200) and quantified using Image J software.
Statistical analysis
Normality and homoscedasticity assumptions were confirmed prior to the statistical analysis. All evaluated variables were subjected to an ANOVA to determine whether dietary Met levels significantly affected the observed responses (P<0·05). Differences among all treatments were separated by Duncan’s multiple-range test. In addition, to determine whether the effect was linear and/or non-linear, a follow-up trend analysis using orthogonal polynomial contrasts was performed(Reference Davis45) in the SPSS 22.0 (SPSS Inc.) and SAS® software packages (SAS Institute Inc.). Adjusted R 2 values (adj. R 2) were calculated as previously described by Kvalseth(Reference Kvålseth46). The optimum dietary Met requirement based on weight gain rate (WGR) was established through a broken-line or quadratic model(Reference Li, Wu and Dong47, Reference Robbins, Saxton and Southern48).
Results
Growth performance
The WGR of fish was significantly affected by dietary Met levels (P<0·05); it increased gradually with Met of up to 1·24 % and decreased gradually thereafter (Table 4). The relationship between dietary Met levels and WGR (the dependent variable) was better described by a straight broken-line or quadratic broken-line model than a linear or second-order polynomial model. The straight broken-line analysis of WGR against dietary Met levels indicated that the optimal dietary Met level for juvenile cobia growth was 1·24 % of DM (2·71 % dietary protein; Fig. 1). The trends in specific growth rate (SGR) among the different experimental groups were related to those of WGR. Fish fed 1·24 % dietary Met had higher values compared with fish fed other methionine levels (P<0·05). In contrast, the trends in feed conversion ratio among the different experimental groups were opposite to those of WGR. The relationship between dietary Met levels and the feed conversion ratio -dependent variable was better described by straight broken-line or quadratic broken-line models. No significant effects of dietary Met on feed intake or survival rate were observed (P>0·05).
Table 4. Effects of dietary methionine (Met) levels on growth and feed utilisation of cobia for 8 weeks
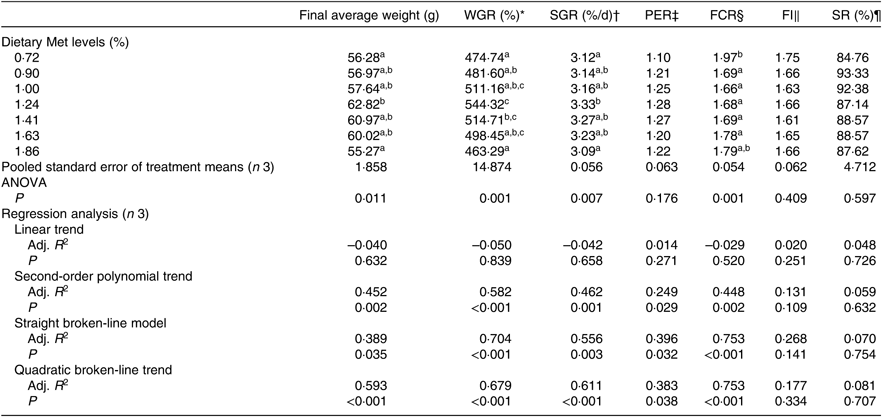
WGR, weight gain rate; SGR, specific growth rate; PER, protein efficiency ratio; FCR, feed conversion ratio; FI, feed intake; SR, survival rate; Adj. R 2, adjusted R 2.
a,b,c Mean values in the same column with unlike superscript letters are significantly different (P < 0·05).
* WGR (%)=100 × (final body weight – initial body weight)/initial body weight.
† SGR (% d/d)=100 × (ln (final body weight) – ln (initial body weight))/d.
‡ PER=wet weight gain/total protein intake.
§ FCR=total diet intake/total wet weight gain.
|| FI (%/d)=100 × total diet intake (initial body weight + final body weight)/d.
¶ SR (%) = 100 × the final fish number/the initial fish number.
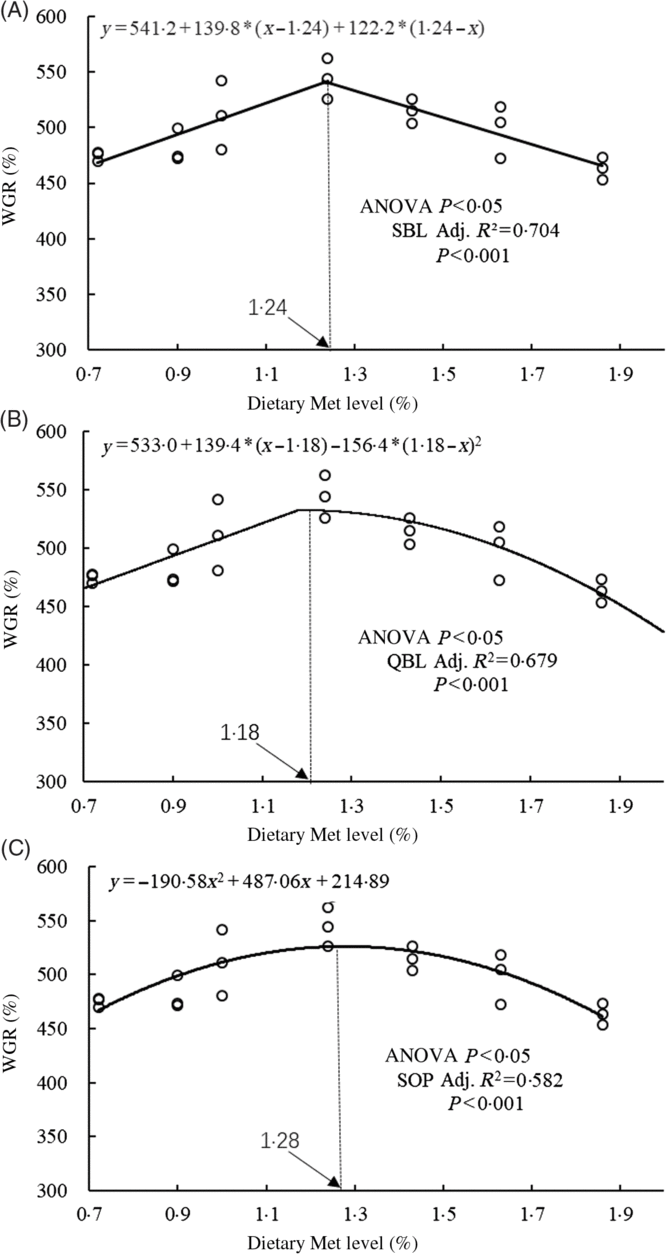
Fig. 1. Relationship between dietary methionine (Met) levels and weight gain rate (WGR) of juvenile cobia. (A) The two-slope broken-line (SBL) model would be y=L + V * (x – R) + U * (R – x), where (R – x) is defined as zero at values of x<R, and (x – R) is defined as zero when x>R. (B) The quadratic broken-line (QBL) model would be y=L + U * (R – x) (R – x) + V * (x – R), where (R – x) is defined as zero at values of x<R, and (x – R) is defined as zero when x>R. (C) The second-order polynomial (SOP) model would be y=Ax 2 + Bx + C (A≠0, A<0). Adj. R 2, adjusted R 2.
Serum hormone and glucose concentration
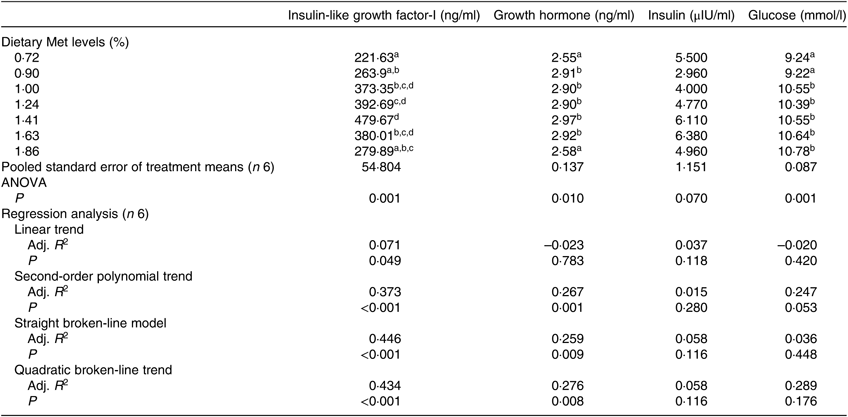
The serum concentrations of IGF-I and GH were significantly affected by dietary Met levels (P<0·05; Table 5). The serum IGF-I concentration increased with the dietary Met level but only up to 1·43 %, after which it gradually decreased (P<0·05). The relationship between dietary Met level and the dependent variable of serum IGF-I was better described by straight broken-line model or a quadratic broken-line model. Fish fed 0·72 or 1·86 % dietary Met had low GH concentrations, which were significantly lower than those in fish fed other Met levels (P<0·05). The concentrations of serum GLU in the 0·72 and 0·90 % Met dietary groups were significantly lower than those in other groups (P<0·05), while no significant effect of dietary Met on INS was observed (P>0·05).
Table 5. Effects of dietary methionine (Met) levels on cobia serum glucose and hormone concentrations
Adj. R 2, adjusted R 2.
a,b,c,d Mean values in the same column with unlike superscript letters are significantly different (P < 0·05).
ASCT2 and B0AT1 gene expression in the intestinal tract, liver and dorsal muscle
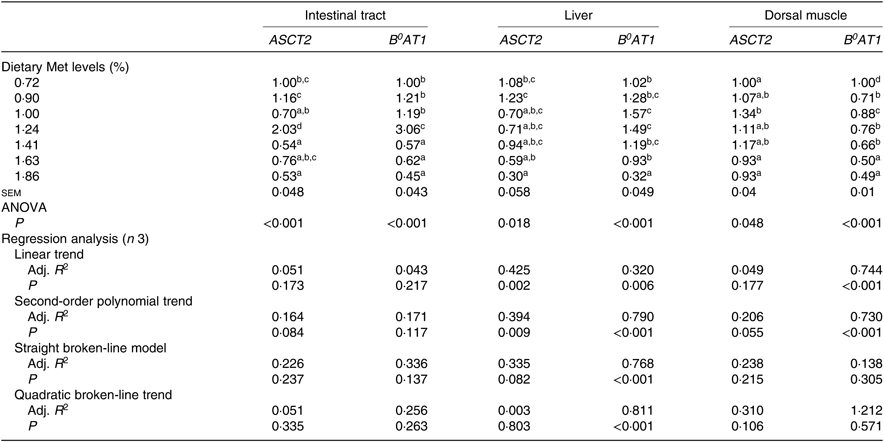
Expression of ASCT2 and B 0AT1 genes in the intestinal tract, liver and dorsal muscle were significantly influenced by the dietary Met level (P<0·05; Table 6). The expressions of both ASCT2 and B0AT1 in the intestinal tract of fish fed 1·24 % dietary Met were significantly more up-regulated than those in fish fed other Met levels (P<0·05). In the liver, fish fed 1·00 and 1·24 % dietary Met had significantly higher B 0AT1 gene expression compared with fish fed 0·72, 1·63 and 1·86 % Met (P<0·05). In the dorsal muscle, fish fed 1·63 and 1·86 % dietary Met had significantly lower B0AT1 concentrations compared with fish fed other Met levels (P<0·05). The relationship between dietary Met level and the dependent variable of hepatic B0AT1 was best described by a quadratic broken-line model. Moreover, significant linear or second-order polynomial relationships were found between the experimental treatments and dorsal muscle B0AT1.
Table 6. Effects of dietary methionine (Met) levels on ASCT2 and B0AT1 relative gene expression in the intestinal tract, liver and dorsal muscle of cobia
Adj. R 2, adjusted R 2.
a,b,c,d Mean values in the same column with unlike superscript letters are significantly different (P < 0·05).
Insulin-like growth factor-I and target of rapamycin gene expression in the intestinal tract, liver and dorsal muscle
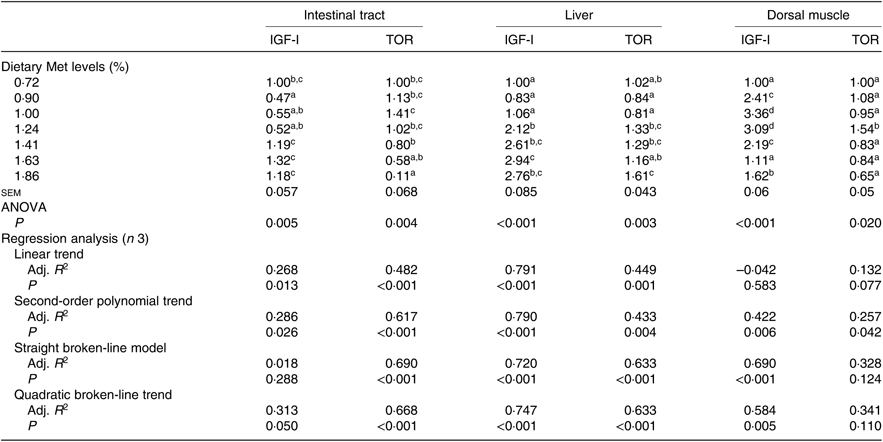
Gene expression of both IGF-I and TOR in the intestinal tract, liver and dorsal muscle was significantly influenced by the dietary Met level (P<0·05; Table 7). The transcriptional levels of IGF-I in the intestinal tracts of fish fed 0·90, 1·00 or 1·24 % dietary Met were significantly lower than those in fish fed 1·41, 1·63 and 1·86 % Met (P<0·05). Fish fed 0·72, 0·90 or 1·00 % dietary Met had significantly lower expressions of the hepatic IGF-I gene compared with other fish. In the dorsal muscle, fish fed 1·00 or 1·24 % dietary Met showed significantly higher expressions of the IGF-I gene compared with other fish (P<0·05). The relationship between Met level and IGF-I in both intestinal tracts and dorsal muscle was better described by a straight broken-line model or a quadratic broken-line model. Fish fed 1·00 % dietary Met showed higher TOR mRNA levels in the intestinal tract compared with the 1·41, 1·63 and 1·86 % groups (P<0·05). Fish fed 1·24, 1·41 or 1·83 % dietary Met showed significantly higher hepatic TOR gene expressions than those fed 0·90 or 1·00 % Met (P<0·05). In dorsal muscle, the 1·24 % Met group showed the highest TOR mRNA levels, which were significantly higher compared with the other groups (P<0·05). The relationship between dietary Met and TOR in both the intestinal tract and liver was best described by straight broken-line models.
Table 7. Effects of dietary methionine (Met) levels on insulin-like growth factor-I (IGF-I) and target of rapamycin (TOR) relative gene expression in intestinal tract, liver and dorsal muscle of cobia
Adj. R 2, adjusted R 2.
a,b,c,d Mean values in the same column with unlike superscript letters are significantly different (P < 0·05).
Effects of target of rapamycin signalling pathway by dietary methionine
The phosphorylation levels of TOR on Ser2448 in the dorsal muscle of fish fed 1·24 % Met were significantly higher than those of fish fed 0·72 and 1·86 % Met (P<0·05; Fig. 2). The phosphorylation of S6K on Ser371 in the dorsal muscle of fish fed 1·86 % Met was significantly higher than those of fish fed 0·72 % Met (P<0·05). The phosphorylation levels of 4E-BP1 on Thr37/46 decreased with increases in Met, but there were no significant differences between treatment groups (P>0·05).
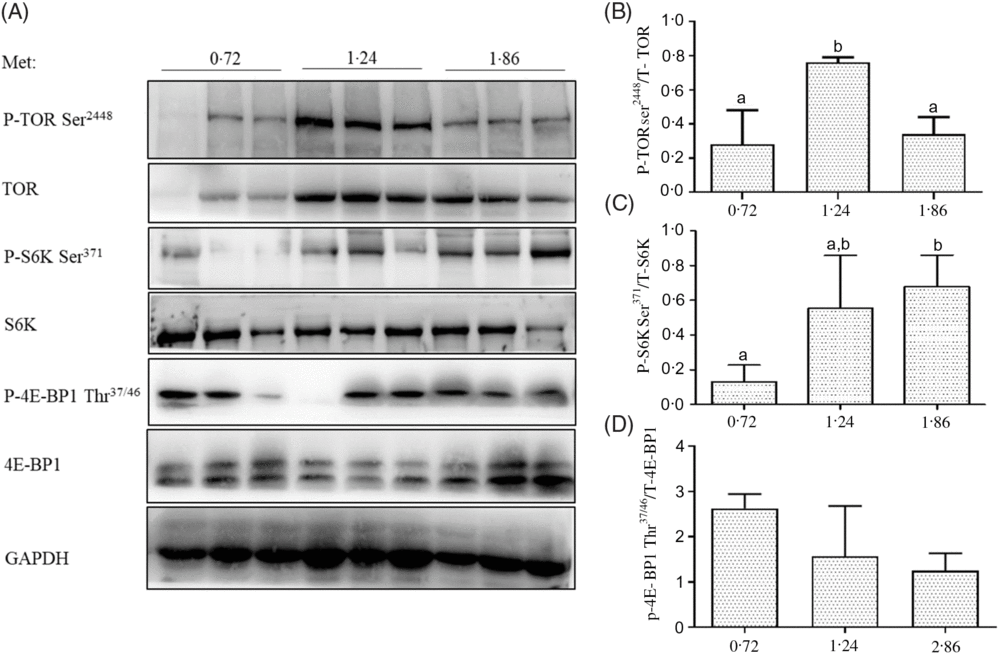
Fig. 2. Total and phosphorylation levels of target of rapamycin (TOR), S6 kinase (S6K) and 4E-binding protein 1 (4E-BP1) were examined by Western blot (A) and quantified (B–D) in the dorsal muscle of cobia fed the 0·72, 1·24, and 1·86 % methionine (Met) diets. Results are represented as means with standard errors (n 3) and were analysed using ANOVA followed by Duncan’s multiple range test. a,b Mean values with unlike letters are significantly different (P < 0·05). GAPDH, glyceraldehyde-3-phosphate dehydrogenase.
Discussion
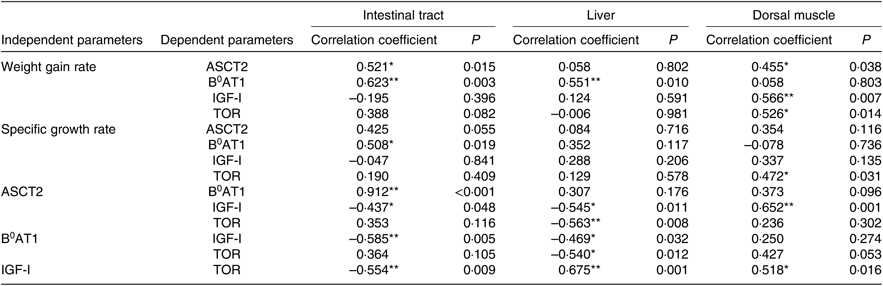
The optimum level of Met in the diet of juvenile cobia was estimated to be 1·24 % (2·71 %, 264 dietary protein) based on WGR. Growth and feed utilisation increased with increases in dietary Met levels, which is consistent with previous reports on other marine fish species, such as orange-spotted grouper, Epinephelus coioides (2·73 % dietary protein)(Reference Luo, Liu and Mai49), and cobia (2·64 % dietary protein)(Reference Zhou, Wu and Tan35). The growth of pigs was improved by an optimal Met level, which stimulated the up-regulation expression of AA transporters(Reference García-Villalobos, Morales-Trejo and Araiza-Piña50). Dietary AA supplementation significantly increased the protein expression of luminal B0AT1 in the rat proximal jejunum(Reference Jando, Camargo and Herzog51). In terms of fish species, adding AA to the diet significantly increased the mRNA expression of ASCT2 in grass carp, Ctenopharyngodon idella (Reference Hu, Wang and Qu52), and significantly shifted the postprandial gene expression pattern of B0AT1 in turbot(Reference Xu, He and Mai20). In the present experiment, the maximum mRNA levels of ASCT2 and B0AT1 in cobia intestinal tracts were found in the 1·24 % Met group. Furthermore, we found a positive relationship between WGR and the gene expressions of ASCT2 (r 0·521, P<0·05) and B 0AT1 (r 0·623, P<0·01) in the intestinal tract (Table 8). The findings of the present study suggest that up-regulated AA transporters act as a channel that transports AA more effectively into intra-cellular spaces, thereby increasing the contents of the free AA pool and, in turn, promoting protein synthesis.
Table 8. Correlation analysis of parameters in intestinal tract, liver dorsal muscle of cobia
IGF-I, insulin-like growth factor-I; TOR, target of rapamycin.
Significant correlations: * P<0·05, ** P<0·01.
INS, GH and IGF-I play important roles in the regulation of protein metabolism(Reference Li and Zhao53). Some studies have demonstrated that dietary AA influence serum or plasma INS, GH and IGF-I concentrations in fish(Reference Gaylord, Barrows and Teague26, Reference Han, Chi and Tan54). In the present study, there was no significant influence between dietary Met and serum INS, which is consistent with other studies(Reference Li and Zhao53, Reference Zhang and Li55). However, the concentration of serum GLU was significantly influenced by dietary Met level, and a lower serum GLU concentration was found in fish fed Met-deficient diets, which is similar to that previously reported in cobia(Reference Zhou, Wu and Tan35) and orange-spotted grouper(Reference Luo, Liu and Mai49). This may be partly attributed to the long-term hypoglycaemia, leading to a lack of energy for body activity. Supplementation with adequate Met may promote gluconeogenesis and phosphoenolpyruvate carboxykinase activity and contribute to glycogen synthesis for body growth(Reference Chi, Wang and Tan56). Moreover, fish fed a Met-deficient diet showed the lowest GH concentration, which corresponds with their lower growth performance. These results are in agreement with studies on the growth of farmed rabbits(Reference Zhang and Li55) and goats(Reference Sun, Tan and Yao57), but contrast with a study on rainbow trout(Reference Delbertmiii, Frederict and Paul58) where the plasma GH levels were not affected by Met supplementation. The different results obtained by the present study may due to the diet formulations used, which were formulated under low fishmeal conditions and had seven-set Met levels.
IGF-I is the primary anabolic agent responsible for fish growth. Alteration in its serum contents and gene expression can partly account for changes in growth rate(Reference Han, Chi and Tan54, Reference Wu, Wu and Lu59). Previous studies report that dietary Met can influence the serum content and mRNA level of IGF-I(Reference Rolland, Dalsgaard and Holm25, Reference Delbertmiii, Frederict and Paul58). In this experiment, a deficiency or excess of dietary Met decreased the concentration of serum IGF-I. This is similar to that previously reported by Zhang et al. (Reference Zhang and Li55), suggesting that lower serum IGF-I due to a sub-optimal Met level may suppress the transcription of IGF-I. Katsumata et al. (Reference Katsumata, Kawakami and Kaji60) reported that the potential mechanisms underlying reductions in plasma IGF-I due to an imbalance of limiting AA are (1) the suppression of post-transcriptional events in IGF-I expression and (2) differences in IGF-I clearance from plasma other than suppression of IGF-I mRNA expression. In addition, circulating concentrations of IGF-I have been demonstrated to be positively correlated with SGR (r 0·573, P<0·01), which is consistent with Zhang et al. (Reference Zhang and Li55). Thus, the decrease in serum IGF-I levels observed in the present study probably implies a reduction in fish growth. In the present study, the lower Met level group had inhibited IGF-I gene expressions in the intestinal tract, liver and dorsal muscle, which was also accompanied by lower WGR. Marked up-regulation of IGF-I transcription in the dorsal muscle of fish fed adequate Met was observed as well as higher WGR (r 0·566, P<0·01; Table 8). The gene expression of IGF-I was suppressed by a Met-deficient diet, as confirmed by previous studies on Atlantic salmon, Salmo salar (Reference Hevrøy, Elmowafi and Taylor61), rainbow trout(Reference Rolland, Dalsgaard and Holm25) and juvenile cobia(Reference Wang, Mai and Xu36), and was up-regulated with increases in Met, suggesting that, at the transcriptional level, IGF-I is triggered by dietary Met content in fish. We also found that changes in IGF-I expression were positively related to the mRNA levels of ASCT2 in the dorsal muscle of fish (r 0·652, P<0·01; Table 8). IGF-I can increase the placental mRNA expression of the neutral AA transporter ATA2 (SlC38A2)(Reference Sferruzziperri, Owens and Standen62). These results indicate that Met-stimulated IGF-I may regulate ASCT2 in the dorsal muscle at the transcription level, while the relationship between them needs further research. Moreover, IGF-I bound with its receptor in the cell membrane can activate the TOR protein via the PI3K-Akt pathway(Reference Chen, Alberts and Li63).
The TOR pathway responds not only to dietary AA but also to growth factors such as INS and IGF and then regulates cell growth(Reference Wullschleger, Loewith and Hall27). IGF-I promotes protein synthesis through mammalian TOR (mTOR) in differentiating oligodendrocytes(Reference Bibollet-Bahena and Almazan64). Similar results were also observed in the present study: there was a positive relationship between the mRNA levels of TOR and IGF-I genes in the liver (r 0·675, P<0·01) and dorsal muscle (r 0·518, P<0·05; Table 8), implying that IGF-I mRNA may participate in protein turnover by the TOR gene, which is centrally involved in growth regulation. In addition, the mRNA level of TOR and phosphorylation level of TOR on Ser2448 in the dorsal muscle of fish fed 1·24 % Met were significantly higher than those fed other Met levels. These results are consistent with previous findings on rainbow trout(Reference Belghit, Skibacassy and Geurden31) and turbot(Reference Jiang, Bian and Zhou32), showing that the mRNA and phosphorylation level of TOR was up-regulated by the optimum Met concentration. The phosphorylation of S6K on Ser371 in the dorsal muscle of fish fed 0·72 % Met was significantly lower than that in fish fed 1·86 % Met, while we failed to detect any significant change in the phosphorylation of 4E-BP1, which is similar to a previous report on rainbow trout(Reference Belghit, Skibacassy and Geurden31). Such a discrepancy between the phosphorylation levels of these two proteins (S6 and 4E-BP1) has already been observed in the liver of rats in response to dietary Met intake(Reference Sikalidis, Mazor and Kang65) and highlights the complexity of the signalling network involved in the regulation of the activation of these translation initiation factors. These results suggest that the capacity for regulating protein synthesis according to dietary Met level might be mediated by the TOR/S6K signalling pathway via IGF-I. On the other hand, a potential relationship between hepatic TOR and AA transporters (ASCT2 and B0AT1) was observed in the present study, supporting the hypothesis that Met-regulated TOR signalling might be sensed by these genes. Previous reports indicate that PI3K/Akt/mTOR signalling pathways play a critical role in modulating ASCT2 expression in porcine jejunal epithelial cell line IPEC-J2(Reference Zhang, Ren and Zeng24), ASCT2 silencing by the inducible antisense RNA system leads to suppression of mTOR signalling to p70-S6K and 4E-BP1(Reference Fuchs and Bode18). These results collectively establish a reciprocal regulatory connection between TOR and ASCT2. However, the reasons for the correlation between TOR and AA transporters at protein level in fish remain unclear, and further study of the activity of the proteins in this cascade is needed.
Conclusions
The straight broken-line analysis of WGR against dietary Met level indicates that juvenile cobia get the better growth at dietary Met 1·24 % (of DM), corresponding to 2·71 % dietary protein. Optimal Met supplementation in a low-fishmeal diet increased cobia growth through a mechanism that could be partly attributed to Met’s ability to affect the TOR/S6K signalling pathway by enhancing ASCT2 and IGF-I transcription in cobia dorsal muscle. Our results also suggested that Met-stimulated IGF-I may also regulate ASCT2 expression in cobia dorsal muscle, while the relationship between them needs further research. Sub-optimal Met-induced TOR signalling in cobia liver may negatively feedback regulate AA transporters at the transcription level.
Acknowledgements
We wish to extend our sincere appreciation to Yong Guo and Zipei Su for their assistance in the experiment.
This research was supported by the Natural Science Foundation of China (grant number 31402310) and the China Agriculture Research System (grant number CARS-47).
The authors’ contributions are as follows: S. C. and B. T. designed the study. X. D. and S. Z. purchased the feed ingredients and analytical reagents, respectively. Y. H. carried out the animal feeding trial and sample collection. H. L. and Q. Y. participated in the interpretation of the results. F. H. and D. L. contributed to the sample collection and data analyses. Y. H. wrote the manuscript; S. C. had primary responsibility for the final content of the manuscript. All authors read and approved the final version of the manuscript.
The authors declare that there are no conflicts of interest.
Ethical approval
All applicable international, national, and/or institutional guidelines for the care and use of animals were followed. All procedures performed in the present study involving animals were done so in accordance with the ethical standards of the institution at which the present study was conducted.
Supplementary material
For supplementary material referred to in this article, please visit https://doi.org/10.1017/S0007114519001648


