


Zn status is currently assessed by measuring the concentration of Zn in plasma or serum. Despite frequent use for the assessment of Zn status at the population level, circulating concentrations of Zn are considered a poor indicator of Zn status(Reference King1–Reference Wood3). The lack of a specific, responsive and reliable indicator of Zn status is a substantial barrier to the development of targeted nutritional interventions and human health, as an estimated 20 % of the world’s population (about 1·1 billion people) is a risk for inadequate Zn intake(Reference Wessells, Singh and Brown4–Reference Kumssa, Joy and Ander6). Thus, various alternative biomarkers have been considered (reviewed in Lowe et al. (Reference Lowe, Fekete and Decsi7)). One potential alternative is assessing expression of Zn-binding and Zn-transporting proteins. These proteins control Zn homoeostasis in response to fluctuations in Zn intake and thus their measurement in circulating blood cells may be an effective means to assess Zn status.
Metallothioneins (MTs) are small, cysteine-rich, cytosolic Zn-binding proteins. In mammals, four tandemly clustered MT genes (MT1, MT2A, MT3 and MT4) have been identified. Expansion of the MT1 gene in humans has led to the identification of a total of thirteen paralogs (MT1A-J, MT1L, MT1M and MT1X) five of which are predicted to be no longer active forms (MT1C, MT1D, MT1I, MT1J and MT1L). MT1 and MT2 are the major isoforms and are expressed ubiquitously, while MT3 and MT4 are minor isoforms found in specialised cells such as neurons and stratified squamous epithelium, respectively. MTs increase in response to extracellular Zn and are degraded when MT-bound Zn is released in low Zn conditions(Reference Langmade, Ravindra and Daniels8). MT expression is induced by Zn through binding of Zn to the Zn-finger transcription factor, metal-regulatory transcription factor 1, which binds to metal-responsive elements in the promoter of the MT gene(Reference Heuchel, Radtke and Georgiev9).
Twenty-four Zn transporters have been described in mammals and can be divided into two distinct families: the Zrt-, Irt-like protein (ZIP) (solute carrier family (SLC) 39A1-14) family of Zn importers, which function to import Zn into the cell or transport Zn from within a subcellular compartment into the cytoplasm, and the Zn Transporter (ZnT, SLC30A1-10) family of Zn exporters, which function to export Zn out of the cell or transport Zn from the cytoplasm into subcellular compartments. Expression and localisation of Zn transporters are tissue- and cell-type specific(Reference Hennigar and Kelleher10). Similar to MTs, some Zn transporters, such as ZnT1(SLC30A1)(Reference Langmade, Ravindra and Daniels8), ZnT2 (SLC30A2)(Reference Guo, Lichten and Ryu11) and ZIP10 (SLC39A10)(Reference Lichten, Ryu and Guo12), also contain metal-responsive elements that respond to Zn. In addition, other Zn transporters, such as ZnT5 (SLC30A5)(Reference Coneyworth, Jackson and Tyson13), contain Zn-responsive elements in their promoters(Reference Zhao, Butler and Rodgers14), suggesting additional mechanisms by which Zn may regulate Zn transporter expression.
Previous studies have examined the utility of MT and/or Zn transporter expression in various blood cell types as biomarkers of Zn status(Reference Allan, Hawksworth and Woodhouse15–Reference Thomas, Bailey and Kauwell30). A recent systematic review of these studies determined that MT mRNA in leucocyte subtypes may be a more reliable and sensitive indicator of Zn exposure in healthy individuals than plasma Zn or MT mRNA in cells from the erythroblast lineage(Reference Hennigar, Kelley and McClung31). However, limitations of these studies include few having distinguished between MT isoforms and subtypes and few having determined Zn transporter expression. Whether specific MT isoforms or subtypes, or expression of Zn transporters, could provide more reliable and sensitive measures of Zn status remains unknown. Thus, the objective of this study was to determine the reliability and sensitivity of MT isoforms and subtypes and Zn transporter genes in peripheral blood mononuclear cells (PBMCs) to changes in Zn exposure.
Methods
Cell culture
Normal, human PBMCs (PCS-800-011) were purchased from American Type Culture Collection. Cells were cultured in RPMI-1640 (American Type Culture Collection) alone (control, 0 µm ZnSO4) or RPMI-1640 with 10 µm ZnSO4 (0·37 mg elemental Zn), 50 µm ZnSO4 (1·83 mg elemental Zn) or 50 µm ZnSO4 and 5 µm N,N,N′,N′-tetrakis (2-pyridylmethyl)ethylenediamine (TPEN, Sigma-Aldrich). TPEN is a membrane permeable metal chelator with a higher metal-binding constant (KZn = 1015·58/m) than MT (KZn = 3·2 × 1013/m). The Zn concentrations were chosen to represent a modest and large fluctuation in circulating concentrations of Zn(Reference Hess, Peerson and King32). At 24 h later, cells were collected in TRIzol® (Life Technologies) and stored at –80°C.
Human subjects
Volunteers were part of a larger study determining the effects of consuming a diet of military food rations on gut microbiota composition(Reference Karl, Armstrong and McClung33). The study conformed to the principles of the Declaration of Helsinki and was approved by the Institutional Review Board at the U.S. Army Research Institute of Environmental Medicine (USARIEM) and registered at www.clinicaltrials.gov as NCT02423551. Healthy men and women aged 18–61 years with a BMI ≤ 30 kg/m2 were recruited. Exclusion criteria included antibiotic use, not willing to cease dietary supplements, vegetarian diet, history of gastrointestinal disease, use of non-steroidal anti-inflammatory drugs, actively trying to lose weight, pregnant/lactating, not willing to avoid strenuous activity or alcohol consumption 24 h prior to testing and prior blood donation (<8 weeks).
Subjects (n 54) completed the 2014 Block FFQ (NutritionQuest) at baseline to assess habitual Zn intake(Reference King, Brown and Gibson34). The Block FFQ is an extensive 127-item questionnaire developed from analysis of two waves of National Health and Nutrition Examination Survey (NHANES) dietary recall data. The nutrient and food group analysis database was developed from the United States Department of Agriculture’s Food and Nutrient Database for Dietary Studies (FNDDS 5.0), the Food Pyramid Equivalents Database and the Nutrient Database for Standard Reference (SR27). Fasted blood samples were collected at baseline in the early morning in BD Vacutainer Cell Preparation Tubes. Plasma and PBMC were isolated by centrifugation according to the manufacturer’s instructions. PBMC pellets were collected in TRIzol® and PBMC, and plasma was stored at –80°C. Plasma Zn concentrations were determined from plasma isolated from BD Vacutainer Cell Preparation Tubes and determined by inductively coupled plasma MS (ICP-MS) (Thermo Fisher Scientific X Series 2)(Reference Taylor35).
Gene expression
RNA was isolated, and cDNA was synthesised as described previously(Reference Andree, Kim and Kirschke16). Real-time relative RT-PCR was performed with TaqMan Gene Expression Assays (Life Technologies) and run on a StepOne Plus real-time PCR instrument (Applied Biosystems). The programme was run for a 10 min activation step at 95°C followed by forty cycles of denaturation at 95°C for 15 s and annealing and extension at 60°C for 60 s. Primers and probes for TaqMan Gene Expression Assays are included in online Supplementary Table S1. Each sample was analysed in duplicate. For study 1, target mRNA expression was calculated using the ΔΔCt method. Fold change relative to controls was quantified using 2(–ΔΔCt) where ΔCt = CtTarget gene – CtReference gene and ΔΔCt = ΔCtTreatment – ΔCtControls. The average of 18S and ACTB was used as the reference gene, and the average ΔCt of the untreated controls was used as the calibrator. In study 2, target mRNA expression was normalised to 18S (ΔCt = CtGene – Ct18S), and gene expression was quantified using the 2(–ΔCt) comparative Ct method(Reference Schmittgen and Livak36).
Data analysis
All participants in the larger study(Reference Karl, Armstrong and McClung33) with PBMCs were used for data analysis; a formal power calculation was not calculated. In study 1, the mRNA expression of all MT isoforms and subtypes and all Zn transporters determined in PBMCs cultured with Zn or TPEN ex vivo for 24 h were compared by one-way ANOVA. Post hoc significant differences were made using Tukey’s adjustment for multiple comparisons. In study 2, Pearson correlations were used to correlate Zn responsive genes isolated from PBMCs with habitual dietary Zn intake determined by FFQ. Dietary Zn, total Zn, phytate and phytate:Zn were adjusted for energy intake using the residual method(Reference Willett37). Data that were not normally distributed were log transformed. The α level for statistical significance was P < 0·05. Data were analysed using SPSS version 24 (IBM Corp) and are presented as mean values and standard deviations.
Results
Study 1
A heat map depicting relative gene expression and a table with fold changes in MT and Zn transporter expression in PBMCs exposed to Zn and TPEN ex vivo are shown in Fig. 1 and Table 1, respectively. Data used to derive the heat map can be found in online Supplementary Table S2. MT1E, MT1F, MT1G, MT1H, MT1L, MT1M, MT1X, MT2A and SLC30A1 increased with increasing concentrations of Zn and decreased with the addition of TPEN. Genes that increased with the addition of 10 μm ZnSO4 compared with control (P < 0·05) were MT1M (106·2-fold increase), MT1L (49·8-fold), MT1H (22·0-fold), MT1F (15·8-fold), MT1X (13·7-fold), MT1G (13·3-fold), MT1E (7·1-fold), MT2A (6·6-fold) and SLC30A1 (2·3-fold). Genes that increased with the addition of 50 μm ZnSO4 compared with 10 μm ZnSO4 (P < 0·05) were MT1L (4270·5-fold increase), MT1M (3958·5-fold), MT1H (858·9-fold), MT1A (598·6-fold), MT1G (388·3-fold), MT1X (219·6-fold), MT1F (192·1-fold), MT1E (143·8-fold), MT2A (69·7-fold), SLC30A1 (7·2-fold), SLC39A8 (5·8-fold) and MT1B (2·5-fold). All of the transporters that responded to Zn returned to control (MT1A, MT1B, SLC30A1 and SLC39A8) or 10 μm ZnSO4 levels (MT1E, MT1F, MT1G, MT1H, MT1L, MT1M, MT1X and MT2A) with the addition of 50 μm ZnSO4 and TPEN (P > 0·05). MT3, SLC30A3, SLC30A4, SLC30A5, SLC30A6, SLC30A7, SLC30A9, SLC39A2, SLC39A3, SLC39A4, SLC39A5, SLC39A6, SLC39A7, SLC39A9, SLC39A10, SLC39A12, SLC39A13 and SLC39A14 were detected, but were not responsive to Zn (P > 0·05). SLC30A8 was not detected in control cells but was detected in at least some of the replicates in all other treatment conditions (online Supplementary Table S2). SLC30A2 was detected in response to 50 μm ZnSO4 but no other treatment condition and SLC30A10 was only detected in one of the replicates in the control condition. MT1E, MT1F, MT1G, MT1H, MT1L, MT1M, MT1X, MT2A and SLC30A1 increased with increasing concentrations of Zn and decreased with the addition of TPEN. MT1A, MT1B, SLC39A8 and SLC39A11 increased with 50 μM ZnSO4, but not 10 μm ZnSO4. There was an overall treatment effect for SLC39A1 (P = 0·0349) but no post hoc differences. MT4 was not detected in any of the treatment conditions.
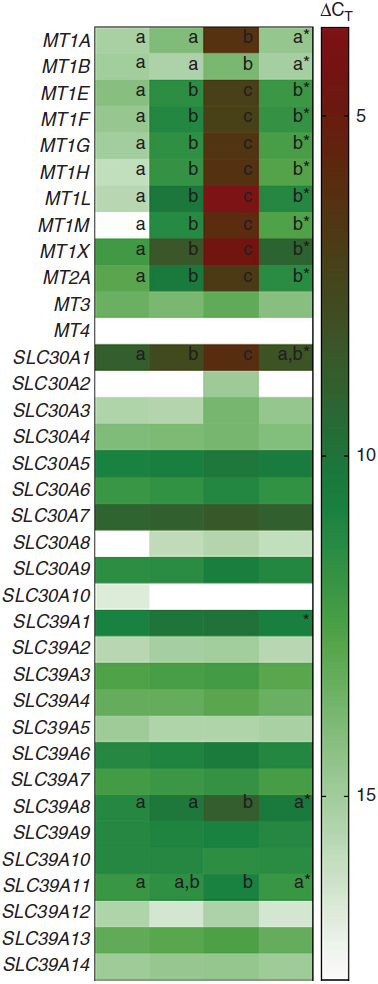
Fig. 1. Heat map of metallothionein and zinc transporter expression in peripheral blood mononuclear cells (PBMCs) exposed to zinc and N,N,N′,N′-tetrakis(2-pyridylmethyl)ethylenediamine (TPEN) ex vivo. Columns represent ΔCT values of metallothionein isoforms and subtypes and zinc transporters in control cells and cells cultured with 10 µm ZnSO4 or 50 µm ZnSO4 or with 50 μm ZnSO4 plus TPEN for 24 h. Lower ΔCT values represent greater gene expression (red) and genes not expressed are shown in white. * Significant overall P value (P < 0·05). a,b,c Unlike letters within a row indicate a significant difference (P < 0·05). Data used to derive this figure are shown in online Supplementary Table S2. CT, cycle threshold.
Table 1. Metallothionein and zinc transporter expression in peripheral blood mononuclear cells exposed to zinc and N,N,N′,N′-tetrakis(2-pyridylmethyl)ethylenediamine (TPEN) ex vivo *
(Mean values and standard deviations)
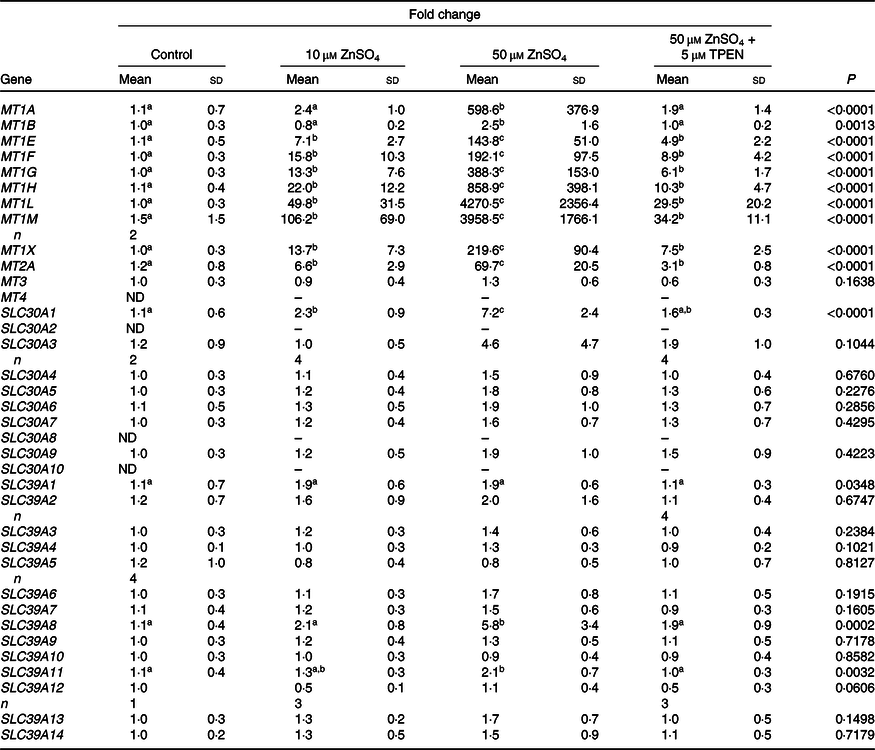
ND, not detected.
a,b,c Unlike superscript letters within a row indicate a significant difference (P < 0·05).
* Fold change of metallothionein isoforms and subtypes and Zn transporters in control cells and cells cultured with 10 μm ZnSO4 or 50 μm ZnSO4 or with 50 μm ZnSO4 plus TPEN for 24 h relative to control. n 5/treatment unless replicates within a treatment were not detected. Data are corrected for the average of 18S and ACTB. P values and superscript letters are for log-transformed data.
Study 2
Expression of MT (MT1E, MT1F, MT1G, MT1H, MT1L, MT1X and MT2A) and Zn transporter (SLC30A1, SLC30A9, SLC39A8, SLC39A10 and SLC39A11) genes that were found to be sensitive to Zn in study 1 were examined in PBMCs isolated from human subjects. Subject demographics and dietary data are shown in Table 2. Adjusted dietary Zn intakes were above the Estimated Average Requirement (EAR) for all participants (range 9–20 mg/d)(38). Of the subjects, 22 % (12/54) reported taking a dietary supplement containing Zn. Dietary phytate varied considerably between subjects (183–1371 mg/d), and phytate:Zn molar ratios indicated that diets were of good-to-medium Zn bioavailability(39). Plasma Zn concentrations were within the normal range with one female and two males having concentrations less than established cut-offs (<70 or 74 μg/dl or <10·7 or 11·3 μmol/l, respectively(Reference Hotz, Peerson and Brown40)).
Table 2. Volunteer demographics and dietary data*
(Mean values, standard deviations and ranges; percentages; n 54)

* Total Zn includes dietary Zn and Zn from supplements.
† To convert values from kcal to kJ, multiply by 4·184.
‡ Values adjusted for energy intake using the residual method.
With the exception of MT1H, MT1G and MT1M, which were only detected in 26, 15 and 35 % of subjects, respectively, and are not reported, the majority of subjects expressed MT1A (93 %), MT1E (72 %), MT1F (81 %), MT1L (72 %), MT1X (83 %), MT2A (93 %), SLC30A1 (94 %), SLC39A8 (98 %) and SLC39A11 (96 %). Adjusted dietary Zn (R 0·306, P = 0·031) and total Zn (R 0·382, P = 0·006), which included the sum of Zn from diet and supplements, were positively correlated with MT2A (Table 3). Adjusted dietary phytate was positively correlated with MT1A (R 0·287, P = 0·044), and plasma Zn concentrations were negatively correlated with MT1A (R −0·279, P = 0·050) and MT2A (R −0·289, P = 0·042).
Table 3. Correlations between habitual zinc intake, plasma zinc and metallothionein and zinc transporter mRNA†
(Pearson correlation coefficients; n 54)
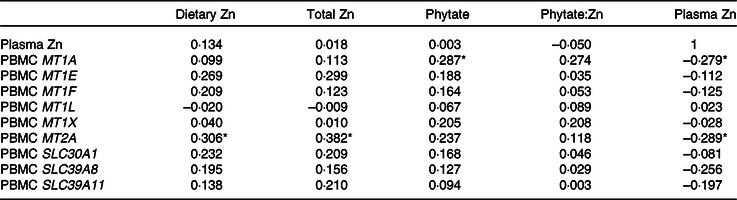
* Significant correlation (P < 0·05).
† MT1A was detected in fifty of fifty-four participants, MT1E (39/54), MT1F (44/54), MT1L (39/54), MT1X (45/54), MT2A (50/54), SLC30A1 (51/54), SLC39A8 (53/54), SLC39A11 (52/54). Gene data are log-transformed. Values for dietary Zn, total Zn, phytate and phytate:Zn adjust for energy intake using the residual method. Total Zn includes dietary Zn and Zn from supplements.
Discussion
To our knowledge, this is the first study to comprehensively examine the reliability and sensitivity of Zn exposure and depletion on all Zn transporters and MTs in PBMCs. PBMC isolated from human subjects were exposed to physiological concentrations of Zn or TPEN ex vivo to identify MT isoforms and subtypes and Zn transporter genes that responded to Zn. Candidate genes were subsequently measured in PBMCs isolated from human subjects and correlated to their habitual Zn intake. The major finding of this study was that although the majority of MT isoforms and subtypes were detected in PBMCs and were sensitive to changes in Zn, only MT2A mRNA in PBMCs reflected habitual dietary Zn intake in healthy adults. These findings further suggest that MT2A mRNA in PBMCs may be a component in determining Zn status.
Of those transporters studied, most MT isoforms and subtypes, with the exception of MT3 and MT4, were expressed in PBMCs at an appreciable level and responded to Zn. This finding agrees with previous work that demonstrated that MTs increase in response to extracellular Zn and are degraded when MT-bound Zn is released when Zn is low(Reference Coneyworth, Jackson and Tyson13). In contrast, while the majority of Zn transporters were expressed in PBMCs, few responded to Zn. Mammalian MTs are characterised by their twenty invariant cysteines. These cysteine residues are responsible for binding and sequestering Zn through their thiol (-SH) moieties and bind up to seven Zn atoms (three Zn atoms in the β domain and four Zn atoms in the α domain). Excess Zn is thought to displace Zn from MT(Reference Waldron, Rutherford and Ford41). Free Zn can then fill Zn fingers within the DNA-binding domain of cytosolic metal-regulatory transcription factor 1(Reference Bittel, Dalton and Samson42,Reference Koizumi, Suzuki and Ogra43) . Holo-metal-regulatory transcription factor 1 can then translocate to the nucleus where it binds to metal-responsive elements in the promoter of the MT gene(Reference Heuchel, Radtke and Georgiev9). A consensus sequence for the central core of the metal-responsive element (TGCRCNC, were R is an A or G and N is any nucleotide) has been identified by examining a host of known metal-responsive genes(Reference Günther, Lindert and Schaffner44). Although MTs are capable of binding other essential (e.g. Cu) and non-essential (e.g. Cd) metals, MT-bound Zn is thought to be the predominant form of MT in human tissue. For example, MT is not present in the livers of Zn-deficient rats, even when liver Cu concentrations are high(Reference Sato, Mehra and Bremner45). Importantly, metal-regulatory transcription factor 1 DNA-binding activity is reversibly activated in response to changes in free Zn concentration(Reference Dalton, Bittel and Andrews46).
In the present study, MT2A was highly expressed in PBMCs, was sensitive to changes in Zn exposure and depletion and was positively correlated to habitual Zn intake in human subjects. These findings are consistent with that of Cao & Cousins(Reference Cao and Cousins19) and Cao et al.(Reference Cao, Bobo and Liuzzi20) who supplemented male subjects with placebo or 15 mg Zn/d (as ZnSO4) for 10 d. PBMC MT2A mRNA increased with Zn supplementation at the earliest time point measured (day 2) and remained elevated until supplementation ceased when levels returned to baseline. Chu et al.(Reference Chu, Foster and Ward21) provided female and male subjects with no treatment or 22 mg Zn/d for 21 d and determined mRNA expression of MT1A, MT2A, SLC30A1, SLC30A5, SLC30A6, SLC30A7, SLC39A1, SLC39A3, SLC39A7, SLC39A8, SLC39A10 and SLC39A14 in PBMCs. MT2A was the only gene affected by Zn supplementation and increased with Zn supplementation on day 2 but returned to baseline on days 7–21. Conversely, Ryu et al.(Reference Ryu, Langkamp-Henken and Chang25) determined the expression of MT1/2, SLC30A1, SLC30A4, SLC30A5, SLC30A6, SLC30A7, SLC39A1, SLC39A3, SLC39A5, SLC39A6, SLC39A8, SLC39A10 and SLC39A14 mRNA in PBMCs isolated from male subjects fed a Zn-depleted diet for 10 d. In this study, a common amplicon region was identified and a combination of two forward primers, two reverse primers and two TaqMan probes was used to amplify MT1H, MT1H-like, MT1G, MT1L, MT1E, MT1A and MT2. Expression of MT1/2, SLC30A1, SLC30A4 and SLC30A5 decreased with Zn depletion by day 10. These findings indicate that MT2A mRNA in PBMCs is sensitive to Zn supplementation and depletion and that detection of MT2A mRNA in PBMCs may be a reliable marker to assist in the detection of Zn status in a clinical or field setting.
In contrast to MTs, there was a lack of consistency in the Zn transporter genes. While the majority of Zn transporters were expressed in at least one of the treatment conditions, few responded to Zn supplementation and/or depletion. This may be expected as MTs, SLC30A1 and SLC30A2 contain metal response elements in their promoters that respond to Zn through metal response element-binding transcription factor-1(Reference Ryu, Langkamp-Henken and Chang25). While SLC30A2 was only expressed in response to higher concentrations of Zn, SLC30A1 was highly expressed in PBMCs and increased with increasing concentrations of Zn and declined with Zn depletion. This is consistent with findings from Overbeck et al.(Reference Overbeck, Uciechowski and Ackland47) who found that SLC30A1 expression increased incrementally in cells cultured with 15 and 30 μm Zn and decreased slightly with TPEN. Despite being Zn responsive, SLC30A1 mRNA was not correlated with habitual Zn intake.
The finding that plasma Zn was not correlated with habitual dietary Zn intake in the current study is consistent with most studies that show that plasma Zn does not respond consistently to changes in dietary Zn(Reference Hennigar, Kelley and McClung31). Zn is required for multiple aspects of general metabolism and thus complex systems tightly regulate Zn homoeostasis. When Zn intake is reduced, there is a reduction in endogenous losses to conserve Zn(Reference Baer and King48) and Zn is mobilised from small, rapidly exchangeable pools in the plasma, liver and possibly bone(Reference Miller, Hambidge and Naake49,Reference Zhou, Canar and Erdman50) . Thus, changes in plasma and tissue Zn are relatively insensitive to changes in dietary Zn because of mechanisms that tightly control Zn homoeostasis. Interestingly, MT2A and MT1A mRNA in PBMCs were negatively correlated with plasma Zn in study 2. Kwon et al.(Reference Kwon, Kountouri and Mayer51) found a similar negative correlation between mononuclear cell MT2A mRNA and plasma Zn in a larger cohort of 50–80-year-old males and females from South Korea (n 110). One possible explanation that the authors suggest is that over time the presence of adequate MT2A protein levels may feedback to down-regulate gene expression(Reference Kwon, Kountouri and Mayer51).
The strengths of this study are that it is the first to comprehensively examine MT and Zn transporter expression in PBMCs. Limitations include the homogenous study population and measurement of dietary intake by FFQ at one timepoint. Plasma Zn concentrations should be interpreted with caution as plasma was isolated from BD Vacutainer Cell Preparation Tubes. These tubes are not trace element-free and may be a source of Zn contamination; however, any variability due to contamination would likely be equally distributed across participants. Further, this study assessed the mRNA expression of MT and Zn transporters, which precludes comparison of the relative concentrations clinically. Reference material for MT concentrations needs to be developed in order to compare MT reliably across different immunoassays. Other questions such as whether the different proportion of blood cell subtypes in peripheral blood, which may vary across individuals(Reference Cao and Cousins19), affects the sensitivity to Zn supplementation and depletion should be assessed. Future studies should examine the expression of MT and Zn transporters in PBMCs in diverse populations, adolescents, children and individuals with disease. Further, controlled feeding studies in humans are required to determine whether the identified genes respond to short- and long-term changes in dietary Zn intake and can be used to predict Zn status.
Collectively, these data may help inform the development of a multivariable model to provide a comprehensive assessment of Zn status while minimising the influence of confounders on any single variable. Other nutrients use multiple indicators and a multivariable model. Thus, the combination of MT (perhaps in conjunction with plasma Zn) may provide a more comprehensive view of Zn status while minimising the influence of any single variable. This is important as MT and Zn transporter expressions are affected by various conditions (e.g. inflammatory agents, free radicals, glucocorticoids and pharmacological agents(Reference Sato, Mehra and Bremner45,Reference Dalton, Bittel and Andrews46) ), which would affect the interpretation.
Acknowledgements
Approved for public release; distribution is unlimited. The opinions or assertions contained herein are the private views of the authors and are not to be construed as official or as reflecting the views of the Army or the Department of Defense. Any citations or commercial organisations and trade names in this report do not constitute an official Department of the Army endorsement of approval of the products or services of these organisations.
Supported in part by the U.S. Army Medical Research and Material Command and appointment to the U.S. Army Research Institute of Environmental Medicine administered by the Oak Ridge Institute for Science and Education through an interagency agreement between the U.S. Department of Energy and the U.S. Army Medical Research and Material Command.
S. R. H., H. L. M., J. P. K. and J. P. M. conceived the study; S. R. H. and J. P. M. designed the experiments; J. P. K., N. J. A. and H. L. M. coordinated volunteer visits and assessed dietary intake; S. R. H., A. M. K. and B. J. A. conducted the experiments; S. R. H., C. E. B. and J. P. K. analysed the data; S. R. H. wrote the manuscript with input from all authors. S. R. H. had primary responsibility for final content.
The authors declare that there are no conflicts of interest.
Supplementary material
For supplementary material referred to in this article, please visit https://doi.org/10.1017/S0007114520002810


