INTRODUCTION
Demand for emergency medical services (EMS) has been increasing in countries experiencing population aging.Reference Hagihara, Hasegawa and Hinohara 1 - Reference McArthur, Gregersen and Hagen 3 Older individuals are susceptive to illnesses and often suffer from multiple, complex conditions requiring emergency services.Reference Shah, Glushak and Karrison 4 , Reference Kennelly, Drumm and Coughlan 5 Older individuals may often use emergency health services – including EMS and emergency departments (EDs) – for conditions less urgent than what is typically defined as an emergency.Reference He, Hou and Toloo 6 - 8 Some recent studies in the province of Nova ScotiaReference Goldstein, Jensen and Carter 9 , Reference Ross 10 found that a higher proportion of calls for EMS by the older population (65 years of age and older) resulted in non-transport to an ED or non-intervention, less acute conditions or lower urgency compared to younger cohorts, and a higher proportion of EMS use by patients with a low-acuity level in rural areas.
The use of emergency services, such as paramedics/EMS and EDs, has been highlighted as possible markers for inadequate access to primary care.Reference Tangherlini, Pletcher and Covec 7 , Reference Ross 10 The evolving scope of practice for paramedics highlights a recognition that a coordination of primary care and EMS has the potential to provide a more cost-effective means to sustain access overall.Reference Jensen, Travers and Marshall 11 - Reference Brown 14
EMS and emergency services at hospitals are costly to the health care system.Reference Solberg, Edwards and Chidester 15 - 17 Additionally, per-service costs of EMS in rural areas are said to be higher than in urban areas due to longer distances that EMS needs to travel and higher number of trips that need to be made without patients.Reference McArthur, Gregersen and Hagen 3 Then, the reduction of EMS use by individuals with less urgent or chronic conditions, especially in rural areas, can be an important strategy to slow down increases in service demand,Reference Jensen, Marshall and Carter 18 helping to better control the escalating cost on overall health care systems and pressure on crowded EDs.Reference Enard and Ganelin 19
There is, however, a dearth of evidence substantiating geographic patterns of EMS use and specifically, in this case, non-emergency or low-urgency use of emergency medical services (LUEMS). High incidence rates of LUEMS, in particular geographic areas, would suggest a potential lack of alternative services catering to low-urgency conditions in the location, although it may well not be the sole factor. Such findings could add to the supporting argument that the services catering to the management of chronic conditions need to be increased in the identified geographic locations.
The objective of this exploratory study was to clarify the understanding of EMS use through geographic analysis, using Nova Scotia provincial EMS data for 2011 and 2012. Specifically, we asked the following three questions:
1) What is the LUEMS rate by age?
2) What is the LUEMS rate by rurality?
3) Is the relationship between LUEMS rate and age different by rurality?
Additionally, we examined the geographic patterns of LUEMS rates at the community level across the province.
METHODS
Data
We obtained EMS transport data from Emergency Health Services Nova Scotia (EHSNS), under the ethics review required by the local district health authority (CDHA-REB-RS/2014-2015). EHSNS is the provincial agency that administers EMS for all of the province. Nova Scotia has a population just under 1 million, and EHSNS receives approximately 70,000 calls every year. The data covered 2 years (January 1, 2011 to December 31, 2012). The data contained all of EMS transports to EDs at hospitals throughout the province, and they included service users’ age, gender, and latitude and longitude locations where they were picked up.
The data also included the paramedic’s clinical impression and Canadian Triage and Acuity Scale (CTAS), generally assigned as they depart the scene. CTAS classifies the acuity levels of patients into five groups: 1) Needing resuscitation; 2) Emergency; 3) Urgent; 4) Less urgent; and 5) Non-urgent.Reference Terashima and Carter 20 CTAS classes 4 or 5 by paramedics were considered in this study as LUEMS. CTAS was used to classify less acute conditions in previous studies, although the limitation of simplistically interpreting the scales to infer that CTAS 4 and 5 does not require emergency services has also been acknowledged.Reference Field and Lantz 21 , Reference Vertesi 22
The data did not include non-transports (the cases where EMS responded but did not transport the patient to a hospital). Because non-transports could also account for significant time spent by EMS agencies, it is certainly important to examine these calls as well, but we believe that these calls may be fundamentally different in regard to the study question, the frequency, and impact of LUEMS and should be analysed separately.
Based on the pick-up location, each EMS response was assigned a community, using the community definition and geographic boundary map previously created by the provincial government. 23 The community definition divides the province into 311 entities. Among them, 30 were identical to Statistics Canada’s definition of Indian reserves (IR), and 5 were national or provincial parks.
Although a dichotomous comparison of rurality (urban versus rural) can be informative when we can make a general assumption that rural communities are relatively homogeneous, Canadian rural geography can be diverse, and levels of geographic distances to hospitals and other health care services can differ greatly. Therefore, we compared six settlement types previously developed by a team member.Reference Terashima, Guernsey and Andreou 24 These types were 1) Metro Halifax; 2) Metro fringe and satellite urban centres; 3) Mid- and small-size towns; 4) Villages; 5) Sparse settlements; and 6) IR. With an exception of IR communities – which include both urban and rural – these settlement types generally accord with characteristics along the urban-rural continuum.
Analysis
The statistical analyses were performed using SAS 9.4 (SAS Institute, Cary, NC). The data were grouped by three age cohorts: 1) <25 years of age; 2) 25-64; and 3) 65+ years of age. To answer the first question, What is the LUEMS rate by age?, we compared the distribution of incidence rates of LUEMS (proportion of LUEMS among all uses) by age cohort at the community level. For the second question, What is the LUEMS rate by rurality?, we further compared the community-level incidence rates across levels of rurality. For the third question, Is the relationship between LUEMS rate and age different by rurality?, we compared the rates by age, stratified by rurality, in a box plot. Then we mapped the community-level incidence rates of LUEMS for the respective age cohorts for comparison. The maps were created using ArcGIS 10.2 (ESRI, Redlands, CA).
RESULTS
LUEMS incidence rates by age
In total, there were 116,743 EMS records in the data for 2011-2012. Out of the records, 3,136 (2.7%) were excluded due to missing information on age, gender, pick-up location, or CTAS classification. These missing records were distributed to 116 (out of 311) communities, and they accounted for a very small (1% or less) proportion of the total record counts at the community level, except for one community. This one community had over 66% with missing age, gender, or CTAS information, thus we did not present the result for this community on the map. The gender breakdown of the remaining 113,607 records was 53.5% female and 46.5% male.
Table 1 shows the summary distribution of the population by age group and rurality, stratified by gender. Overall, close to 60% of the population are in the 25-64 years age group for both females and males, and about 17% are age 65 years and older. Close to a half of the population reside in a gradient of rural settlements (mid- and small-size town, village, and sparse settlement categories). Communities in the IR category can be urban or rural. There was no prominent difference in the distributions by gender.
Table 1 Summary distribution of the population by age group and rurality, stratified by gender
IR=Indian reserves.Source: National Household Survey (2011). Nova Scotia Community Counts.
Table 2 presents the distribution of EMS uses, LUEMS as well as the LUEMS rates for both genders combined. Although not shown, 36.7% for females and 33.3% for males of EMS uses were LUEMS. Nearly half of the EMS transports were age 65 and older (55,764 or 27,882 on average per year). The total population of the province according to the 2011 National Household Survey 2011 was 914,108, of which 16.7% (152,431) were age 65 years and older. Thus, the counts of EMS use by the older age cohort are equivalent to 18% of the age group population – roughly 1 in 5 within the older cohort – in the province. In comparison, the EMS transports <25 years of age and 25-64 years of are equivalent to about 3% and 4.2% of the respective age population cohorts. There were lower percentages of female EMS transports among<25 years and 25-64 years of age groups, whereas a higher percentage of 65+ of age transports were female, likely reflecting a higher proportion of females in the cohort (data are not shown).
Table 2 Distribution of EMS use, LUEMS, and LUEMS rates by age (two-year cumulative)
EMS=emergency medical services; LUEMS=low-urgency use of emergency medical services.Source: EMS transport data (Emergency Health Services Nova Scotia) (2011-2012).
Although the frequencies of all EMS transports and LUEMS are 4 to 5 times higher among the older cohort than the younger cohorts for both genders, the incidence rates of LUEMS were not substantially different across the age groups (see Table 2).
LUEMS incidence rates by rurality
On the average, about 35% of the transports were LUEMS (see Table 2; Table 3). Table 3 shows the EMS use, LUEMS, and LUEMS incidence rate distribution by rurality. The patterns of rates were fairly similar between genders; therefore, only the combined rates are presented. Over 30% of all EMS transports were picked up in the Halifax metro area – the most urban area, including the province’s capital – and about 27% were picked up in metro fringe and satellite town communities. A small portion of transports (2.7%) accounted for users picked up in the IR communities. Urban transports were overrepresented compared with their proportion of the population in the province. This may be partially due to that many of them were made during the daytime from near the service users’ work – often in an urban centre – rather than where they live.Reference Terashima and Carter 20
Table 3 Distribution of EMS use, LUEMS, and LUEMS rates by rurality (two-year cumulative)
IR=Indian reserves.Source: EMS transport data (Emergency Health Services Nova Scotia) (2011-2012).
LUEMS rates in the metro is substantially lower than in other settlement types, nearly half (20.3%) of the next lowest rate in the mid- and small-size town category (39.5%). Other settlement types have relatively similar rates, just above 40% range. The IR category had somewhat higher rates of 52%.
LUEMS incidence rates by age and rurality
Table 4 shows the distribution of LEUMS by age and rurality. The age group with the highest incidence rates varied with rurality. For instance, the youngest cohort had the highest rates in metro and IR categories, whereas the older cohorts had the highest in the other four categories. None of the rurality categories had the middle-age group as the highest rate group. Even after breaking down to age groups, LUEMS rates were substantially low for all ages in metro compared with other age or rurality categories.
Table 4 Distribution of EMS use, LUEMS, and LUEMS rates by age and rurality (two-year cumulative)
The box plot (Figure 1) further presents the comparison of community-level LUEMS incidence rates by age and rurality, also showing the quartiles and 95% confidence intervals. The distribution patterns were similar between genders (not shown). The median incidence rates for non-metro-type communities were roughly twice as high as those communities in the metro. The median incidence rates generally increased along the rurality gradient. An exception was metro fringe and satellite town communities, which had similar median rates than mid- and small-size town and village groups). Not only the older cohort, but also <25- and 25- to 64-year-old cohorts showed increases in LUEMS incidence rates along the rurality spectrum, again with the exception of the metro fringe and satellite town category.
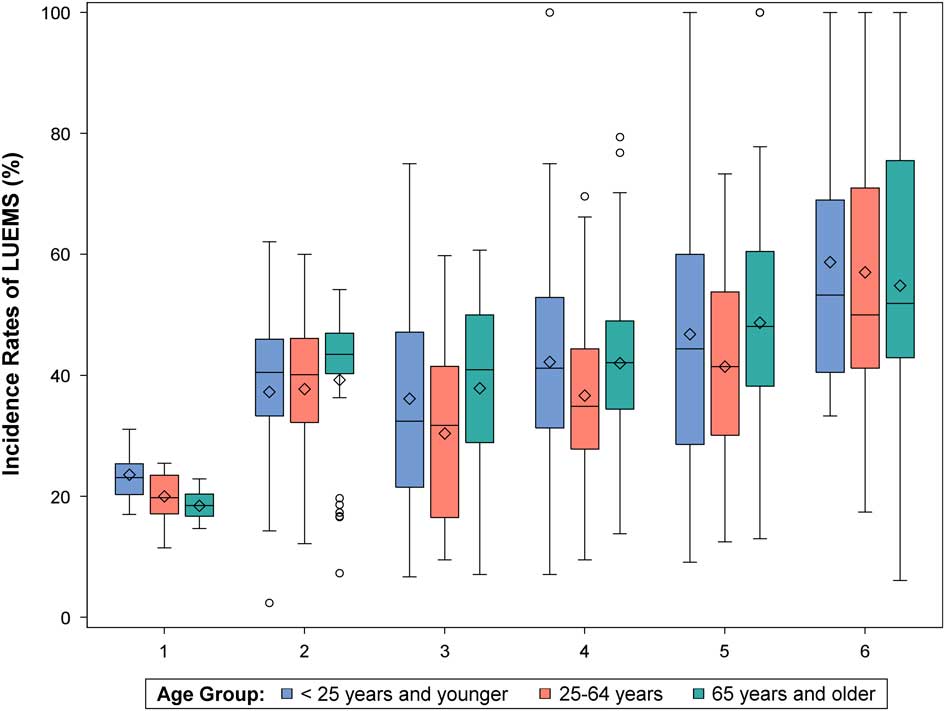
Figure 1 LUEMS rates at the community level by age groups and rurality. 1) Halifax metro, 2) Metro fringe and satellite towns, 3) Mid- and small-size towns, 4) Villages, 5) Sparse settlements, 6) Indian reserves (IRs). Source: EMS transport data (Emergency Health Services Nova Scotia) (2011-2012).
Geographic locations of high LUEMS incidence rates
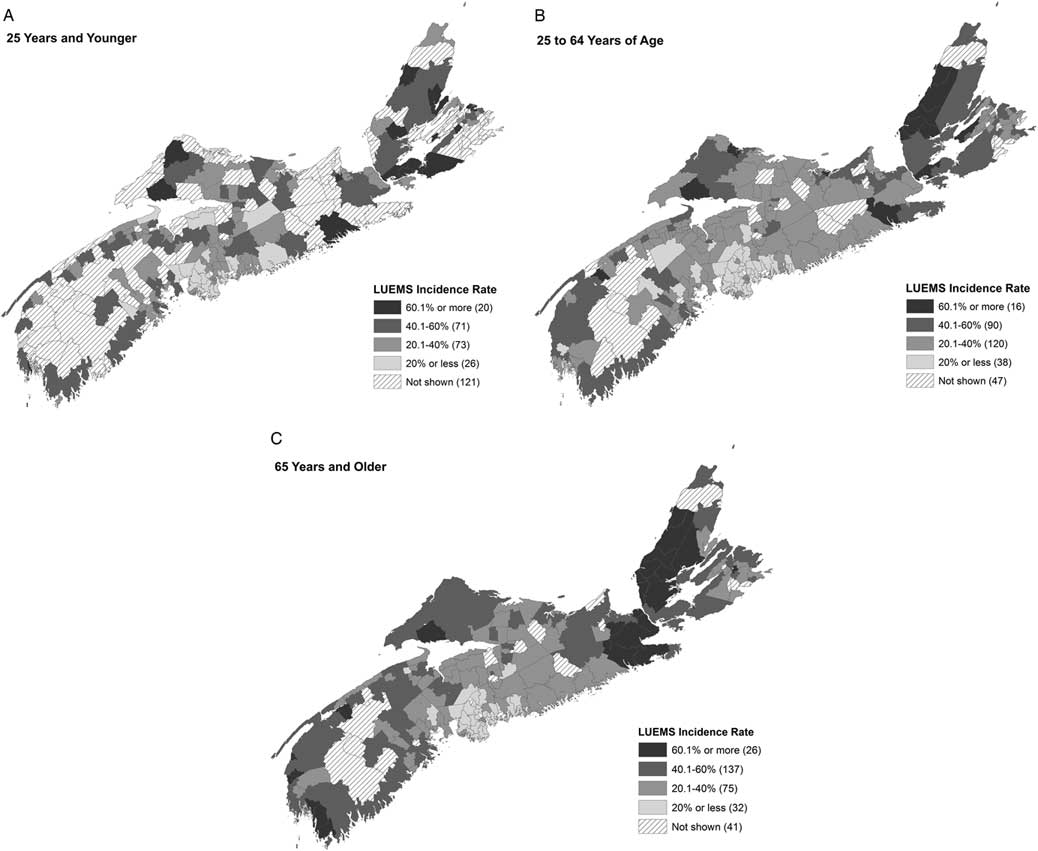
The following series of maps (Figures 2, A–C) show the geographic distribution of the LUEMS incidence rates by the three age cohorts at the community level. Stripe-patterned communities either had very small number of transports (n<10) in 2011-2012 and the rates were not calculated, or data were suppressed due to high proportions of missing data.

Figure 2 A–C. Geographic distribution of LUEMS incidence rates for <25 years and younger, 25-64 years of age, and 65 years and older. Stripe-patterned communities either had very small number of transports (n<10) in 2011-2012 and the rates were not calculated, or data were suppressed due to high proportions of missing data. Source: EMS transport data (Emergency Health Services Nova Scotia) (2011-2012).
Clusters of high LUEMS rates were most clearly seen in Cape Breton Island, especially for the older cohort. Additionally, northeastern and southwestern tips of the mainland Nova Scotia and communities bordering with the province of New Brunswick had some high rates. These communities tend to be farthest away from the province’s capital. Over a half of the number of communities (163 of 311) had higher than 40% LUEMS rates for the oldest cohort.
DISCUSSION
This study examined the geographic distribution of incidence rates of LUEMS in Nova Scotia by age and rurality, using 2 years’ worth of EMS transport data. Much evidence of the patterns of emergency health services use comes from EDs at hospitals, and little evidence exists on geographic differences in LUEMS. Our findings shed some light on the question of whether LUEMS was a phenomenon specific to the older age cohort and whether the high incidence rates of LUEMS are disproportionately seen in rural areas or specific geographic regions. The initial hypothesis was that LUEMS incidence rates by the older cohort would increase with an increasing level of rurality, because health care services catered more to the management of chronic conditions are less available in more rural communities.Reference Brown 14 , Reference Lau and Morse 25
Our findings showed that high LUEMS rates are not necessarily indicative of a unique “behaviour” of the older population to use EMS for non-acute conditions,Reference Lishner, Rosenblatt and Baldwin 26 but rather they depend on geographic location (or rurality). The LUEMS rates increased with increasing levels of rurality, and with all age groups. It appears that a need for alternative services for low-urgency conditions for all ages in rural communities in general warrants a close attention. Despite the weaker relationships with age than we initially anticipated, our results do not necessarily dismiss the premise that health care services catering for the older population in rural communities could lead to cost-effectiveness in the health care system. In non-metro communities (excluding IRs), there were about six times more LUEMS users in the 65+ years of age cohort than those in the metro (see Table 4), whereas there are only about three times the older population in these non-metro communities than in the metro (data not shown). These LUEMS users in the older cohort represent five times more individuals in non-metro communities than the youngest cohort (18,705 v. 3,342). Thus, an investigation of possible intervention programs catering to the older population in non-metro communities still appears as a worthwhile endeavour, while also furthering our understanding of LUEMS use by younger cohorts.
While LUEMS incidence rates were increasingly higher as the level of rurality increased, there was also a distinct geographic pattern – the high LUEMS incidence rates appeared to cluster in regions farthest away from the province’s capital, particularly on the north and northeastern ends of the province. This may have to do with the differences in general socioeconomic conditions, which tend to be lower in these areas and likely have lower rates of car ownership.
Our exploration in geographic patterns of LUEMS points to the need for further investigations in what factors are present (or not present) in different geographic locations. For example, proximity to hospitals with EDs may influence individuals’ decisions to use EMS.Reference Svenson 27 This could be part of the reason that LUEMS rates are high in metro fringe and satellite urban towns – where they are proximal to larger hospitals and have relatively lower access to family physicians, for instance. While the proximity to hospitals with ED is even greater in the metro, having higher access to family physicians and alternative services may counter the incentive in the metro to resort to EMS. We compared the LUEMS incidence rates with the locations of hospitals, but the results were inconclusive. Some small hospitals in non-metro areas may not provide all-hour services and full-time staff.Reference Ross 10 Detailed information on the type and levels of services that hospitals provide would be necessary to discern their relationship with the population’s tendency to use EMS in various geographic settings.
Lack of public transportation in rural communities is a common challenge in using many different types of services for individuals without a car.Reference Shah, Glushak and Karrison 4 Rural residents, particularly older residents, may be disproportionately affected by not having affordable, regularly scheduled public transportation system near their homes.Reference Imran 28 In Nova Scotia, there are very few transport options other than private vehicles outside of the metro. 29
This work has certain limitations, some of which have been alluded to previously. We used CTAS as a marker of low-urgency conditions, knowing that it does not fully represent ambulatory care sensitive conditions (ACSC). Work is ongoing to develop a method to understand which EMS uses might be truly ACSC.Reference Brown, Carter and Goldstein 30 These data represent one province only, and the relationships with LUEMS and rurality may be different in other provinces. This work does not include non-transports; it is possible that the incidence of non-transport for low urgency or ACSC may be even more representative of limitations in access to primary or other alternative care. We are currently in the process of further investigating calls resulting in non-transport. Finally, socioeconomic status, frailty, and other factors may influence usage of EMS in ways that have not been fully explored as of yet in this work. Our analysis was based on the location of pick-up, and not the location of patients’ residences. Further studies assessing factors related to the characteristics of service users’ residential environments (e.g., average household income in the neighbourhood, accessibility to family physicians from where they live, presence of schools with certain health programs) would require EMS users’ residential locations.
This work has been a hypothesis-generating addition to earlier work investigating the differences in rates of offload delay and in EMS transport.Reference Carter, Overton and Terashima 31 This exploratory study presents many opportunities for future work relating to socioeconomic status, true usage for ACSC instead of using CTAS as a proxy, proximity to hospitals with an open ED, availability of primary care, and crowding at local EDs.
CONCLUSION
In Nova Scotia, and across Canada, it is important to understand drivers of health care utilization as we seek to maintain a sustainable health system. Our study showed that the high rates of EMS use for low-urgency conditions increased by rurality for all age groups and not just for the older population. However, the older population by volume does represent substantially high EMS transports overall (for urgent and non-urgent conditions), particularly in non-metro communities. We have a rural and aging population; our findings call for further investigating the factors associated with geographic locations to discover innovative solutions that help provide more effective care and improve the cost-effectiveness of the overall health system.
Competing interests: None declared.