Article contents
XII.—On the Climate of Edinburgh for Fifty-six years, from 1795 to 1850, deduced principally from Mr Adie's Observations; with an Account of other and Earlier Registers
Published online by Cambridge University Press: 17 January 2013
Extract
1. The late Mr Alexander Adie, optician, and Fellow of the Royal Society of Edinburgh, was so generally known to be a zealous and careful observer of meteorological instruments, that an attempt to combine the results deducible from his labours carried on (though with one long break) over more than forty years, cannot be otherwise than interesting.
2. The plan of superintending the careful reduction of the thermometrical part of Mr Adie's registers occurred to me a long time ago, but circumstances prevented the execution of it until two or three years since, when, through the kindness of Mr Adie and his family, the whole of the manuscript observations, commencing with 1795, were put into my hands, and the Council of the Royal Society of Edinburgh provided sufficient funds for the employment of computers for reducing them.
3. The work has proceeded with frequent interruptions, but is at length complete. Before I proceed to detail the particulars of the reductions and their results, I will give a short account of the earlier observations on the climate of Edinburgh which I have been able to trace, some of which perhaps have hitherto escaped notice.
- Type
- Research Article
- Information
- Earth and Environmental Science Transactions of The Royal Society of Edinburgh , Volume 22 , Issue 2 , 1861 , pp. 327 - 356
- Copyright
- Copyright © Royal Society of Edinburgh 1861
References
page 327 note * Some account of Mr Adie's personal history and labours will be found in the Vice-President's Address for the Session 1859–60 (Proceedings of the Royal Society of Edinburgh, vol. iv. pp. 225–27.)
page 327 note † Essays and Observations on the Construction and Graduation of Thermometers by Martine, George, M.D., 2d edit. 1772, p. 48.Google Scholar
page 328 note * Medical Essays, i. p. 6.—Most likely in the neighbourhood of the present Royal Exchange.
page 328 note † Ibid. p. 8.
page 328 note ‡ Martine's Essays, p. 48.
page 328 note § British Association Reports for 1847.
page 330 note * Farther references to Mr Macgowan's observations will be found in the ‘London Philosophical Transactions’ for 1775, and in the Edinburgh Transactions, vol. iv. p, 214; but I have not been able to discover any continuation of the observations later than 1776.
page 330 note † Not unnaturally, since in the Tables themselves the word ‘noon’ is used to denote the midday observation. Compare p. 214 of the paper in vol. iv. of the Transactions.
page 330 note ‡ Edin. Trans, ix. p. 209.
page 331 note * See Sir D. Brewster's Memoir on the Mean Temperature of the Globe (Edin. Trans, vol. ix. pp. 209, 210), where also the mean temperature is deduced from Mr Jardine's observations on the springs of the Pentland Hills to be 47°·1.
page 331 note † Edinburgh Journal of Science, vol. i. In later volumes it is stated at 300 feet, but this is certainly too high. By the Ordnance Survey Map it would appear to be about 280 feet.
page 333 note * See his Memoirs in the Berlin Transactions. In the Index to these which I have made and printed in the Edinburgh Transactions, vol. xxii. p. 75, I have indicated by an asterisk the stations where the observations have been most continuous.
page 333 note † Mem. de l'Acad. de Bruxelles, tom. xxviii. Paper read June 1853.
page 336 note * In the usual approximate expression for the annual curve of temperature represented by the curve of sines, where t is the temperature of any day of the year, x the time reckoned from the commencement of the year, then, t = A + B sin (x + u 1). The three constants, A, B, and u 1, refer to the three particulars specified in the text. The equation to the annual curve will be more fully considered farther on (in § 6).
page 336 note † It will be seen how nearly this coincides with Mr Jardine's deductions from the temperature of springs, viz., 47°·08. (Art. 15, note).
page 336 note ‡ The mean temperature of Greenwich for seventy-nine years (1771–1849) is estimated by Mr Glaisher at 48°·29, or only 1°·54 above that of Edinburgh. The fluctuation of the mean annual temperature at Greenwich was 60°·2, or within the period of the Edinburgh observations (1795–1850) 5°·6. (Phil. Trans., 1850.)
page 337 note * According to Mr Glaisher, the mean difference of the hottest and coldest months at Greenwich for 79 years (1771–1849) is 28°·5, varying from 37°·1 to 21°·3. The climate of Greenwich is therefore more extreme than that of Edinburgh. The mean temperature of January is nearly a degree higher at Edinburgh than at Greenwich.
page 337 note † In this Table the months in all cases belonged to the same Calendar Year.
page 338 note * Reducing Mr Glaisher's numbers for Greenwich in proportion to the number of years, they, would give—June 3½, July 33, August 17½, September 2. The maximum occurs, therefore, later at Greenwich that at Edinburgh.
page 339 note * When the temperature of February and March was the same, as in 1807, then one-half is the proportion for each.
page 339 note † Mr Glaisher's numbers for Greenwich would give for a like number of years, January 30, December 15, February 10, March 1, November 0.
page 339 note ‡ See Quetelet on the Climate of Brussels, and § 6 of the present paper.
page 339 note § Edin. Trans., vol. xvi. p. 216.
page 340 note * In these two years, and also in 1810, there is some ambiguity owing to a double maximum occurring in June and August. In 1845 and 1846, at least, the effective maxima must be held to have occurred in July.
page 340 note † Mr Alexander J. Adie has favoured me with the following information about his father's raingauges:—’ Linlithgow, 14th March 1859.—My belief is, that there were but two gauges used in all the time the register was kept, and that the one still standing in the garden at Canaan Cottage was the only one used after that at Merchant Court was broken up. The second gauge is about 6½ feet above the ground, and of the ordinary form of the funnel mouth, with the glass tube and scale at the side. Falls of snow were taken by pushing down a cylinder through the snow in an open place, melting it, and measuring the depth of water for the fall had it been in rain.’
page 342 note * The sum total at all seasons is 24·79 inches, which is slightly below the average of 38 complete years given above. This arises from the partial observations of 1805 and 1850 (which are below the average) being included in the monthly means.
page 342 note † There is a slight appearance (from Table IX. column 2) of alternate ten-year periods below and above the mean, commencing in 1793 or 1794, and terminating in 1852 or 1853,—
The maxima would be 1809, 1829, 1849.
The minima would be 1799, 1819, 1839.
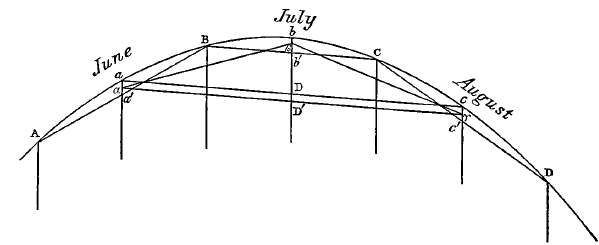
page 346 note * Let A B C D be four points in the true annual curve which is sought, and which is assumed to be symmetrical on either side. It will be sufficient for a first approximation to assume that these points, so far as they are considered at one time, are situated in a parabolic arc, formed by daily temperatures horizontally equidistant from one another. The mean temperature of the month BC (for example) will lie at β, and not at b in the parabolic arc. In like manner α and γ are the tabular averages for the preceding and following months. We want to find the quantity β b, by which the monthly mean is to he increased, in order to make it coincide with the temperature of the middle day of the month. β is the centre of gravity of the daily temperatures lying in the arc BC. Considering these daily temperatures as equally heavy points distributed uniformly with respect to a double ordinate BC parallel to the tangent at b, we have by the properties of the centre of gravity

 ; where the equation to the parabola is y 2 = 2ax, and where the weight of an individual observation is p. Hence we have
 ![]() , where x is the abscissa b b′ intercepted by the chord or double ordinate BC. In like manner αa = ⅓αa′ and γc = ⅓cc′. But a, c, the points representing the middle of the preceding and following months, are 60 days apart, while B and C are only 30 days apart. Therefore bD = 4bb' and
, where x is the abscissa b b′ intercepted by the chord or double ordinate BC. In like manner αa = ⅓αa′ and γc = ⅓cc′. But a, c, the points representing the middle of the preceding and following months, are 60 days apart, while B and C are only 30 days apart. Therefore bD = 4bb' and ![]() , which is equal (neglecting small quantities) to very nearly
, which is equal (neglecting small quantities) to very nearly ![]() . So that the required correction is found by increasing the co-ordinate of temperature expressed by the periodic part of the equation in the text ( + or − as the case may be) at the middle day of each month by
. So that the required correction is found by increasing the co-ordinate of temperature expressed by the periodic part of the equation in the text ( + or − as the case may be) at the middle day of each month by ![]() of the difference between the mean temperature of the month and the average of the temperatures of the preceding and following months.
of the difference between the mean temperature of the month and the average of the temperatures of the preceding and following months.
page 350 note * Memoire, &c., p. 4.
page 350 note † Dove, Fünftägige Mittel, &c. Folio, Berlin: and in the Tables of the Prussian Statistical Bureau. Folio, 1858.
page 352 note * The reductions of the daily range have heen less scrupulously verified than most of the other computations contained in this paper, but any residual errors are hardly likely to atfeet sensibly the mean results.
page 352 note † Since writing the above, I notice that M. Quetelet, at page 39 of his Mcmoir, expresses himself as to this anomaly in almost the same terms that I have used.
page 353 note * Cosmos, vol. i. note 86.
page 356 note * The same remark is made in page 39 of Mr Jenyns' ‘Observations on Meteorology,’ a very carefully compiled work. It might be possible to include this view of the case by considering the prices to vary with the square of the departures of the meteorological elements from a certain amount most favourable to cultivation, but I find no encouragement to make a fresh calculation on this more complex system.
- 1
- Cited by


