


Introduction
Reviews have focused on hypoalbuminaemia as a marker of chronic diseases such as liver failure, malnutrition, or protein-losing enteropathy [Reference Rothschild, Oratz and Schreiber1–Reference Doweiko and Nompleggi3]. However, newer studies in critically ill patients have shown that its role as a negative acute phase (and consequently inflammation) biomarker may be more predominant [Reference Hansson, Hedlund and Ortqvist4–Reference Rigaud16], which has also been reported in several reviews [Reference Don and Kaysen17–Reference Fuhrman, Charney and Mueller21]. Four physiological processes determine the plasma albumin level: synthesis (solely from the liver), the distribution between the vascular and interstitial space, catabolism and external loss [Reference Rothschild, Oratz and Schreiber1, Reference Don and Kaysen17]. The individual impact of each of these processes on the albumin level is difficult to quantify in real-life situations as they often occur concomitantly and they are influenced by each other and numerous other factors, e.g. such that emerge in illness.
To elucidate whether hypoalbuminaemia is mainly a consequence of a chronic or an acute condition, at least two albumin levels at different time points (i.e., longitudinal measurements) are required, ideally both before and after the acute condition. Because albumin, C-reactive protein (CRP), and haemoglobin (Hb) are measured on a clinical indication only, retrospective studies have focused on single biomarker measurements after disease occurrence or exacerbation [Reference Vincent22]. The few studies incorporating longitudinal albumin and CRP measurements have mainly included patients with chronic diseases in whom regular measurements are warranted, in particular, end-stage kidney disease patients assessed by one US study group [Reference Kaysen6–Reference Kaysen9, Reference Kaysen12].
It is important to notice whether hypoalbuminaemia measured at the time of bacteraemia is mainly a marker of the patient's chronic condition or of the bacteraemia severity per se, as the latter is mainly treatable in the acute setting. In a recent prognostic study of community-acquired bacteraemia patients, we found that hypoalbuminaemia was primarily related to the acute inflammation and less to chronic comorbidity [Reference Magnussen23]. In the present pathophysiology study, we use the same study cohort to assess to what degree the CRP level (a ‘gold standard’ inflammation marker) is a marker of the albumin level. Because Hb does not leak into the interstitial space, we further incorporate the Hb level as a rough marker of the plasma volume vs. trans-capillary escape of albumin. We aimed to assess these mechanisms to elucidate hypoalbuminaemia as a marker of trans-capillary leakage.
Methods
Setting
The Danish public health system is tax-financed and free of charge for all residents. The admission of all Funen County residents with acute illness to a hospital within the county prompts a population-based design.
Study cohort
The study cohort has been described previously [Reference Gradel24]. In brief, it comprised all adult patients (>14 years) residing in Funen County, with their first-time community-acquired bacteraemia in 2000–2008. Bacteraemia included all episodes based on positive blood cultures with Enterobacteriaceae, Pseudomonas aeruginosa, Staphylococcus, Streptococcus, or Enterococcus, except episodes with coagulase-negative staphylococci or non-haemolytic streptococci found in only one bottle, which were considered contamination. The bacteraemia date was defined as the date of the drawing of blood culture (BC); if that date was missing, the date of receipt of the BC in the laboratory (never missing) was used. We only included patients with CRP measured from 2 days before until the day after the bacteraemia date. The bacteraemia was community-acquired if the bacteraemia date occurred <3 days after hospital admission and the patient had not been hospitalised in the 7 days up to the bacteraemia date.
Microbiological data
All BCs were submitted to the Department of Clinical Microbiology, Odense University Hospital (OUH), which recorded results in the OUH Patient Administrative System until 2005 and thereafter in the laboratory information system MADS (www.madsonline.dk). BC procedures have been described previously [Reference Gradel24].
Blood parameter procedures
All blood parameter analyses were performed by the Department of Clinical Biochemistry and Pharmacology, OUH, which recorded results in the Netlab database (Medasys S.A., Littau, Switzerland). Plasma albumin was measured on Modular P® (Roche, Mannheim, Germany) by use of a bromcresol green dye-binding method. Plasma CRP was measured with an immune-turbidimetric principle on Modular P® (Roche, Mannheim, Germany). Until September 2005, Hb was measured with Sysmex SE9000 (Sysmex Corporation, Kope, Japan) and thereafter with Coulter LH750 (Beckman Coulter, Miami, USA). All blood parameter dates refer to the date of the drawing of blood specimens.
Derivation of blood parameter data
We initially retrieved all measurements of albumin, CRP and Hb from 1 January 2000 through 30 September 2010. We excluded unrealistically low levels of albumin (<11 g/l) and Hb (0 mmol/l) and kept one measurement only for each parameter on the same date (designated a specimen date). For albumin and Hb we kept the highest level and for CRP the lowest.
Other data
For details, we refer to [Reference Gradel24]. In brief, other data included gender, age, bacterial species, prescriptions of antibiotics up to 1 month before the bacteraemia date, Charlson comorbidity index [Reference Charlson25], temperature, heart rate, number of white blood cells, systolic blood pressure, heart rate, vital status (per 15 June 2009 if alive, and date of death, disappearance, or emigration if this occurred before 15 June 2009) and various organ failure syndromes (CNS (central nervous system), liver, coagulation, perfusion, circulation, lung, kidney). We computed whether they had sepsis based on three SIRS criteria (temperature >38 °C or <36 °C, heart rate >90 beats/min, white blood cells >12 000 cells/mm3, <4 000 cells/mm3 or >10% immature forms) as data on respiration were often missing. We further used hypotension (systolic blood pressure <90 mmHg) and organ failure data to grade sepsis severity [26].
Statistical analyses
As all relevant measurements were used for the analyses regardless of their distribution between patients we did not distinguish between intra- and inter-patient variations.
Initially, we scattered year of bacteraemia (2000–2008) vs. year of biochemical specimen [2000–2009 (until 15 June 2009, the last date of recording vital status)] to deduce the numbers of specimen dates per person-year for each combination of bacteraemia and specimen year. After the bacteraemia date, we incorporated the possible date of death, emigration, or disappearance to account for the actual number of person-years. We reiterated these scatter plots separately for albumin, CRP and Hb (data not shown).
Designating the bacteraemia date as day 0 we initially divided the time span before and after day 0 into the following six periods: (i) from day minus ‘infinite’ (−∞) through day −31 (the earliest date of −∞ was 1 January 2000), (ii) from day −30 through day −1, (iii) day 0, (iv) from day 1 through day 7, (v) from day 8 through day 30, (vi) from day 31 to day ∞ (the latest date of ∞ was 31 December 2010).
Because the CRP measurement method was insensitive to CRP levels <10 mg/l, such values were mainly recorded as 0 mg/l in the original data. Hence, we re-allocated all CRP levels below 10 mg/l to range from 0 through 9 mg/l with an equal distribution to the CRP within the range from 10 through 19 mg/l (see Appendix for details).
CRP levels were not normally distributed whereas albumin and Hb levels were (data not shown). The descriptive results of this study focused mainly on correlations and longitudinal increases/decreases, all of which were materially the same regardless of whether we assessed medians or means. Hence, for convenience, we report descriptive results based on mean levels only, with their 95% confidence intervals (CIs). For the merged period (ii)–(v) (from day −30 through day 30), we graphically depicted daily mean levels with their 95% CIs of albumin, CRP, and Hb.
For the subsequent analyses, we used a transformed variable of the CRP level to achieve linearity for the linear regression by adding 1 mg/l to all CRP levels and then computing the natural logarithm of it [Ln(CRP)] (see Appendix).
For all specimens, as well as separately for the periods (i), (ii)–(v) and (vi), we computed box plots of the albumin level in relation to 10 equal-range groups of Ln(CRP) and Hb levels. We only show box plots for periods (ii)–(v).
As all box plots indicated either positive or inverse correlations for all specimens and within each of the six periods we compared levels of albumin, Ln(CRP), and Hb mutually by Pearson's correlations coefficient (R), with the use of Bonferroni-adjusted significance levels.
Based on box plot and correlation analysis results [Reference Schneider, Hommel and Blettner27] we performed linear regression analyses with albumin as the dependent variable after having validated this as a sound model (see Appendix). We incorporated the following models of possible predictor variables:
(1) For all six periods and separately for periods (i)–(vi): Ln(CRP), Hb, gender, age (integer years as a continuous variable), Charlson comorbidity index (0, 1–2, >2);
(2) Separately for periods (ii), (iii) and (iv): Ln(CRP), Hb, systolic blood pressure ⩽90 mmHg, heart rate >90, temperature >38 °C or <36 °C, central nervous system (CNS) affection;
(3) Separately for periods (ii), (iii) and (iv): Ln(CRP), Hb, sepsis severity [no sepsis, possibly sepsis (due to missing data), sepsis, severe sepsis/septic shock, and organ failure without sepsis];
(4) Separately for periods (ii), (iii) and (iv): Ln(CRP), Hb, liver failure, coagulation failure, perfusion failure, circulatory failure, lung failure, kidney failure.
For each model and period, we used the leaps-and-bound algorithm to assess the coefficient of determination (R 2) which predictors best predicted the albumin level [Reference Schneider, Hommel and Blettner27, Reference Lindsey and Sheather28]. R 2, which ranges from 0 to 1 (equivalent to 0–100%), is a measure of how much of the variance in the albumin level that can be described by the observed data. In the reporting of results, we focus on the contribution of Ln(CRP), Hb with Ln(CRP) in the model and Hb after exclusion of Ln(CRP) from the model.
To further elucidate whether the decline in the albumin level was mainly related to an expansion of the plasma volume or to trans-capillary leakage we reiterated all four models with the inclusion of period (ii)/(iii) (day −30/0) vs. period (iv) (days 1–7) as a covariate. We compared these models with and without Hb as a covariate to assess its impact on the albumin level decline.
Reiterations were made for all above graphic depictions and analyses in subgroups pertaining to all variables in models (1)–(4) (age divided into 15–64, 65–80, +80 years), for patients who were deceased or alive 7 or 30 days after the bacteraemia date, and for patients with at least one specimen date in each of the time periods (ii)–(v).
The program Stata®, vs. 14, (StataCorp., College Station, TX, USA) was used for all analyses.
Ethical considerations
The study was approved by the Danish Data Protection Agency (no. 2013-41-2579).
Results
Descriptive
Among the original 2785 bacteraemia patients [Reference Gradel24], 2472 (88.8%) had CRP measured from 2 days before through the day after the bacteraemia date, including 121 245 specimen dates with measurements of CRP, albumin and/or Hb (data not shown). A total of 49 293 specimen dates (40.7%) had measurements of all three biochemical parameters and each patient had from 1 to 674 specimen dates (median 29, interquartile range 13–60, mean 49).
To deduce the numbers of specimen dates per person-year we excluded the following: dates after 15 June 2009 (last date of recording vital status) (n = 8077), dates after death, disappearance or emigration (n = 2), dates in patients who emigrated before their bacteraemia (9 dates in 1 patient). 113 157 specimen dates (93.3%) in 2471 patients remained. The number of specimen dates per person-year increased in the years up to the year of their first-time community-acquired bacteraemia and decreased in the years thereafter (Fig. 1). Separate scatter plots for albumin, CRP and Hb did not deviate materially from Figure 1 (data not shown).
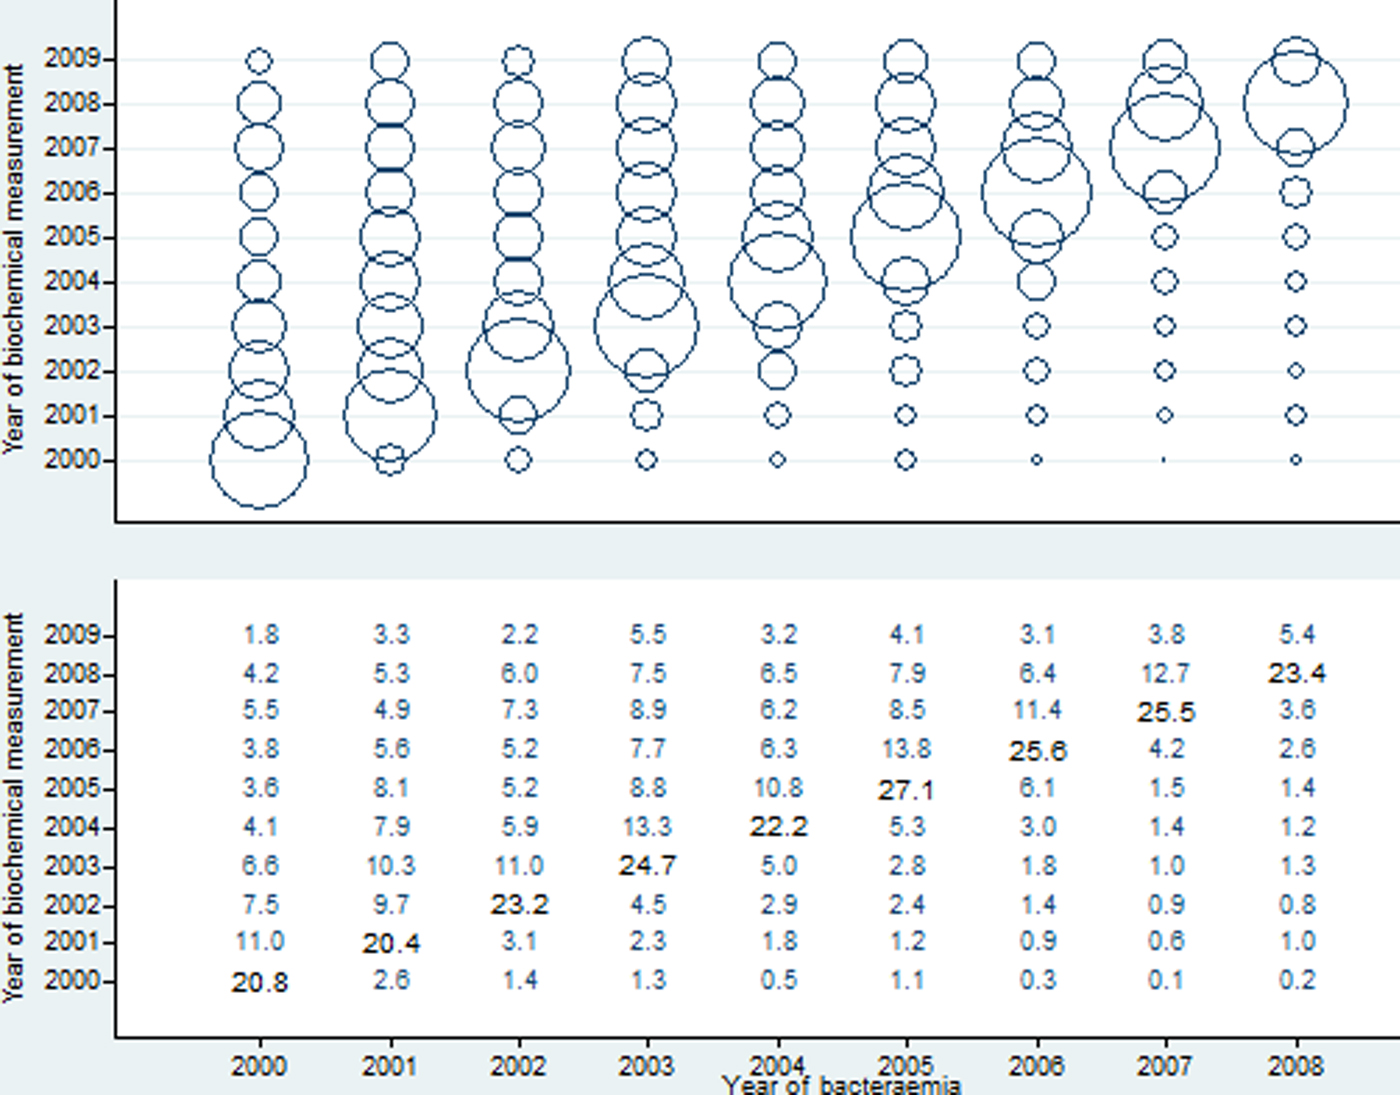
Fig. 1. Number of specimen dates (with plasma albumin, C-reactive protein and/or haemoglobin measured) per person-year (represented by the area of a circle in upper panel and numbers in lower panel).
Mean albumin levels from 30 days before to 30 days after bacteraemia
Albumin in g/l (Fig. 2, upper panel) comprised 21 560 measurements from 2427 patients (each with 1–54 measurements). The mean albumin levels (33.6 g/l) were steady before day 1, after which a sudden decline to 29.3 g/l occurred on day 1. Although the albumin level increased a little from days 15 to 30, on which it was 30.4 g/l, the mean level was still 29.3 g/l during the whole period from day 0 to 30. Regardless of the period, the mean albumin level was below the normal range of 35–50 g/l.
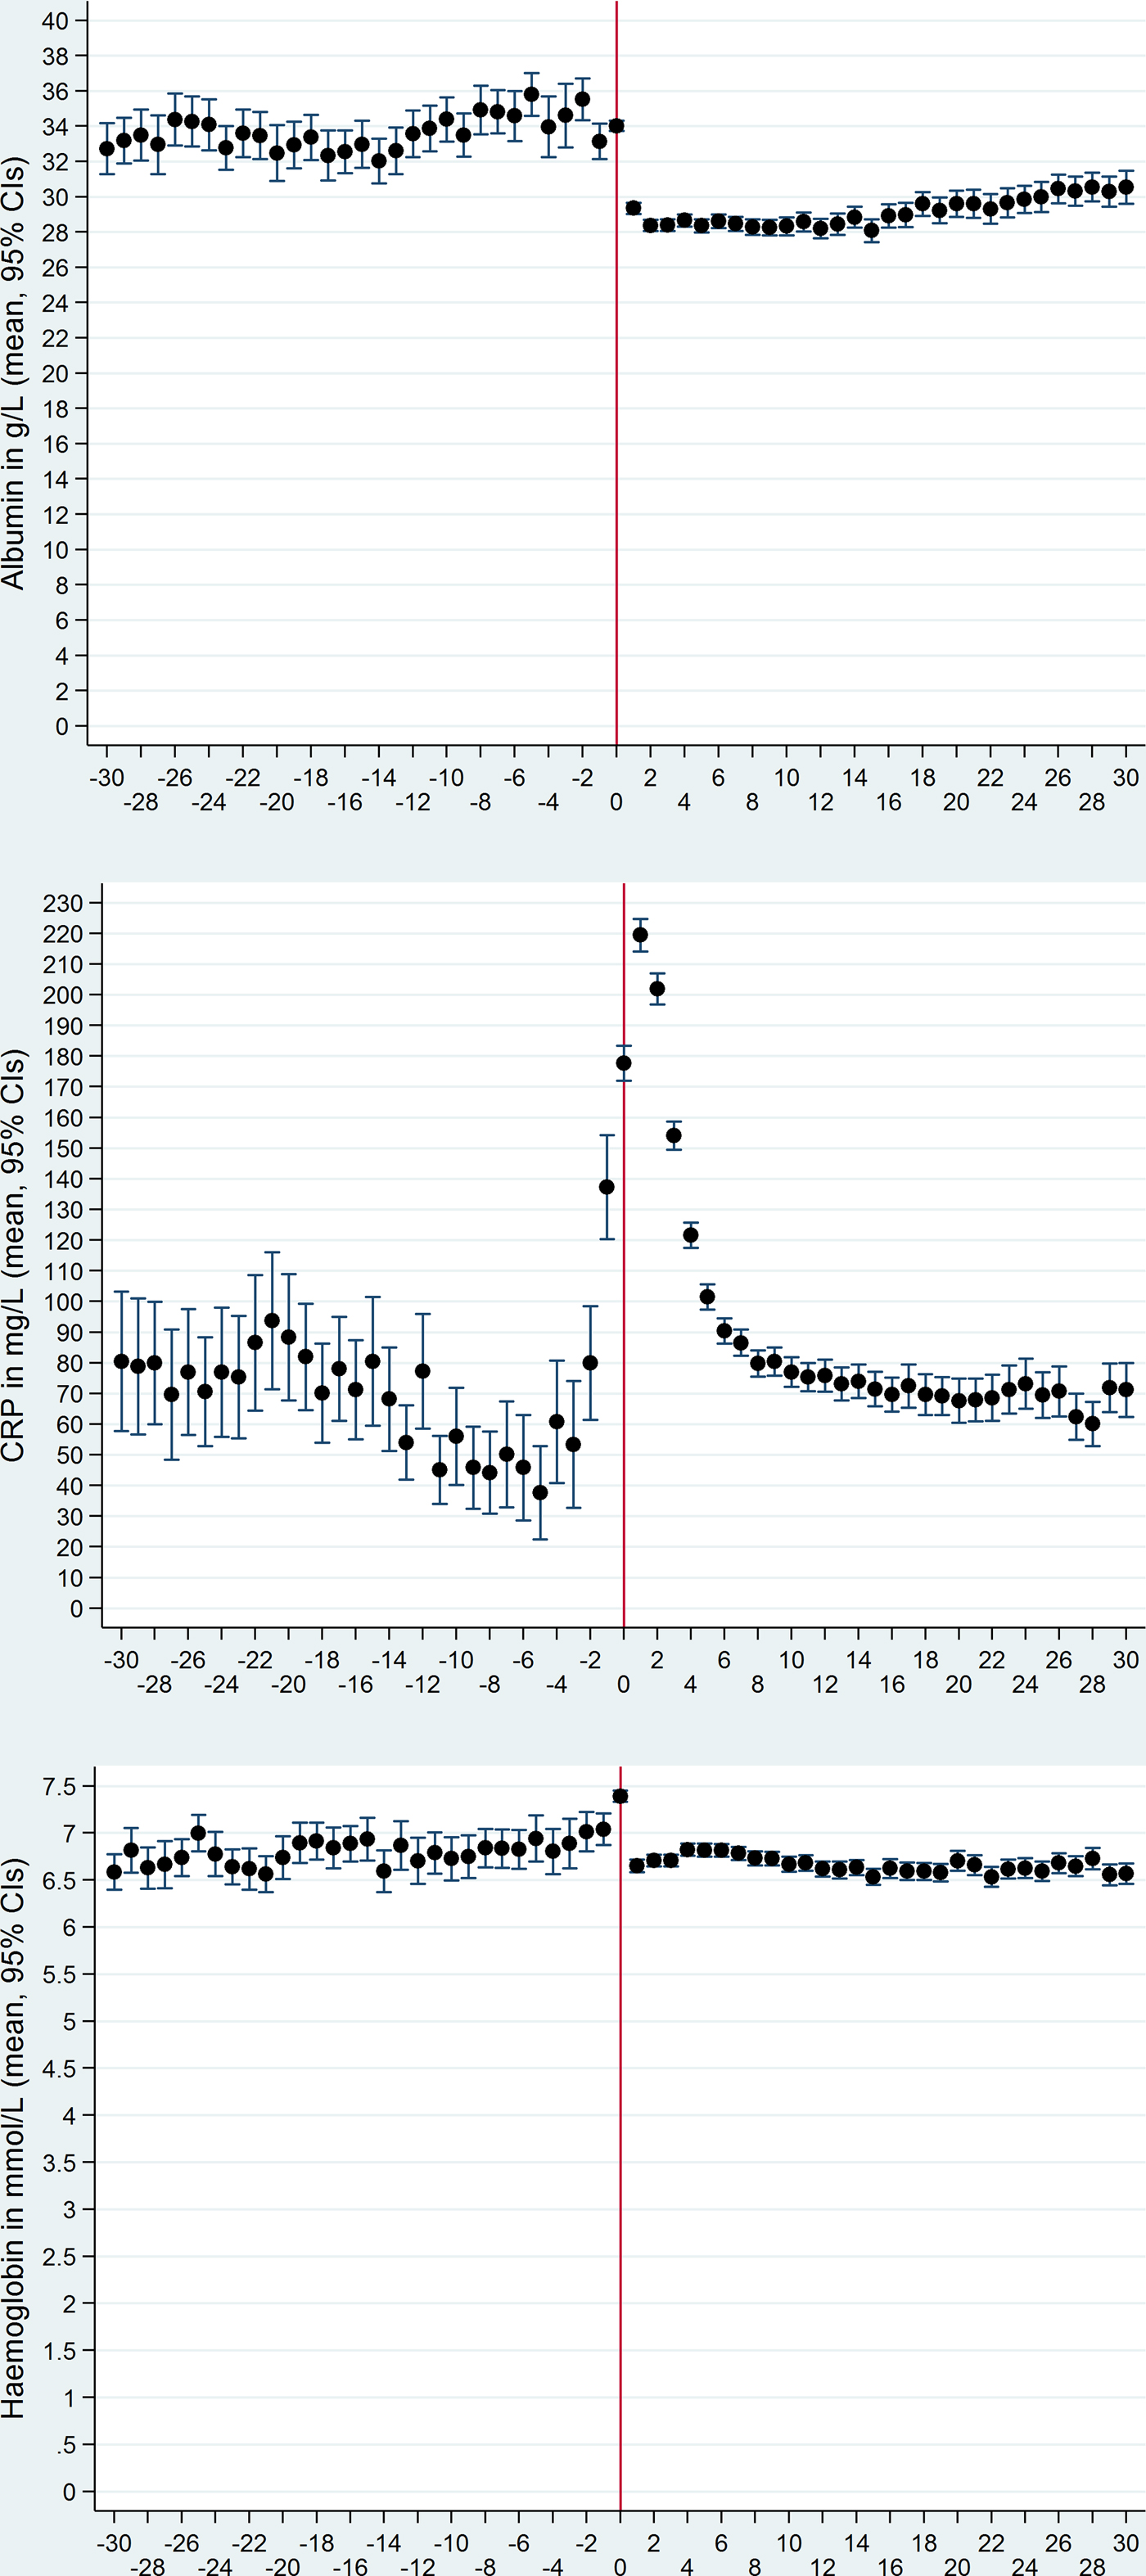
Fig. 2. Mean levels and their 95% confidence intervals of plasma albumin (upper panel), C-reactive protein (middle panel) and haemoglobin (lower panel) from 30 days before through 30 days after the date of bacteraemia (day 0, marked by vertical red line).
Mean CRP levels from 30 days before to 30 days after bacteraemia
CRP in mg/l (Fig. 2, middle panel) comprised 24 181 measurements from 2472 patients (each with 1–51 measurements). The mean CRP levels declined from day −20 to −5 after which they increased, especially on days −2, −1, 0 and 1. Thereafter they declined again and on day 15 they reached the pre-bacteraemic levels seen before the decline. During the whole period, the mean CRP levels were above the non-inflammation level of 0–10 mg/l; the lowest mean level of 40 mg/l occurred on day −5.
Mean Hb levels from 30 days before to 30 days after bacteraemia
Hb in mmol/l (Fig. 2, lower panel) comprised 19 041 measurements from 2401 patients (each with 1–54 measurements). The mean Hb levels (6.8 mmol/l) were fairly steady before the bacteraemia, apart from a gradual increase to 7.4 mmol/l in the last days up to day 0 after which they suddenly declined on day 1, with a steady level thereafter (mean 6.7 mmol/l, i.e. virtually the same as before the bacteraemia date). The mean Hb levels were below the normal range (females 7.0–10.0 mmol/l; males 8.0–11.0 mmol/l) during virtually all periods.
Correlations between albumin and Ln(CRP) levels
The box plot for the merged periods (ii)–(v) (from day − 30 through day 30) showed decreasing albumin levels in relation to higher Ln(CRP) equal-range group (Fig. 3, left panel). Box plots for albumin vs. Ln(CRP) equal-range group in the separate periods (i) and (vi) also showed inverse correlation regardless of Ln(CRP) equal-range group (data not shown).
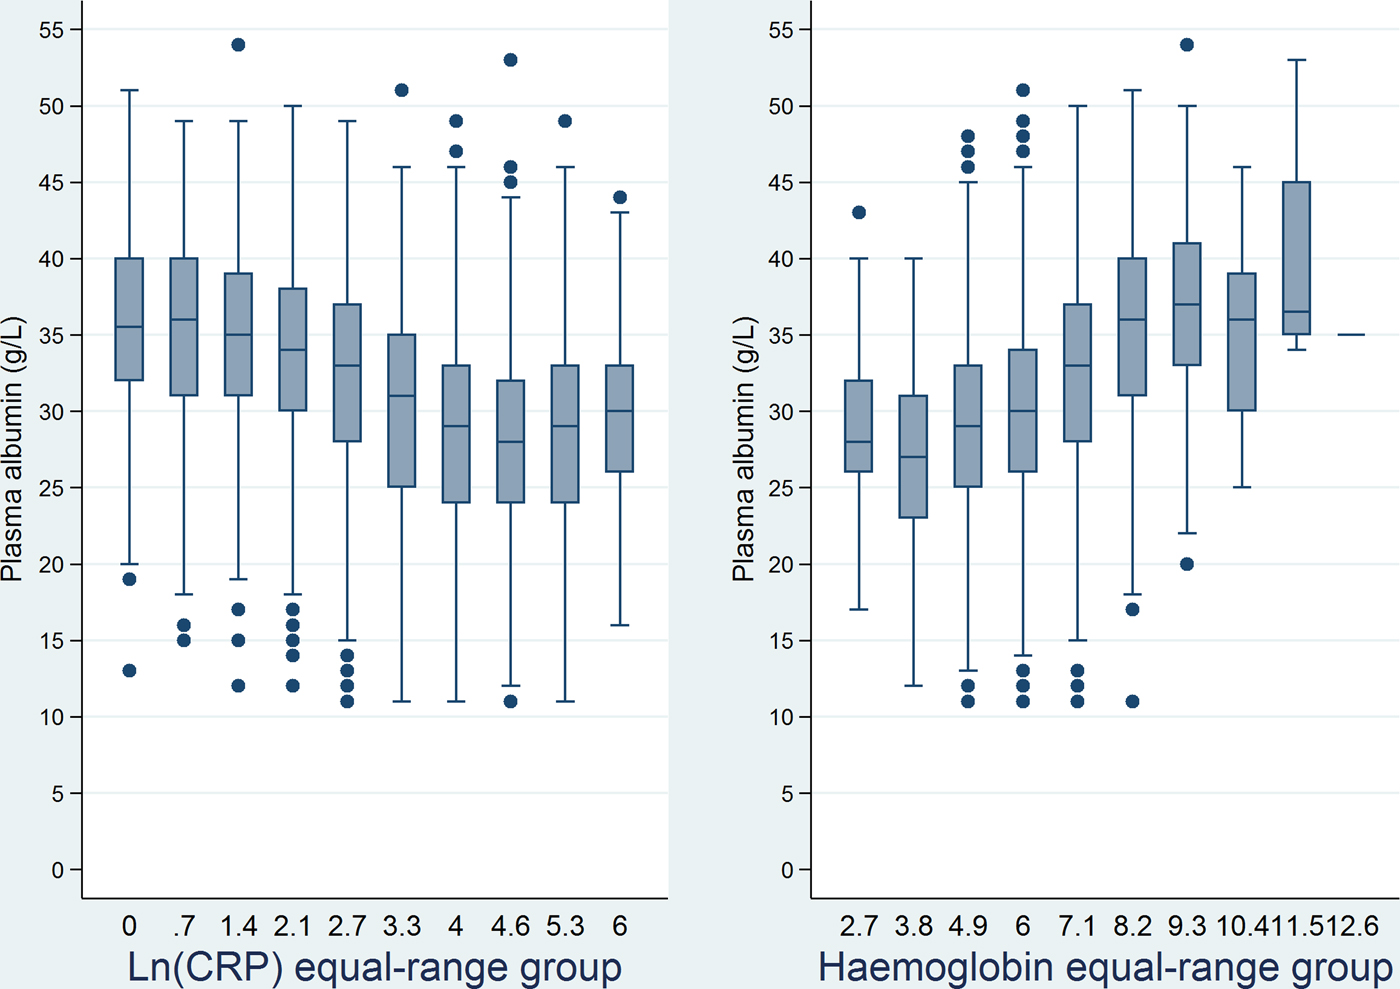
Fig. 3. Box plots of plasma albumin levels for equal-range groups of the natural logarithm of C-reactive protein (left panel) and haemoglobin levels (right panel) from 30 days before through 30 days after the date of bacteraemia.
Inverse correlations between albumin and Ln(CRP) levels were detected for all specimens, for the merged period (ii)–(v), and within each of the periods (i)–(vi) (Table 1).
Table 1. Correlations between plasma albumin and the natural logarithm of the C-reactive protein levels

a Pearson's correlation coefficient.
b Number of specimen dates.
c From days before bacteraemia date/through days after bacteraemia date.
d ‘Minus infinity’, earliest possible date is 1 January 2000.
e Bacteraemia date.
f ‘Infinity’, the latest possible date is 30 September 2010.
Correlations between albumin and Hb levels
The box plot for the merged period (ii)–(v) (from day − 30 through day 30) showed increasing albumin levels with higher Hb equal-range group (Fig. 3, right panel). The same was seen for the separate periods (i) and (vi) (data not shown).
Positive correlations were detected between albumin and Hb levels, regardless of the period (Table 2).
Table 2. Correlations between plasma albumin and haemoglobin levels

a Pearson's correlation coefficient.
b Number of specimen dates.
c From days before bacteraemia date/through days after bacteraemia date.
d ‘Minus infinity’, earliest possible date is 1 January 2000.
e Bacteraemia date.
f ‘Infinity’, the latest possible date is 30 September 2010.
Linear regression analyses, with albumin level as the outcome
For all four models and time periods, except on day 0, Ln(CRP) was the variable that best predicted the albumin level (Table 3). Likewise, Ln(CRP)’s contribution to the albumin level accounted for most of the R 2, e.g. model 1's R 2 for all periods, was 0.350, of which Ln(CRP) accounted for 0.230 (65.7%). On the bacteraemia date and in the week thereafter, all models contributed less to the albumin level and Ln(CRP)’s proportion also declined for some of these (e.g. on day 0). In models that included Ln(CRP), Hb was generally selected as the 2nd variable (Table 3). As most of the R 2 could be attributed to Ln(CRP), the placement of Hb in the model depended on relatively small changes in R2. We, therefore, reiterated the analyses by the exclusion of Ln(CRP) which caused Hb to be selected as the first variable in all 16 model/period combinations (Table 3). In these full models without Ln(CRP), the R 2s were lower (ranging from 0.038 to 0.289) than in the full model (data not shown).
Table 3. Linear regression analyses: Selection of variables that best predicted the plasma albumin level

a The natural logarithm of the C-reactive protein level.
b Haemoglobin.
c Brackets: 1st variable's contribution to R 2 in relation to the full model's contribution (%).
d From days before bacteraemia date/through days after bacteraemia date. −∞: ‘Minus infinity’, earliest possible date is 1 January 2000.
e Bacteraemia date.
f ‘Infinity’, the latest possible date is 30 September 2010.
Linear regression analyses with day −30/0 vs. days 1–7 as a covariate
In all four models, the adjusted decline in the albumin level on days 1–7 was about 3.8 g/l with Hb and 4.9 g/l without Hb in the model, e.g. 3.78 g/l (95% CI 3.56–4.01 g/l) vs. 4.90 g/l (95% CI 4.67–5.13 g/l) for model 1 (data not shown).
Analyses in subgroups
Graphic depictions and analyses in subgroups according to variables in models 1–4, for patients who were deceased or alive 7 or 30 days after their bacteraemia date, or for patients with ⩾1 specimen date in each of the four ‘acute’ time periods (ii)–(v) (days −30/–1, 0, 1–7 and 8–30) did not deviate materially from the results reported for the whole study cohort (data not shown). In the −30/30 day period, however, the 462 patients (18.7%) with kidney failure had albumin levels about 2 g/l lower than patients without kidney failure (data not shown).
Discussion
From 30 days before through 30 days after community-acquired bacteraemia, the albumin levels were inversely correlated to CRP levels. In spite of comprehensive clinical data reflecting the bacteraemia patients’ acute and chronic conditions, the CRP level seemed to be the best predictor of the albumin level, as shown in multivariate linear regression analyses. Although Hb and albumin levels were positively correlated, the Hb level was a weaker predictor of the albumin level.
The inverse correlations between the albumin and CRP levels conform with other studies that incorporated longitudinal measurements, mainly reported from end-stage kidney disease patients [Reference Kaysen6–Reference Kaysen9, Reference Kaysen12], in addition to two studies of ICU patients [Reference Blunt, Nicholson and Park13, Reference McCluskey14]. As regards infectious diseases, we have encountered one study of 97 community-acquired pneumonia (CAP) patients followed prospectively [Reference Hansson, Hedlund and Ortqvist4], which also showed an inverse correlation between the albumin and CRP levels. In contrast to the studies of kidney failure and ICU patients, these patients were also followed after recovery from their CAP where the fall of the CRP level paralleled a rising albumin level and the rapid changes of the latter could not be explained solely by factors related to synthesis and catabolism. In contrast to CRP, we have found no studies that incorporated longitudinal measurements of Hb.
Interleukin-6 stimulates the hepatic synthesis of CRP and impedes the synthesis of albumin in the liver [Reference Rothschild, Oratz and Schreiber1, Reference Bologa29], but this cannot solely explain the sudden decline of the albumin level from a mean of 33.6–29.3 g/l within 1 day given the increasing CRP levels during several days and the long albumin half-life of 20 days [Reference Blunt, Nicholson and Park13, Reference McCluskey14, Reference Franch-Arcas18].
Therapy using a fluid without albumin will diminish the albumin level due to an expanded plasma volume. However, if fluid therapy was responsible for the sudden decline in the albumin level we would expect the same to happen for the Hb level, which actually increased on day 0. Furthermore, the relatively small decline of the Hb level as compared with the albumin decline on day 1 as well as the high adjusted albumin decline when Hb was included in the linear regression models indicates that a plasma volume expansion, regardless of fluid therapy, was not an important mechanism in the inflammatory response.
We further included Hb because, in contrast to albumin, it does not leak into the interstitial space when capillaries leak [Reference Fleck, Colley and Myers30]. The high impact of increasing albumin trans-capillary leakage on hypoalbuminaemia as compared with decreased synthesis has been reported in acute conditions, such as trauma and shock [Reference Fleck15, Reference Fleck, Colley and Myers30–Reference Dahn33]. Fleck et al. measured the trans-capillary escape rate (TER, a measure of the trans-capillary leakage) of albumin in healthy subjects and in patients with septic shock in whom TER increased up to 300% in comparison with the formers’ TER of 5% per hour [Reference Fleck15]. In the same study, TER increased within 7 h after 16 patients underwent a cardiopulmonary bypass operation, paralleled by declining albumin levels. This early response could not be explained by an increasing synthesis of acute-phase proteins, such as CRP that only begins to increase about 7 h after surgery [Reference Colley34, Reference Myers35]. We have encountered few other studies of TER in humans in relation to inflammation, but an interesting study in rabbits injected intradermally with Escherichia coli showed 170–700% albumin extravasation on the injection site as compared with the control values [Reference Hamilton36]. Moreover, the lesser amount of albumin clearing from the injection site than albumin leaking through the capillaries indicated the role of increased TER in hypoalbuminaemia.
Little is generally known about the catabolism of albumin [Reference Rothschild, Oratz and Schreiber1, Reference Franch-Arcas18, Reference Gatta, Verardo and Bolognesi37], but to our knowledge, the balance between albumin's synthesis and its compensatory catabolism has not been described as being hampered by pathological conditions. External albumin loss has mainly been reported for extensive burns or skin diseases, protein-losing enteropathies and kidney failure [Reference Gatta, Verardo and Bolognesi37], but we only had data for the latter [Reference Gradel24]. The albumin levels of kidney failure patients were lower, but longitudinal patterns (cf. Fig. 2) or analyses did not deviate materially from the ones of patients without kidney failure. This indicates that other factors than catabolism generally played a major role for hypoalbuminaemia.
Thus, the most likely explanation for the sudden decrease in the albumin level in relation to bacteraemia is the leakage of albumin from the plasma to the interstitial space, reflecting an increase in capillary permeability. This probably explains why the albumin level was also a strong short-term mortality predictor in the same study cohort [Reference Magnussen23].
For our study cohort as a whole, the number of specimen dates per person-year clearly indicated that the incident bacteraemic episode constituted the most severe disease event. Nevertheless, the mean CRP levels of ⩾40 mg/l from 30 days before through 30 days after the bacteraemic episodes indicated an ongoing inflammation in many patients. Likewise, mean albumin and Hb levels were below the normal range in virtually all periods, but due to lack of anthropomorphic data, we cannot interpret to what degree the low albumin levels reflected chronic inflammation or other factors such as malnutrition, liver disorders, or anaemia. Notwithstanding such considerations, these data corroborate that patients, likely to acquire bacteraemia, are generally frail.
To the best of our knowledge, no study of bacteraemia patients has incorporated longitudinal measurements of albumin and CRP. In addition, we included longitudinal Hb level measurements to elucidate fluid therapy, plasma volume expansion, and extravasation as possible causes of hypoalbuminaemia. The 2472 first-time community-acquired bacteraemia patients with 121 245 specimen dates during an 11-year period enabled numerous sub-group analyses to assess whether our results were consistent. Moreover, the study was population-based and included clinically important data for comorbidity as well as the patients’ septic conditions and vital organ failures around the time of the bacteraemic episode.
Our study also had limitations that warrant further discussion. First and foremost, it was retrospective and the number of specimen dates per patient (ranging from 1 to 674) and whether albumin, CRP, and/or Hb were measured on each specimen date depended on the patient's clinical severity. In order to partly compensate for this confounding by indication, we reiterated all analyses in different subgroups, including patients with specimen dates in all the ‘acute’ time periods (days −30/–1, 0, 1–7, and 8–30). Because all results were consistent, it is likely that the pathophysiological mechanisms were basically the same. However, more sophisticated methods that incorporate multilevel and longitudinal data analyses are clearly needed [Reference Singer and Willett38], amongst others to distinguish between intra- and inter-patient variation. We will elaborate further on these aspects in future studies comprising patient subgroups having two or more longitudinal measurements. Secondly, we had no nutrition data (e.g., subjective global assessment score [Reference Sacks39], anthropometry [Reference Yeun and Kaysen40], or equilibrated normalised protein catabolic rate anthropomorphic [Reference Kaysen6]). Although newer studies [Reference Hansson, Hedlund and Ortqvist4–Reference Rigaud16] and reviews [Reference Don and Kaysen17–Reference Fuhrman, Charney and Mueller21] have found that hypoalbuminaemia reflects inflammation rather than malnutrition, part of the hypoalbuminaemia found in our patients long time before and after their bacteraemic episode probably reflects ‘non-inflammation’ conditions. The similarly low Hb levels corroborate this as anaemia is often a characteristic of various chronic conditions. Thirdly, we had no data on fluid therapy, including whether it contained albumin or plasma. However, neither albumin nor plasma is standard treatments to sepsis or bacteraemia patients in OUH (CP, personal commuication) and our data on albumin vs. Hb levels around the time of bacteraemia indicate that such data would probably have no impact on the interpretation of the results. Fourthly, our definition of community-acquired acquisition differed from the more generally accepted definition [Reference Friedman41] and many of our patients had hospital contact in the 30 days up to their bacteraemia [Reference Gradel42]. Although this may complicate comparisons to other studies, our interpretation of the pathophysiological mechanisms is the same.
In conclusion, the CRP level was the best predictor of the albumin level and it seemed superior to clinical variables related both to comorbidity, sepsis and organ failure. Our results indicate that the sudden decline in the albumin level when bacteraemia occurs is mainly due to trans-capillary leakage, reflecting the magnitude of the microcirculation impairment. These results, together with our previous findings that the albumin level is a strong prognostic predictor [Reference Magnussen23], are clinically important. If possible for the specific patient, clinicians should focus on the day-to-day decline of albumin levels rather than albumin levels per se as such declines reflect the severity of the septic condition, which, in contrast to chronic conditions, is treatable in the acute setting.
Supplementary material
The supplementary material for this article can be found at https://doi.org/10.1017/S0950268818000274
Acknowledgements
None.
This research did not receive any specific grant from funding agencies in the public, commercial or not-for-profit sectors.
Conflict of interest
None.


