


Meta-analyses have become an indispensable tool to integrate large, often complex and sometimes conflicting bodies of evidence, and to translate the results of this research into treatment recommendations, guidelines and advice for policy measures (Higgins et al., Reference Higgins, Thomas, Chandler, Cumpston, Li, Page and Welch2021). The methods for conducting meta-analyses have been developed well in the past decades, and every year many thousands of new meta-analyses are published.
The methods of meta-analyses are not without problems, however. One important issue is related to heterogeneity, indicating the variability between studies that are included in meta-analyses (Higgins et al., Reference Higgins, Thomas, Chandler, Cumpston, Li, Page and Welch2021). Meta-analyses typically include studies that vary to a certain extent and the question always is whether they are comparable enough for their results to be pooled in a meta-analysis. Statistical heterogeneity refers to the variability in the intervention effects being evaluated in the different studies, and is a consequence of clinical or methodological diversity, or both, among the studies (Cuijpers, Reference Cuijpers2016). Statistical heterogeneity can be measured directly in meta-analyses and is often quantified by I 2, which indicates the percentage of the variability in effect estimates that is due to heterogeneity rather than sampling error (chance; Higgins and Thompson, Reference Higgins and Thompson2002).
When heterogeneity is found in a meta-analysis it is important to examine potential sources of this heterogeneity. One of the most used methods to examine sources of heterogeneity is the so-called ‘subgroup analysis’ (Sun et al., Reference Sun, Briel, Busse, You, Akl, Mejza, Bala, Bassler, Mertz, Diaz-Granados, Vandvik, Malaga, Srinathan, Dahm, Johnston, Alonso-Coello, Hassouneh, Walter, Heels-Ansdell, Bhatnagar, Altman and Guyatt2012, Reference Sun, Ioannidis, Agoritsas, Agoritsas, Alba and Guyatt2014). In a subgroup analysis, the included studies are divided into two or more subgroups, and it is tested whether the pooled effect sizes found in these subgroups differ significantly from each other by looking at the interaction between the subgroup and the treatment (Cuijpers, Reference Cuijpers2016). Subgroup analyses can be considered as a core component of most published meta-analyses and are recommended by the Cochrane Handbook for meta-analyses (Higgins et al., Reference Higgins, Thomas, Chandler, Cumpston, Li, Page and Welch2021).
Subgroup analyses are, however, associated with several important methodological problems (Sun et al., Reference Sun, Briel, Busse, You, Akl, Mejza, Bala, Bassler, Mertz, Diaz-Granados, Vandvik, Malaga, Srinathan, Dahm, Johnston, Alonso-Coello, Hassouneh, Walter, Heels-Ansdell, Bhatnagar, Altman and Guyatt2012, Reference Sun, Ioannidis, Agoritsas, Agoritsas, Alba and Guyatt2014). One important problem of subgroup analyses is that they are easily interpreted causally, while the results are in fact observational (Higgins et al., Reference Higgins, Thomas, Chandler, Cumpston, Li, Page and Welch2021). Participants in the interventions are not randomised to one of the subgroups, which means that these results cannot be interpreted in a causal way. If for example an intervention is found to be more effective in nursing homes than in other settings, this can indicate a real difference between settings, but not that nursing homes reduce the effect size estimates. For example, it can also be related to the age of participants or that in nursing homes more single persons live than in other settings. Especially when the number of studies is limited, the characteristics of the included studies can be highly correlated with each other and it would be difficult to reason what the actual causes of the subgroup differences are.
Power calculations for subgroup analyses
An even more important problem of subgroup analyses, however, is the low power of such analyses (Pigott, Reference Pigott, Ting, Ho and Chen2020). The second author of this paper recently developed metapower, a statistical package in R for conducting power analyses for general meta-analyses (e.g., summary effect size) and subgroup analyses (Griffin, Reference Griffin2021). A shiny app makes the software easily accessible (jason-griffin.shinyapps.io/shiny_metapower). With this package, it is possible to examine the statistical power of subgroup analyses in different scenarios. A simple example can show that you need many more studies to detect subgroup differences than you would need to detect a main effect in the meta-analysis.
Suppose for example that we are conducting a meta-analysis comparing the effect of an intervention over a control condition in which each included study has 50 participants and a moderate degree of heterogeneity (i.e., I2 = 50%). If the standardised mean difference (SMD) between treatment and control group after treatment is 0.5 in a random-effects meta-analysis, we would ‘only’ need six studies to have 80% power.
Now let us see what happens when we do a subgroup analysis, with the same assumptions (50 participants per study, I2 of 50% and a random-effects model) and a difference between the two subgroups of 0.5 (one subgroup has an SMD of 0.1 and the other of 0.6; and studies in the meta-analysis are evenly divided over the two subgroups). For such a subgroup analysis, a total of 22 studies would be needed to have 80% power, almost four times the number of studies needed for the main analyses.
Other scenarios
Varying subgroup differences
The number of studies needed for subgroup analyses increases exponentially when the difference in effect sizes between the subgroups gets smaller. For example, subgroup differences of 0.3, 0.2 and 0.1 correspond to a required number of studies equal to 56, 120 and 498 respectively. For small subgroup differences (e.g., SMD = 0.1), the number of studies required is 83 times that needed for the main analysis. As a result, meta-analysts should carefully consider the statistical power of subgroup analyses (especially when the expected subgroup differences are small).
Unbalanced subgroups
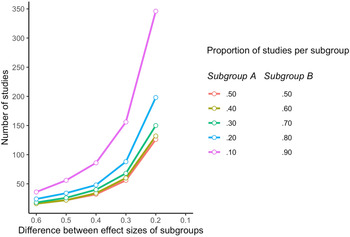
Thus far, the required number of studies to achieve 80% power assumed that the studies in the meta-analysis are evenly divided over the two subgroups (50% of studies in subgroup A and the other 50% in subgroup B). What happens when the included studies are not evenly divided, but when one subgroup is larger than the other? In Fig. 1 we graphically present the number of studies needed in different scenarios for subgroup analyses. We have indicated how many studies are needed for varying differences in effect sizes between the two subgroups on the horizontal axis (ranging from an SMD of 0.6–0.1) and for the proportion of the studies in each subgroup (50% of studies in both subgroups; 40% of studies in one subgroup and 60% in the other, 30% in one subgroup and 70% in the other, etc). As shown, the number of studies increases exponentially with a decreasing difference in effect size, when each subgroup includes 50% of studies. This exponential increase is even stronger when one subgroup is larger than the other. For example, when the SMD between the two subgroups is 0.2 and one subgroup has 20% of studies (the other 80%), then more than 200 studies are needed to realise 80% power; when one subgroup only includes 10% of the studies and the other 90%, more than 350 studies are needed when the SMD between the subgroups is 0.2.

Fig. 1. Number of studies needed in subgroup analyses within meta-analyses for 80% power, depending on the difference between the effect sizes of the subgroups and the proportion of studies in each subgroup.
Additional factors
Of course, the number of studies needed in subgroup analyses depends on several additional factors. When we want to use a threshold for sufficient power that is not 80% but for example 90%, the number of studies needed is also much higher. In our hypothetical meta-analysis (50 participants per study, I 2 = 50%, SMD between the two subgroups of 0.5) we need 22 studies for 80% power, but 28 for 90% power. That is more than four times the number of studies needed for the main analyses on the difference between treatment and control.
Another important factor is the level of heterogeneity. When heterogeneity is lower, less studies are needed. For example, when heterogeneity is low (I 2 = 25%) and the studies are evenly divided over the subgroups, 14 studies are needed for detecting an SMD between the subgroups of 0.5, more than twice the number for the main meta-analysis of our hypothetical example. When I 2 = 50% we would need 21 studies. When heterogeneity is higher than 50%, considerably more studies are needed for realising sufficient power. For the field of psychology, the degree of heterogeneity has been estimated to be 74% on average (Stanley et al., Reference Stanley, Carter and Doucouliagos2018). When we assume that heterogeneity is high (I 2 = 75%), then we need 42 studies in our hypothetical meta-analysis, twice the number for I 2 = 50% and seven times the number to find a main effect of the intervention of a similar magnitude.
How should subgroup analyses be used in meta-analyses?
Power calculations indicate that subgroup analyses in a meta-analysis require dozens to hundreds of studies for realising sufficient statistical power. The uncertainty of these analyses further increases when the quality of the included studies is suboptimal, and the different moderators are correlated with each other. Moreover, most meta-analyses include not one subgroup analysis for one moderator, but usually, several subgroup analyses are run for many different moderators. Subgroup analyses are also often not pre-specified, and multiple moderators may be examined while only a few are reported. Running multiple subgroup analyses can result in chance findings for only apparently significant moderators (Sun et al., Reference Sun, Briel, Busse, You, Akl, Mejza, Bala, Bassler, Mertz, Diaz-Granados, Vandvik, Malaga, Srinathan, Dahm, Johnston, Alonso-Coello, Hassouneh, Walter, Heels-Ansdell, Bhatnagar, Altman and Guyatt2012, Reference Sun, Ioannidis, Agoritsas, Agoritsas, Alba and Guyatt2014). In other words, subgroup analyses risk inflating not only beta errors but also alpha errors.
However, despite these problems with subgroup analyses it remains important to examine potential sources of heterogeneity in meta-analyses and subgroup analyses are an essential element of that. It is first of all important to keep in mind the old axiom that no evidence of a difference is not evidence of no difference. That is especially important because the power for subgroup analyses is so low. It is important to guard against alpha error inflation through limiting ourselves to a small number of subgroup analyses which should be pre-specified with reasons.
Author contributions
PC and JWG had the idea for this paper. JWG provided the software and the calculations. All authors critically discussed the best way to present the data and contributed to the final manuscript.
Financial support
No funding was received for this study.
Conflict of interest
PC reports support for unrelated grants from the European Commission, and ZonMw, for being Chair of the Mental Health Priority Area of the Wellcome Trust in London, UK, and he receives royalties for books, and for occasional workshops and invited addresses. JWG is the developer of the metapower package; however, he receives no monetary compensation from its users. TAF reports grants and personal fees from Mitsubishi-Tanabe, personal fees from MSD, personal fees from SONY, grants and personal fees from Shionogi, outside the submitted work; In addition, TAF has a patent 2020-548587concerning smartphone CBT apps pending, and intellectual properties for Kokoro-app licensed to Mitsubishi-Tanabe.

 Open access