


Introduction
In most of sub-Saharan Africa (SSA), crop production is practiced on highly variable soils, which have different biophysical constraints (Jones et al., Reference Jones, Breuning-Madsen, Brossard, Dampha, Deckers, Dewitte, Hallett, Jones, Kilasara, Le Roux, Micheli, Montanarella, Spaargaren, Tahar, Thiombiano, Van Ranst, Yemefack and Zougmore2013). A growing number of studies have shown that crops respond favourably to nitrogen (N), phosphorus (P) and potassium (K) fertilizers on some soils; but they do not respond in any significant manner on other soils, which are now called ‘non-responsive soils’ (Ichami et al., Reference Ichami, Shepherd, Sila, Stoorvogel and Hoffland2019; Kihara et al., Reference Kihara, Nziguheba, Zingore, Coulibaly, Esilaba, Kabambe, Njoroge, Palm and Huising2016; Nziguheba et al., Reference Nziguheba, van Heerwaarden and Vanlauwe2021; Roobroeck et al., Reference Roobroeck, Palm, Nziguheba, Weil and Vanlauwe2021; Vanlauwe et al., Reference Vanlauwe, Kihara, Chivenge, Pypers, Coe and Six2011). The problem of non-responsive soils is both widespread and severe in some countries. For example, in diagnostic trials across sites in Kenya, Malawi, Mali, Nigeria and Tanzania, 25% of the fields were non-responsive, whereas 28% showed low response to any nutrient amendment (Kihara et al., Reference Kihara, Nziguheba, Zingore, Coulibaly, Esilaba, Kabambe, Njoroge, Palm and Huising2016). In nutrient omission trials conducted on farmers’ fields across three states of Nigeria, Shehu et al. (Reference Shehu, Merckx, Jibrin, Kamara and Rurinda2018) found 9–16% of the maize fields to be non-responsive to any nutrient application. In a recent meta-analysis, non-responsive soils constituted 14% for Kenya and 11% for SSA (Ichami et al., Reference Ichami, Shepherd, Sila, Stoorvogel and Hoffland2019). In a study by Roobroeck et al. (Reference Roobroeck, Palm, Nziguheba, Weil and Vanlauwe2021), NPK fertilizers also failed to increase maize yields by more than 0.5 t ha−1 in up to 68 % of the farmers’ fields in western Kenya, eastern DR Congo, west-central Tanzania and northern Nigeria. Using data sets from 41 on-farm fertilizer response trials across 11 countries, Nziguheba et al. (Reference Nziguheba, van Heerwaarden and Vanlauwe2021) estimated the proportion of non-responsive fields at 4.9% for cereals and 17% for legumes. Nziguheba et al. (Reference Nziguheba, van Heerwaarden and Vanlauwe2021) further estimated that roughly 0.3–2.5 million ha of cereal and 3.2–4.6 million ha of legume fields could be non-responsive in any particular year. Poor and variable crop responses to nutrient inputs may pose a barrier to fertilizer adoption (Nziguheba et al., Reference Nziguheba, van Heerwaarden and Vanlauwe2021). However, non-responsiveness is neither well-defined nor its extent and causes fully understood in SSA (Roobroeck et al., Reference Roobroeck, Palm, Nziguheba, Weil and Vanlauwe2021; Ichami et al., Reference Ichami, Shepherd, Sila, Stoorvogel and Hoffland2019).
The frequently cited causes of low response include farmer management practices, soil organic matter (SOM) content, clay content, soil acidity, nutrient deficiencies and imbalances, soil moisture deficits and competition by parasitic weeds (Ichami et al., Reference Ichami, Shepherd, Sila, Stoorvogel and Hoffland2019; Kihara et al., Reference Kihara, Nziguheba, Zingore, Coulibaly, Esilaba, Kabambe, Njoroge, Palm and Huising2016; Njoroge et al., Reference Njoroge, Otinga, Okalebo, Pepela and Merckx2018; Roobroeck et al., Reference Roobroeck, Palm, Nziguheba, Weil and Vanlauwe2021; Vanlauwe et al., Reference Vanlauwe, Kihara, Chivenge, Pypers, Coe and Six2011). Although farmer’s field management may play a key role in crop response, management alone may not explain the broader occurrence of non-responsiveness. Nor was SOM a defining factor where soil organic carbon (SOC) content was low for all the response classes in studies by Kihara et al. (Reference Kihara, Nziguheba, Zingore, Coulibaly, Esilaba, Kabambe, Njoroge, Palm and Huising2016) and Njoroge et al. (Reference Njoroge, Otinga, Okalebo, Pepela and Merckx2018). The application of secondary nutrients and micronutrients also did not significantly increase response to N and P on some soil types (Kihara et al., Reference Kihara, Sileshi, Nziguheba, Kinyua, Zingore and Sommer2017). Even under good organic input management, maize yield responses to N, P and K fertilizer inputs have been very modest. The median yield gain over the no-input control was 0.6 t ha−1 with green manure legumes (Sileshi et al., Reference Sileshi, Akinnifesi, Ajayi and Place2008) and 1.3 t ha−1 with animal manure applied in excess of 10 t ha−1 yr-1 (Sileshi et al., 2017; Reference Sileshi, Jama, Vanlauwe, Negassa and Harawa2019). Thus, the problem of non-responsive soils remains a conundrum. It is also not clear under what conditions and with what probability non-responsiveness occurs on farmers’ fields. More recent analyses focusing on fertilizer and grain prices also reveal considerable variation in the profitability of fertilizers within countries (Bonilla-Cedrez et al., Reference Bonilla-Cedrez, Chamberlin and Hijmans2021). This emphasizes the need for tailoring fertilizer recommendations to smaller areas targeting localized environmental conditions (Bonilla-Cedrez et al., Reference Bonilla-Cedrez, Chamberlin and Hijmans2021).
African soils have been derived from diverse parent materials and mineralogical composition (Jones et al., Reference Jones, Breuning-Madsen, Brossard, Dampha, Deckers, Dewitte, Hallett, Jones, Kilasara, Le Roux, Micheli, Montanarella, Spaargaren, Tahar, Thiombiano, Van Ranst, Yemefack and Zougmore2013; Towett et al., Reference Towett, Shepherd, Tondoh, Winowiecki, Lulseged, Nyambura, Sila, Vågenb and Cadish2015) that cause significant variability in crop response to nutrient inputs (Sileshi et al., Reference Sileshi, Akinnifesi, Debusho, Beedy, Ajayi and Mong’omba2010). Patterns of variation in element concentrations in SSA are largely due to the high variability in mineralogy (Towett et al., Reference Towett, Shepherd, Tondoh, Winowiecki, Lulseged, Nyambura, Sila, Vågenb and Cadish2015). Clay minerals, mainly composed of silica, aluminium (Al), iron (Fe) and manganese (Mn) oxides, play an important role in the supply, retention and fixation of many macronutrients and micronutrients (Batjes, Reference Batjes2011; Florence et al., Reference Florence, Ransom and Mengel2017; Jones et al., Reference Jones, Breuning-Madsen, Brossard, Dampha, Deckers, Dewitte, Hallett, Jones, Kilasara, Le Roux, Micheli, Montanarella, Spaargaren, Tahar, Thiombiano, Van Ranst, Yemefack and Zougmore2013). Generally, soils with low-activity clay minerals have low capacity to supply nutrients than do high-activity clay minerals (Jones et al., Reference Jones, Breuning-Madsen, Brossard, Dampha, Deckers, Dewitte, Hallett, Jones, Kilasara, Le Roux, Micheli, Montanarella, Spaargaren, Tahar, Thiombiano, Van Ranst, Yemefack and Zougmore2013). Soils that contain 2:1 clay minerals can fix NH4 and K within their lattice structures (Florence et al., Reference Florence, Ransom and Mengel2017; Scherer et al., Reference Scherer, Feils and Beuters2014), whereas soils rich in 1:1 clay minerals and amorphous clay (e.g., allophane) have a high capacity for P fixation (Batjes, Reference Batjes2011). The capacity of clay minerals to fix nutrients can influence responsiveness of soils to applied N, P and K inputs. Thus, the full agronomic potential of fertilizer inputs cannot be realised unless the conditions under which non-responsiveness occurs and its underlying causes are identified, and measures are formulated to address the specific limitations on a case-by-case basis.
Although recent meta-analyses and reviews (e.g., Ichami et al., Reference Ichami, Shepherd, Sila, Stoorvogel and Hoffland2019; Jama et al., Reference Jama, Kimani, Kiwia, Rebbie and Sileshi2017; Kihara et al., Reference Kihara, Sileshi, Nziguheba, Kinyua, Zingore and Sommer2017; Sileshi et al., Reference Sileshi, Akinnifesi, Debusho, Beedy, Ajayi and Mong’omba2010) have shown variations in maize yield response to N, P and K fertilizers with soil type, the underlying mechanisms for lack of response remain unclear. The linkage between crop response and parent materials, clay mineralogy and the resilience of soils to erosion has also received little attention in SSA. Examining these linkages can provide useful insights into the pervasive problem of non-responsive soils. Therefore, the objectives of this study were to (1) quantify the relative risks of “no response” to N, P and K inputs on different soil types and (2) determine the linkage between crop response, parent materials and the mineralogy of soils and their resilience to erosion. Resilience refers to the intrinsic susceptibility of the soil to erosion and attendant degradation (Stocking, Reference Stocking2003). We hypothesise that (1) responsiveness to N, P and K fertilizers is linked to their mineralogy and resilience to erosion and (2) the risk of no response is higher on farmers’ fields than on research stations across soil types.
Methods
For all analyses, we used maize yield because maize is a strategic crop in most countries in SSA, and more than 200 million people depend on it as a source of food and income (Abate et al., Reference Abate, Fisher, Abdoulaye, Kassie, Lunduka, Marenya and Asnake2017). Maize was also chosen because data were widely available from research stations and farmers’ fields to test our hypothesis. But we believe the insights gained can be applicable to other crops.
Data compilation
We compiled a large data set on maize grain yield (in t ha−1) with N, P and K fertilizer and the corresponding yield from the control (without any external nutrient inputs) on 542 sites across 23 countries (Table 1) accounting for over 90% of the maize area harvested in SSA. The sites covered all agroecological zones (Figure 1a) and most of the soil types on which maize is grown (Table 1; Figure 1b). We retrieved the data from trials conducted under 23 projects supported by the Alliance for a Green Revolution in Africa, eight legacy data sets, and 147 peer-reviewed studies (Supplementary Table S1). The legacy data sets included trials implemented by the Food and Agriculture Organization (FAO), the World Agroforestry Centre (ICRAF) and the International Center for Tropical Agriculture (CIAT) across SSA. When extracting data, we only included studies that used improved cultivars of maize grown with fertilizer and the same cultivar grown without fertilizer. We also included data only when yield data came from N application rates of at least 48 kg N ha−1 and 10 kg P ha−1 on elemental basis. These minimum N and P rates were required because levels below those were deemed to be inadequate to satisfy the requirement of a maize cultivar with yields exceeding 3 t ha−1. Improved cultivars of maize on average use 24 kg N ha−1 and 12 kg P ha−1 to produce 1 t ha−1 of maize grain (Zingore et al., Reference Zingore, Njoroge, Chikowo, Kihara, Nziguheba and Nyamangara2014). Therefore, N and P rates below these will not have enabled us to detect the yield response of improved maize cultivars. The 3 t ha−1 yield target corresponds to the minimum required to kick start the African green revolution (Sánchez, Reference Sánchez2015). In all trials, all agronomic practices, including weeding, planting date, density, were applied optimally following the recommended practices for the site.
Table 1. Soil type, the number of countries and sites covered in this analysis (details in supplementary material tables S1), total number of observations (N), resilience to erosion, clay activity, P fixation capacity, clay content, sand content, cation exchange capacity (CEC in cmolc kg-1), base saturation percentage (BSP), pH and soil organic carbon (SOC) content

NA = not available.
* Site represents geographic areas at district or comparable level, where several farms were covered.
† Clay activity classes are as defined in Jones et al. (Reference Jones, Breuning-Madsen, Brossard, Dampha, Deckers, Dewitte, Hallett, Jones, Kilasara, Le Roux, Micheli, Montanarella, Spaargaren, Tahar, Thiombiano, Van Ranst, Yemefack and Zougmore2013).
‡ P fixation categories are as defined in Batjes (Reference Batjes2011).
§ Resilience to degradation following Stocking (Reference Stocking2003) and IUSS (2014).
‖ Parent material is defined in Supplementary Table S2.
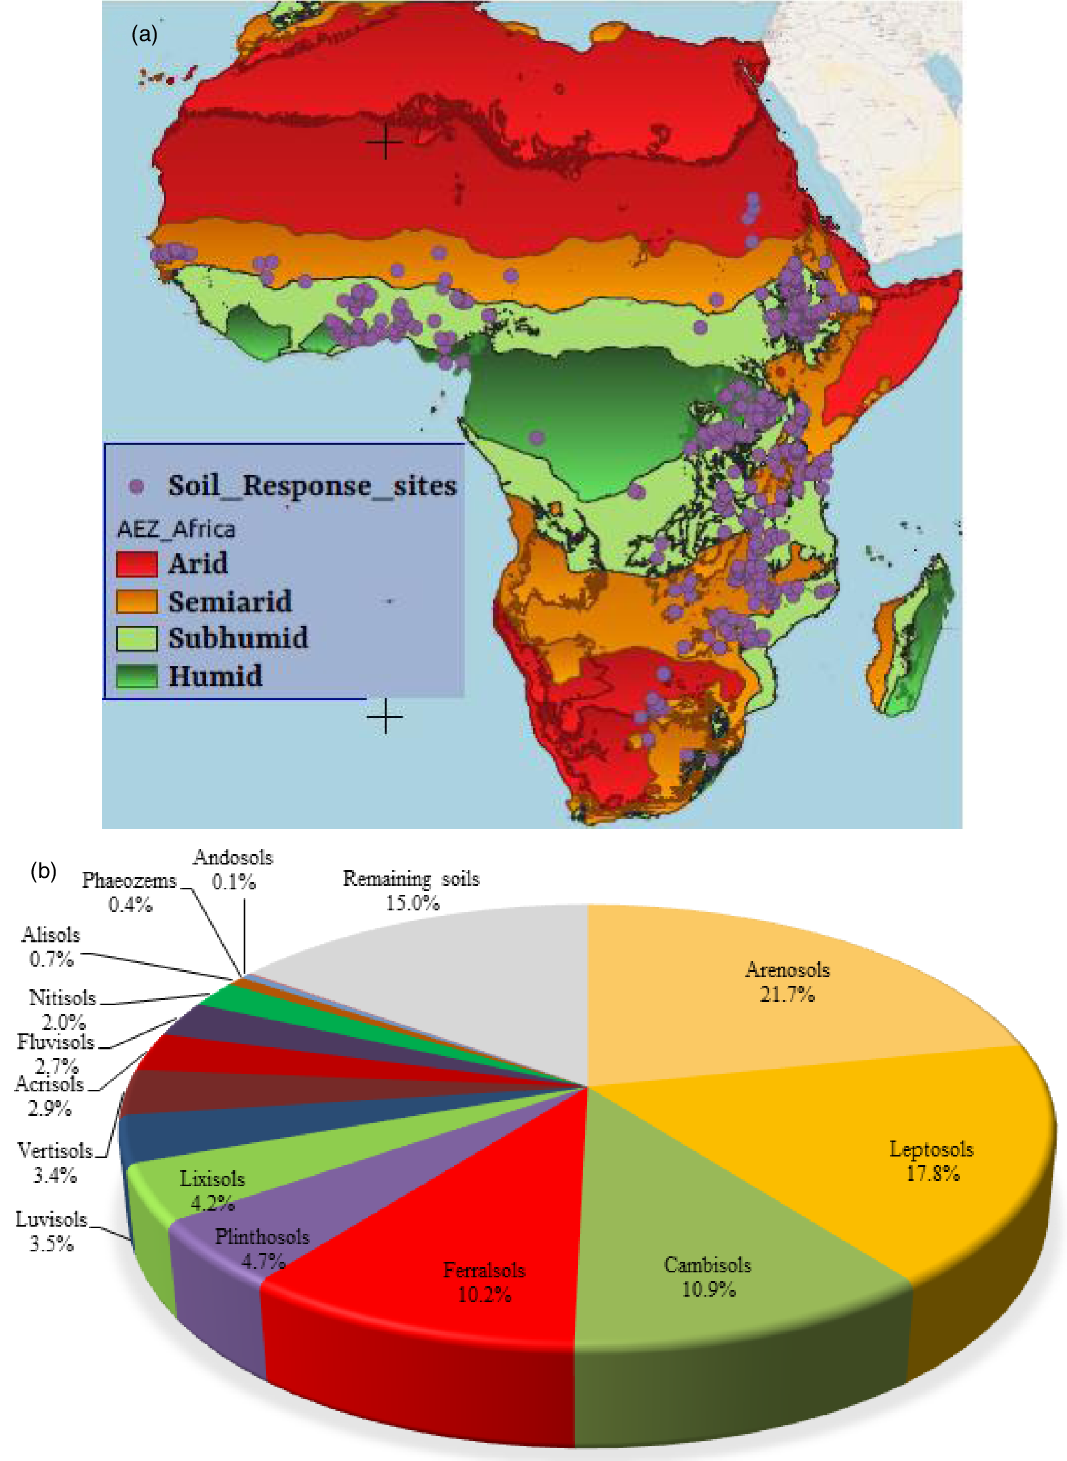
Figure 1. (a) Map of agroecological zones and trial sites across Africa and (b) the percentage area of continental Africa covered by each of the soil types included in this study (Data from Jones et al., Reference Jones, Breuning-Madsen, Brossard, Dampha, Deckers, Dewitte, Hallett, Jones, Kilasara, Le Roux, Micheli, Montanarella, Spaargaren, Tahar, Thiombiano, Van Ranst, Yemefack and Zougmore2013).
For each trial site, we extracted grain yield, the amount of N, P and K fertilizer applied (in kg ha−1), the geographic coordinates, agroecological zones (AEZ), elevation and information on soil type where available. Across the sites, the median N rate, P rate and K rate were 80, 20 and 25 kg ha−1, respectively. The K fertilizer was applied only on 45.9% of the sites, and therefore our primary focus is on N and P response. On some of the sites where K fertilizer was applied, the rates were not mentioned. Therefore, we created an additional category for K application coded as ‘applied’ or ‘omitted’. Soil pH, SOM, sand and clay content of the till layer (0–20 cm depth) of the trial sites were also extracted from the studies as these are considered to be fundamental indicators of the agricultural potential of a soil (Gray et al., Reference Gray, Humphreys and Deckers2009). Since some studies had reported soil organic carbon (SOC), to facilitate analysis we converted all SOM to SOC by dividing SOM by 1.72. We have presented the SOC, pH, clay and sand content of the different soil type in the form of box and whisker plots in Supplementary Figures S1 and S2. In addition, we extracted the base saturation percentage (BSP), cation exchange capacity (CEC), pH and SOC content from ISSS (1998). We also extracted information about clay activity of the different soil types from Gray et al. (Reference Gray, Humphreys and Deckers2011) and ISSS (1998).
The soil type strictly refers to the WRB Reference Soil Groups (RSG) and the Soil Atlas of Africa (IUSS, 2014; Dewitte et al., Reference Dewitte, Jones, Spaargaren, Breuning-Madsen, Brossard, Dampha, Deckers, Gallali, Hallett, Jones, Kilasara, Le Roux, Michéli, Montanarella, Thiombiano, van Ranst, Yemefack and Zougmore2013; Jones et al., Reference Jones, Breuning-Madsen, Brossard, Dampha, Deckers, Dewitte, Hallett, Jones, Kilasara, Le Roux, Micheli, Montanarella, Spaargaren, Tahar, Thiombiano, Van Ranst, Yemefack and Zougmore2013). The third edition of the WRB published in 2014 (IUSS, 2014) provides the most up-to-date classification of soils of the world. This edition has replaced Albeluvisols of earlier edition with Retisols and Lithosols with Leptosols. It has also broadened the definition of Gleysols and Arenosols and narrowed the definition of Acrisols, Alisols, Luvisols and Lixisols (IUSS, 2014). Therefore, we assigned older soil names and those given in other systems to the updated WRB RSG through pro parte matching. When soil type was not given for a site, we extracted the information from the harmonised Soil Atlas of Africa (Jones et al., Reference Jones, Breuning-Madsen, Brossard, Dampha, Deckers, Dewitte, Hallett, Jones, Kilasara, Le Roux, Micheli, Montanarella, Spaargaren, Tahar, Thiombiano, Van Ranst, Yemefack and Zougmore2013) using the locational information. Accordingly, we identified a total of 14 RSGs from the trial sites (Table 1; Supplementary Table S1). These are briefly described below following the mineralogy of their parent materials (Supplementary Table S2) and soil-forming processes as described in Gray et al. (Reference Gray, Humphreys and Deckers2011) and (IUSS, 2014). Based on their parent materials, soils are often classified as calcareous, silicic or mafic (Gray et al., Reference Gray, Humphreys and Deckers2011; Jones et al., Reference Jones, Breuning-Madsen, Brossard, Dampha, Deckers, Dewitte, Hallett, Jones, Kilasara, Le Roux, Micheli, Montanarella, Spaargaren, Tahar, Thiombiano, Van Ranst, Yemefack and Zougmore2013). Calcareous parent materials include limestone, dolomite, calcareous shale and sands with >50% CaCO3 or MgCO3 (Gray et al., Reference Gray, Humphreys and Deckers2011). Silicic (also called acidic) refers to rocks that contain significant amounts of silica (>68% Si), while intermediate parent materials contain 52–68% Si. The term mafic (basic) is applied to rocks with relatively low amounts of silica (45–52% Si) (Gray et al., Reference Gray, Humphreys and Deckers2011). The 14 RSGs of the trial sites in alphabetic order are Acrisols, Alisols, Andosols, Arenosols, Cambisols, Ferralsols, Fluvisols, Leptosols, Lixisols, Luvisols, Nitisols, Phaeozems, Plinthosols and Vertisols together covering 85% of the land area of continental Africa (Figure 1b).
Acrisols are weathering products of a wide variety of intermediate parent material under humid climates (Gray et al., Reference Gray, Humphreys and Deckers2011). They typically occur on old land surfaces with hilly or undulating topography (Gray et al., Reference Gray, Humphreys and Deckers2011; IUSS, 2014). They are acidic, strongly leached and have low base status (Table 1). Acrisols also have low resilience to erosion, they become degraded very quickly (Stocking, Reference Stocking2003) and lose their productivity rapidly when cultivated without adequate soil cover (Sileshi et al., Reference Sileshi, Akinnifesi, Debusho, Beedy, Ajayi and Mong’omba2010). They require substantial applications of fertilizer to produce satisfactory crop yields.
Alisols evolve from intermediate parent material under humid climates in hilly or undulating topography (Gray et al., Reference Gray, Humphreys and Deckers2011; IUSS, 2014). They are characterised by very low pH and SOC content (Table 1; Supplementary Figure S1), high-activity clay rich in exchangeable Al (IUSS, 2014) and Al toxicity. They are also prone to drought and have an unstable surface, which makes them susceptible to erosion (IUSS, 2014).
Andosols are relatively young soils formed from glass-rich volcanic ejecta and pyroclastic materials (IUSS, 2014). Andosols may also develop from silicate-rich materials under acid weathering in humid climates. They occur in undulating to mountainous regions. They have high SOC content, high pH, high clay activity (Table 1; Supplementary Figure S1) and are generally fertile. But they have the highest P fixation capacity, which is caused by active Al and Fe and their amorphous clay (allophane) mineralogy (Batjes, Reference Batjes2011; IUSS, 2014).
Arenosols are deep sandy soils that develop on extremely silicic (>85% Si) parent materials. They can also evolve from weathering of quartz-rich sediments or from Ferralsols after kaolinite weathering (IUSS, 2014). They develop under a wide range of annual rainfall, varying from very dry (<500 mm) to extremely wet (>2000 mm) climates (Gray et al., Reference Gray, Humphreys and Deckers2011). They represent the largest soil type covering 21.5% of the land area of Africa (Figure 1b). Arenosols are characterised by high permeability, low water and nutrient storage capacity (IUSS, 2014) and low SOC content (Supplementary Figure S1). They are also easily erodible.
Cambisols are derived from a wide range of intermediate parent material of medium to fine texture under very dry to wet climates (Gray et al., Reference Gray, Humphreys and Deckers2011). They represent the third largest soil type covering 10.8% of the land area of Africa (Figure 1b). They are relatively young soils with slight to moderate weathering (IUSS, 2014). Cambisols are characterised by high resilience, high SOC content, high clay activity and low P fixation (Table 1; Supplementary Figure S1). They also do not contain appreciable amounts of Al and Fe compounds (IUSS, 2014).
Ferralsols represent deeply weathered red or yellow soils of the humid tropics. They develop on intermediate silicious parent material under very wet climates on level to undulating land (Gray et al., Reference Gray, Humphreys and Deckers2011). Ferralsols represent the fourth largest soil type covering 10.3% of the land area of Africa (Figure 1b). They are dominated by low-activity clay minerals, mainly kaolinite (IUSS, 2014). They have good physical properties including great soil depth, permeability and stable microstructure making them less susceptible to erosion (IUSS, 2014). However, they are inherently acidic (Table 1; Supplementary Figure S1), nutrient-poor and suffer from high P fixation caused by Fe and Al oxides (IUSS, 2014).
Fluvisols are young soils in fluvial, lacustrine or marine deposits. They have good natural fertility because they occur in periodically flooded areas receiving fresh sediment (IUSS, 2014). The have high SOC content, high pH, high clay activity and base saturation (Table 1; Supplementary Figure S1).
Leptosols are very thin soils that are extremely rich in coarse fragments over continuous rock (IUSS, 2014). The have low SOC content, high pH and high base saturation (Table 1; Supplementary Figure S1). They occur in all climate zones, in particular in strongly eroding mountainous regions. They are the second largest soil type in SSA, and they cover 17.5% of the land area of continental Africa (Figure 1b). Erosion is the greatest threat to Leptosols in cultivated areas.
Lixisols are weathering products of highly silicic parent material (65–85% Si) in seasonally dry tropical regions on flat land to sloping land (Gray et al., Reference Gray, Humphreys and Deckers2011). They form in a variety of strongly weathered and fine textured materials (IUSS, 2014). Lixisols have low resilience to erosion. When degraded, they are prone to slaking and erosion. Tillage and use of heavy machinery compact the soil causing structural deterioration (IUSS, 2014).
Luvisols evolved from a wide variety of intermediate silicious parent material in regions with distinct dry and wet seasons (Gray et al., Reference Gray, Humphreys and Deckers2011; IUSS, 2014). They are characterised by high-activity clays and a high base saturation (Table 1). Most Luvisols are fertile and suitable for a wide range of agricultural uses. However, Luvisols with a high silt content are susceptible to structural degradation when tilled with heavy machinery, while Luvisols on steep slopes are prone to erosion (IUSS, 2014).
Nitisols are deep, well-drained and clay-rich soils formed of mafic parent material under wet to very wet and warm conditions on level to hilly land (Gray et al., Reference Gray, Humphreys and Deckers2011; IUSS, 2014). Their clay is dominated by kaolinite and/or (meta) halloysite. Nitisols have good internal drainage and fair water holding properties. Nitisols also have clay content >30% and relatively high SOC content in surface soils (Supplementary Figure S1). Their deep and porous soil and their stable structure permit deep rooting and make them resistant to erosion (IUSS, 2014). However, they suffer from high P fixation (Batjes, Reference Batjes2011) and acidification (Agegnehu et al., Reference Agegnehu, Amede, Erkossa, Yirga, Henry, Tyler, Nosworthy, Beyene and Sileshi2021).
Phaeozems are weathering products of mafic parent material in warm to cool climates on flat to undulating land (Gray et al., Reference Gray, Humphreys and Deckers2011). They have dark, humus-rich surface horizons, and porous and fertile soils. But wind and water erosions are serious hazards (IUSS, 2014).
Plinthosols are soils with plinthite, petroplinthite or pisoliths. The later develop from plinthite by hardening. Plinthite is a Fe-rich and/or Mn-rich, humus-poor mixture of kaolinitic clay and other products of strong weathering such as gibbsite and quartz (IUSS, 2014). Plinthosols occur on level to gently sloping areas with seasonally fluctuating groundwater or stagnating surface water. They have poor natural soil fertility caused by strong weathering, and they are prone to concretions or formation of hardpan (IUSS, 2014). They also have very low SOC content (Supplementary Figure S1).
Vertisols are heavy clay soils with a high proportion of swelling clays. Smectite is the major clay mineral, while kaolinite is of secondary importance. Vertisols are weathering products of mafic parent material (Gray et al., Reference Gray, Humphreys and Deckers2011) occurring in depressions and level plains in climates varying from semiarid to humid with an alternation of distinct wet and dry seasons (IUSS, 2014). Although they have good chemical fertility, their use is limited by their susceptibility to waterlogging when wet and moisture stress when dry.
Criteria and metrics
In the past, non-responsiveness was evaluated using different metrics (e.g., yield gain vs response ratios). Kihara et al. (Reference Kihara, Nziguheba, Zingore, Coulibaly, Esilaba, Kabambe, Njoroge, Palm and Huising2016) separated non-responsive soils into two clusters based on the yield in the fertilized plots: non-responsive poor (<3 t ha−1) and non-responsive fertile soils (>3 t ha−1). Similarly, Njoroge et al. (Reference Njoroge, Otinga, Okalebo, Pepela and Merckx2018) defined soils as responsive when yield increases by 2 t ha−1 above the control. On the other hand, Roobroeck et al. (Reference Roobroeck, Palm, Nziguheba, Weil and Vanlauwe2021) used yield gain of <0.5 t ha−1 to categorise farms as non-responsive to NPK fertilizer in maize and <0.15 t ha−1 in soybean. Ichami et al. (Reference Ichami, Shepherd, Sila, Stoorvogel and Hoffland2019) used the response ratio (RR) to categorise soils as responsive and non-responsive to fertilizer. To achieve a more rigorous classification, we applied two criteria, namely, mean effects and probabilities of no response. We also distinguished between metrics of (1) overall non-responsiveness and (2) non-responsiveness to specific nutrients. We used the RR as defined by Ichami et al. (Reference Ichami, Shepherd, Sila, Stoorvogel and Hoffland2019) and yield gain of <0.5 t ha−1 as defined by Roobroeck et al. (Reference Roobroeck, Palm, Nziguheba, Weil and Vanlauwe2021) to judge the overall non-responsiveness of soils to NPK fertilizer. The RR is the ratio of some measured quantity in experimental and control groups, which quantifies the proportionate change that results from an experimental manipulation (Hedges et al., Reference Hedges, Gurevitch and Curtis1999). We calculated RR by dividing the treatment yield by the control yield and. We transformed the RR values to their natural logarithm, i.e., ln(RR), to satisfy the assumptions of normality and homogeneity of error variance (Hedges et al., Reference Hedges, Gurevitch and Curtis1999).
To quantify the lack of response to one nutrient, we used the agronomic use efficiency of N (AEN), P (AEP) and K (AEK) as the effect size metrics. Negative values of AEN and AEP are common in empirical studies (Jama et al., Reference Jama, Kimani, Kiwia, Rebbie and Sileshi2017; Kihara et al., Reference Kihara, Nziguheba, Zingore, Coulibaly, Esilaba, Kabambe, Njoroge, Palm and Huising2016; Vanlauwe et al., Reference Vanlauwe, Kihara, Chivenge, Pypers, Coe and Six2011), but these are often thought to be inexplicable (Kihara and Njoroge, Reference Kihara and Njoroge2013; Vanlauwe et al., Reference Vanlauwe, Kihara, Chivenge, Pypers, Coe and Six2011). We calculated AEN, AEP and AEK following Ladha et al. (Reference Ladha, Pathak, Krupnik, Six and van Kessel2005) as
 $${\rm{AEN}} = \left( {{{\rm{Y}}_{\rm{t}}} - {{\rm{Y}}_{\rm{c}}}} \right)/{{\rm{N}}_{\rm{i}}}$$
 $${\rm{AEP}} = \left( {{{\rm{Y}}_{\rm{t}}} - {{\rm{Y}}_{\rm{c}}}} \right)/{{\rm{P}}_{\rm{i}}}$$
 $${\rm{AEK}} = \left( {{{\rm{Y}}_{\rm{t}}} - {{\rm{Y}}_{\rm{c}}}} \right)/{{\rm{K}}_{\rm{i}}}$$
where Yt and Yc are the grain yields (in kg ha−1) in the treatment and the control, whereas Ni, Pi and Ki represent N, P and K inputs (in kg ha−1), respectively. We defined ‘no response’ as zero agronomic response, i.e., a case where the yield differences between fertilized and unfertilized treatments is 0 or lower than 0 (Nziguheba et al., Reference Nziguheba, van Heerwaarden and Vanlauwe2021) resulting in RR ≤ 1 (Ichami et al., Reference Ichami, Shepherd, Sila, Stoorvogel and Hoffland2019) or AEN ≤ 0, AEP ≤ 0 or AEK ≤ 0. We also took AEN, AEP and AEK below their first quartiles as indicative of “low response” to N, P and K. In the data analysed here, the first quartiles were 10, 30 and 20 kg kg-1 for AEN, AEP and AEK, respectively. AEN < 10 kg kg-1 is also considered too low (Vanlauwe et al., Reference Vanlauwe, Kihara, Chivenge, Pypers, Coe and Six2011). Accordingly, we took AEN ≤ 10, AEP ≤ 30 and AEK ≤ 20 as additional criteria to represent “low response”.
Statistical analysis
We applied exploratory analysis using general linear models to evaluate the relative contribution of agroecological zones, soil type, trial location (on research station vs farmers’ fields) and K application (applied vs omitted) to the variations in RR, AEN, AEP and AEK. Then, we calculated the percentage of variation explained from the type 3 sum of squares (Supplementary Table S3). Soil type contributed the largest proportion of the explained variations in RR, AEN, AEP and AEK, whereas the contributions of agroecological zone and trial location were very small (Supplementary Table S3). In addition, we implemented multiple regression analysis to evaluate the contribution of SOC, pH, clay content, N rate, P rate and K rate to the variations in RR, AEN, AEP and K. These variables together explained only ∼7.8, 2.8, 15.2 and 20.3% of the variations in RR, AEN, AEP and AEK, respectively (Supplementary Table S4). SOC did not significantly contribute to the variation in RR and AEP and AEK (Supplementary Table S4). Although soil pH and clay content had statistically significant effects, their partial R 2 values were <0.05 (Supplementary Table S4). Given the relatively small contributions of soil pH and SOC to the various metrics, we focused our attention on soil type. We undertook two sets of analyses to get a deeper understanding of the variations in non-responsiveness.
Our first set of analyses involved linear mixed effects models (LMM) implemented via restricted maximum likelihood (REML) estimation in the SAS system. To accommodate imbalances in sample sizes among predictors, we used the Kenward–Roger method for approximating the denominator degrees of freedom (Spilke et al., Reference Spilke, Piepho and Hu2005). Initially, we tested various models by adding or removing variables until an optimal model was achieved. At each step, we examined improvements in model fit using the Akaike Information Criterion (AIC). We used agroecological zone (A), soil type (S), trial location (L), N fertilizer rate (N), P rate (P), K application (K), soil clay content, pH and SOC content as the fixed effects. We entered country as the random effect because data from one country are likely to be more correlated than data from another country. We calculated the intraclass correlation coefficient (ICC) as the ratio of the covariance estimate of the random effect (i.e., country) to the covariance estimate of the residual + random effect. The ICC estimates how much of the total variation in the outcome is accounted for by the random effect. Our initial analyses revealed that entering soil pH, SOC and clay content in the same model with soil type was problematic for two reasons: (1) pH, clay and SOC measurements were available for only 29–30% of the sites and (2) most soil type have characteristic soil pH, SOC and clay contents that vary in a narrow range (Table 1; Supplementary Figure S1). Taking these facts into consideration, we included a reasonable set of variables (Supplementary Table S5) in our mixed models for the control yield (CY), treatment yield (TY), yield gain (YG), RR, AEN, AEP and AEK specified as follows:
 $${\rm{C}}{{\rm{Y}}_{ijk}} = {A_i} + {S_j} + {L_k} + {\epsilon _{ijk}}$$
 $${\rm{T}}{{\rm{Y}}_{ijklmn}} = {A_i} + {S_j} + {L_k} + {N_l} + {P_m} + {K_n} + {\epsilon _{ijklmn}}$$
 $${\rm{Y}}{{\rm{G}}_{ijklmn}} = {A_i} + {S_j} + {L_k} + {N_l} + {P_m} + {K_n} + {\epsilon _{ijklmn}}$$
 $${\rm{ln}}{({\rm{RR}})_{ijklmn}} = {A_i} + {S_j} + {L_k} + {N_l} + {P_m} + {K_n} + {\epsilon _{ijklmn}}$$
 $$AE{N_{ijklm}} = {A_i} + {S_j} + {L_k} + {P_l} + {K_m} + {\epsilon _{ijklm}}$$
 $$AE{P_{ijklm}} = {A_i} + {S_j} + {L_k} + {N_l} + {K_m} + {\epsilon _{ijklm}}$$
 $$AE{K_{ijklm}} = {A_i} + {S_j} + {L_k} + {N_l} + {P_m} + {\epsilon _{ijklm}}$$
To avoid confounding of AEN, AEP and AEK with N rate, P rate and K application, we omitted the respective nutrient rates from equations 8, 9 and 10.
We implemented a second set of analyses with the premise that information on the probability (ϕ) of falling below a critical level or exceeding a desired target yield is more useful than mean values for decision making. Here, we implemented stepwise logistic regression of the forms given in equations 6–10 using the same variables used in the LMM (Supplementary Table S6) to predict the probabilities of no response in terms of YG, RR, AEN, AEP and AEK. We analysed binary responses after dummy-coding the response variables. For example, we coded YG as ‘0’ when YG values are <0.5 t ha−1 and ‘1’ when they exceed 0.5 t ha−1. We coded RR as ‘0’ when its values are ≤1 and ‘1’ when they exceed 1. Similarly, we coded AEN, AEP and AEK as ‘0’ when their values are ≤ 0 and ‘1’ when they exceed 0. We implemented stepwise logistic regression using the Logistic procedure of the SAS system. Using the best model thus selected, we generated the predicted probabilities (ϕ) for each observation, and then ϕ for each soil controlling for the other independent variables retained in the final model. Our analytical procedure uses the average marginal effects (AME) of both categorical and continuous predictors to estimate individual, cross-validated, predicted probabilities. The AME was preferred over other marginal effects as it represents the effect for a case picked at random from the sample (Breen et al., (Reference Breen, Karlson and Holm2018) and as such being the most representative. For the continuous predictors (e.g., N rate, P rate), the AME is the partial derivative of the event probability (i.e., no response) with respect to the predictor of interest. For the categorical predictors (e.g., agroecology, soil type, location, K application), the AME is the change in event probability when each predictor is changed between its levels. Accordingly, we estimated the probability of ‘no response’ as well as ‘low response’ as defined above.
In the same manner, we also estimated ϕ of the various metrics for the different classes of parent materials, resilience to erosion, clay activity and P fixation capacity of soils. Here, we replaced soil type with each of these variables in equations 6–10. Following Gray et al. (Reference Gray, Humphreys and Deckers2011), we grouped parent materials of the soils on the trial sites into “silicic,” “intermediate” and “mafic” before analysis (Table 1). None of the study sites were on calcareous parent material. We also grouped the soil types based on their clay activity as “high” and “low” activity soils (Table 1). High-activity clay minerals are less weathered, have high effective surface area and high cation exchange capacity (CEC) ≥ 24 cmol/kg clay with 2:1 clay lattice (2 silica sheets per 1 alumina sheet, e.g., montmorillonite, smectite, vermiculite, illite and chlorite) or amorphous (non-crystalline) materials like allophane, inmogolite and halloysite. Low-activity clay minerals are highly weathered and have low CEC (≤ 24 cmol/kg clay) and 1:1 lattice (one silica sheet per alumina sheet, e.g., kaolinite or halloysite) (Jones et al., Reference Jones, Breuning-Madsen, Brossard, Dampha, Deckers, Dewitte, Hallett, Jones, Kilasara, Le Roux, Micheli, Montanarella, Spaargaren, Tahar, Thiombiano, Van Ranst, Yemefack and Zougmore2013). In addition, we grouped the soil types into classes of resilience to erosion as “low” or “high” following Stocking (Reference Stocking2003) and P fixation capacity as “low,” “moderate” or “high” following Batjes (Reference Batjes2011) before analyses.
Results
Grain yield and yield gain (YG)
Maize grain yields in the control significantly (p < 0.001) varied with agroecological zones, trial location and soil type, while yields in the NPK fertilizer significantly varied with soil type, N rate and K application. The highest and lowest control yields were recorded on Andosols and Alisols, respectively (Figure 2a). With NP fertilizer, Andosols also consistently produced significantly higher yields than Leptosols, Alisols and Arenosols (Figure 2b). Relative to sites where K was omitted, sites where K was applied had 0.2–1.4 t ha−1 higher yields. Larger yield increases were recorded on Arenosols (54%), Acrisols (45%) and Fluvisols (31%) when K was applied, while K application led to lower yields than K omission on Cambisols, Leptosols, Lixisols, Phaeozems and Plinthosols (Supplementary Table S7). The probability of exceeding 3 t ha−1 with NPK fertilizer was higher (ϕ > 0.80) on Andosols, Nitisols and Vertisols but very low (ϕ < 0.30) on Alisols and Arenosols (Table 2). On 8.7% of the sites YG was less than 0.5 t ha−1. The probability of no response (YG < 0.5 t ha−1) was twice as much on soils formed on silicic than mafic parent materials and on soils with low resilience than those with high resilience to erosion (Table 3). Non-responsiveness assessed in terms of RR, YG and AE also significantly varied with clay activity and P-sorption capacity of soils (Table 3). Across soil types, the probability of YG < 0.5 t ha−1 was significantly higher on farmers’ fields (ϕ = 0.20) than on research stations (ϕ = 0.15). The probability of exceeding 3 t ha−1 was also lower on farmers’ fields (ϕ = 0.62) than on research stations (ϕ = 0.66). The probability of exceeding 3 t ha−1 was significantly lower on arid and semi-arid sites (ϕ = 0.59) than on subhumid (ϕ = 0.65) and humid (ϕ = 0.67) sites.
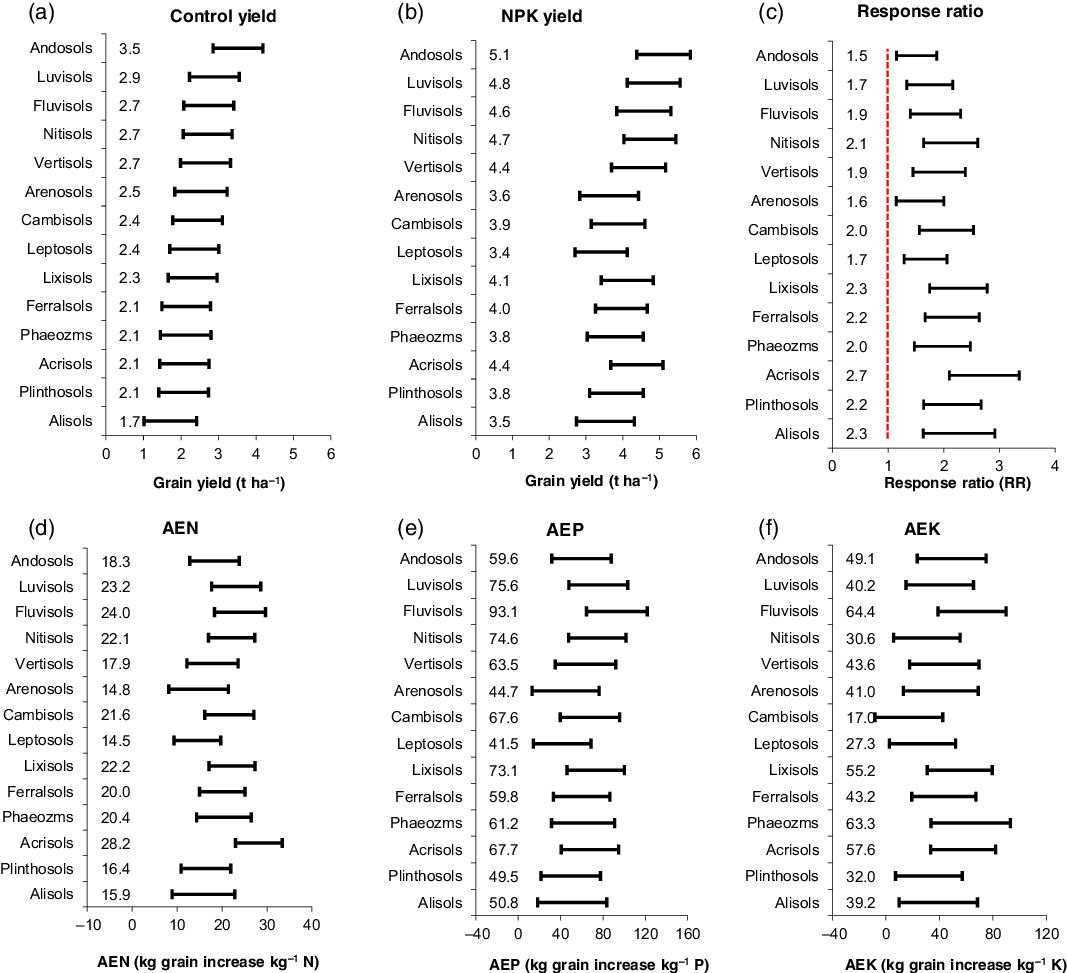
Figure 2. Plots of the 95% confidence limits (CLs) (horizontal bars) of mean grain yields, response ratios (RR), agronomic use efficiency of nitrogen (AEN), phosphorus (AEP) and potassium (AEK). Means are given on the left-hand side of each CL. Means on two or more soil types are deemed significantly different from each other if the 95% CLs do not overlap. The red broken line in (c) represents the point where control yield is equal to yield with fertilizer (i.e., RR = 1).
Table 2. Predicted probabilities (ϕ) of non-response to NPK fertilizers expressed in terms of response ratios (RR ≤ 1), yield gain (YG ≤ 0.5 t ha−1), agronomic use efficiency of N (AEN ≤ 0), P (AEP ≤ 0) and K (AEK ≤ 0), AEN ≤ 10), AEP ≤ 30, AEK ≤ 20 and treatment yields exceeding 3 t ha−1 with NPK fertilizer (yield>3) on different soil types

AEN ≤ 10, AEP ≤ 30 and AEK ≤ 20 represent the probability of poor response, defined as values of AEN, AEP and AEK below their first quartile.
Table 3. Predicted probabilities (ϕ) of non-response to NPK fertilizers expressed in terms of response ratios (RR ≤ 1), agronomic use efficiency of N (AEN ≤ 0) and P (AEP ≤ 0), K (AEK ≤ 0) and yield gain (YG ≤ 0.5 t ha−1) with the mineralogy of parent materials, resilience to erosion and degradation, clay activity and P-sorption capacity of African soils

* P fixation categories ‘high’ and ‘very high’ were merged into a single category ‘high’ to reduce fragmentation of data.
Response ratios (RR)
The overall probability of no response (RR ≤ 1) was 0.10. The probability of no response was two times more on farmers’ fields (ϕ = 0.12) than on research stations (ϕ = 0.05) (Table 2). In the multiple regression analysis, SOC was not a significant predictor of RR (Supplementary Table S4). A plot of RR on SOC also did not reveal any significant trend (Figure 3a). In the linear mixed effects model, RR significantly (p < 0.001) varied with agroecological zone, soil type, trial location, N rate and P rate (Supplementary Table S5). The ICC indicated that the random effects (i.e., country) accounted for 21% of the total variation in RR. The RR estimated using the mixed effects model was highest (2.7) on Acrisols and lowest (1.5) on Andosols (Figure 2c). The highest probability of no response was recorded on Plinthosols followed by Alisols, Lixisols and Leptosols, whereas Fluvisols, Luvisols and Nitisols had very low probabilities of no response (Table 2). The probability of no response was significantly higher on siliceous than mafic parent material, and soils with low resilience than those with high resilience to erosion (Table 3). Except on Andosols, Fluvisols and Leptosols, K omission reduced the risk of no response (Supplementary Table S7). The probability of no responses was significantly higher on soils with low-activity clays than on soils with high-activity clays, on soils with high P fixation capacity than on medium or low P fixation capacity (Table 3).

Figure 3. Trends in the variations of RR, AEN and AEP with soil organic carbon, pH and clay contents. The red lines represent the level below which maize crops do not efficiently use N or P.
Agronomic efficiency (AE) of N, P and K
Trials on farmers’ fields had significantly higher probability (ϕ = 0.10) of no response to N, P and K than on research stations (ϕ = 0.05). Across the entire data set, the probabilities of poor response (AE ≤ 1st quartile) to N, P and K were 0.34, 0.34 and 0.55, respectively (Table 2). In the stepwise multiple regression, SOC was a significant predictor of AEN, but not AEP and AEK (Supplementary Table S4). A plot of AEN, AEP and AEK on SOC also did not reveal visible trends (Figure 3b–c). AEN, AEP and AEK significantly (p < 0.001) varied with soil type (Figure 2d–f), agroecological zone, trial location, N rate, P rate and K application (Supplementary Table S5). AEN and AEP were low on Leptosols, Arenosols, Alisols and Plinthosols, while their highest mean values were recorded on Acrisols (Figure 1d) followed by Fluvisols (Figure 1d). Plinthosols had the highest probability (ϕ = 0.24) of no response to applied N (i.e., AEN ≤ 0) followed by Alisols and Lixisols (Table 2). Fluvisols, Luvisols, Cambisols and Nitisols had very low risk (ϕ = 0.02–0.04) of failure to respond to N and P (Table 2). The risks of no response to N and P were also higher on soils derived from silicic than mafic parent materials, and on soils with low resilience than those with high resilience to erosion (Table 3). The risks of no response to applied N were two times higher on soils with low-activity than high-activity clay (Table 3).
Discussion
Using multiple response metrics and robust statistical tools, this study has provided novel insights into the non-responsiveness of African soils to the recommended N, P and K fertilizers. Overall, the results show that the risks of no response are greater on soils derived from siliceous than mafic parent materials, soil types with low resilience to erosion, soils with low-activity clays and high P fixation capacity. The results also show that soil type is an important determinant of response. The analyses also indicated that the response on each soil type is not a single value, but probabilities of varying likelihoods depending on explanatory variables. Since the predicted probabilities provide information on the actual risk of no response, they are easier for use by decision makers, especially agronomists and agricultural extension staff who develop fertilizer recommendations for farmers. The ranking of soil types based on mean effect sizes (Figure 1) and the predicted probabilities (Table 2) slightly differed. This emphasise that the traditional approach of categorising soils as responsive and non-responsive based on metrics of mean response alone is inadequate.
None of the criteria or metrics identified any soil type as totally non-responsive. Taken together, the different metrics were consistent in separating poorly responsive soils from intermediate and highly responsive ones. Plinthosols, Alisols and Lixisols were found to be poorly responsive, while Acrisols, Cambisols, Fluvisols, Luvisols and Nitisols were highly responsive to NPK fertilizer. On the other hand, Andosols, Arenosols, Ferralsols, Leptosols, Phaeozems and Vertisols fell in an intermediate category according to the different metrics.
The high probability of no response on Plinthosols is apparently linked to their unfavourable soil structure, poor water relations (IUSS, 2014) and their high P fixation capacity (Batjes, Reference Batjes2011). On the other hand, poor response on Alisols is associated with their inherently low pH (Table 1), Al toxicity and P fixation (Batjes, Reference Batjes2011). The relatively low response on Lixisols may be attributed to their low cation retention capacity, high P fixation and susceptibility to erosion and degradation when cultivated (Table 1). These characteristics make recurrent inputs of fertilizers a precondition for continuous cultivation of Lixisols (IUSS, 2014).
The low response on Andosols despite their inherently high SOC and nutrient contents indicates that productivity on these soils is constrained by factors other than NPK. The lower AEN and AEP could be due to their highly erodible nature and their high P fixation capacity (Batjes, Reference Batjes2011). The very low probability of exceeding 3 t ha−1 on Arenosols may be linked to their sandy texture, low resilience to erosion and very poor water and nutrients-holding capacity. This can severely limit crop performance in the arid and semi-arid regions of Africa where they cover vast expanses of land estimated at over 650 million ha. This calls for adoption of soil and water management practices specifically tailored to Arenosols. The problem with Leptosols is their shallow rooting depth, coarse texture and their susceptibility to erosion (IUSS, 2014). They need to be carefully managed through soil and water conservation practices including terracing and agroforestry practices if crops are to be grown sustainably. The low probability of exceeding 3 t ha−1 on Ferralsols could be associated with their inherently low pH and high P fixation capacity (Batjes, Reference Batjes2011).
Although Acrisols are inherently acidic, they achieved the highest RR and AEN. Nevertheless, their low resilience to erosion and rapid degradation (Stocking, Reference Stocking2003) means that productivity can only be maintained with appropriate soil and water management practices combined with NPK fertilizer. Cambisols, Fluvisols, Nitisols and Luvisols generally carried very low risks of no response and high probabilities of yields exceeding 3 t ha−1. This is partly due to their stable structure, good internal drainage and high resilience to erosion. These soils also have high-activity clay minerals, high base status and low P fixation (Table 1). Soils with high base saturation can be more responsive because they have little or no acid cations such as Al, have relatively high pH and therefore more buffered against acid cations. The results also show that target yields of 3 t ha−1 can be exceeded with high probability on Andosols, Nitisols and Vertisols, which are derived from mafic parent materials. According to Gray et al. (Reference Gray, Humphreys and Deckers2009), pH increased with increasing mafic characters. Soils derived from mafic materials also tend to have high clay activity compared to those derived from silicic materials.
In some countries, K is missing in national fertilizer recommendations because it is believed to be non-limiting (Jama et al., Reference Jama, Kimani, Kiwia, Rebbie and Sileshi2017; Sileshi, Reference Sileshi2021). Our analyses show that K application increases yields substantially on Acrisols, Arenosols and Fluvisols, while on Cambisols, Leptosols and Phaeozems K application tended to depress yields relative to omission (Supplementary Table S7). Yield depression is likely to occur due to various factors, but imbalances and antagonism between K, magnesium (Mg) and calcium (Ca) seem more plausible. Roobroeck et al. (Reference Roobroeck, Palm, Nziguheba, Weil and Vanlauwe2021) similarly linked differences in occurrences of non-responsiveness to imbalances in exchangeable Ca, Mg and K in soils. Antagonistic interactions occur between Ca, Mg and K such that high levels of one or more of these nutrients can result in decreased uptake of another, despite sufficient soil levels (Laekemariam et al. Reference Laekemariam, Kibret and Shiferaw2018; Rhodes et al., Reference Rhodes, Miles and Hughes2018; Rietra et al., Reference Rietra, Heinen, Dimkpa and Bindraban2017). Therefore, we recommend further studies on the interactions between K, Ca and Mg in the different soils for better targeting of K inputs.
The unique characteristic and limitations of each soil type revealed in this analysis emphasise the point that management recommendations need to be more tailored and nutrient inputs need to be sufficiently soil-specific. Past research (e.g., Ichami et al., Reference Ichami, Shepherd, Sila, Stoorvogel and Hoffland2019; Kihara et al., Reference Kihara, Nziguheba, Zingore, Coulibaly, Esilaba, Kabambe, Njoroge, Palm and Huising2016; Roobroeck et al., Reference Roobroeck, Palm, Nziguheba, Weil and Vanlauwe2021; Shehu et al., Reference Shehu, Merckx, Jibrin, Kamara and Rurinda2018) has generally focused on relating crop response to dynamic soil properties such as pH, SOM and nutrient levels. According to our analyses, the contributions of pH, SOC and clay content to the variations in RR, AEN and AEP did not show clear trends (Figure 3a–i; Supplementary Table S4). Similarly, across 18 on-farm trials covering different soil types in western Kenya, Njoroge et al. (Reference Njoroge, Otinga, Okalebo, Pepela and Merckx2018) found no significant difference in SOC, pH and clay content between sites with good response to NPK fertilizer and those with poor response. In analyses of maize response across Ghana, Bua et al. (Reference Bua, El Mejahed, MacCarthy, Adogoba, Kissiedu, Atakora, Fosu and Bindraban2020) also found variable influence of SOC and pH on grain yield. In studies by Kihara et al. (Reference Kihara, Nziguheba, Zingore, Coulibaly, Esilaba, Kabambe, Njoroge, Palm and Huising2016) and Shehu et al. (Reference Shehu, Merckx, Jibrin, Kamara and Rurinda2018), nonresponsive fields also had relatively higher SOC than the responsive fields. From Table 1 and Supplementary Figure S1, it is evident that pH, SOM and clay content are intrinsically linked to soil type, but their levels can also be modified by farmer management. Therefore, we argue that fertilizer recommendations should be guided by a good knowledge of the soil type, management history, and periodic soil tests to establish limiting nutrients. The fact that the risks of no response are up to two times more on farmers’ fields than on research stations (Table 2) highlights the role of management in crop response. These findings have implications for the design and location of future agronomic trials. Until recently, agronomic trials have been mostly located on research stations, which may not adequately represent the diversity of soil types on farmers’ fields (Sileshi, Reference Sileshi2021). We also recommend careful location of future trials on farmers’ fields, taking into account the dominant reference soil groups.
Our findings also have implications for policies and investments relating to input subsidies. In development circles, much emphasis has been placed on stimulating NPK fertilizer use by farmers without critically examining where their use can be risky. The concept of smart subsidies has also gained popularity in SSA, and such subsidies usually target fertilizer inputs to resource-poor households. Here we argue that targeting fertilizer subsidies by taking into account the inherent limitations of soils together with farmers’ resource endowment could lead to more efficient use of the investment. On soils that are prone to acidification such as Alisols, Acrisols, Ferralsols and Nitisols, subsidizing NPK fertilizer together with lime and integrated acid soil management practices is likely to result in greater pay-offs than subsidizing NPK fertilizer alone. The promotion of acid-tolerant germplasm is also highly encouraged (Agegnehu et al., Reference Agegnehu, Amede, Erkossa, Yirga, Henry, Tyler, Nosworthy, Beyene and Sileshi2021). Soil types dominated by clay minerals such as kaolinite, halloysite, montmorillonite and illite are likely to fix P necessitating application of higher P rates (Batjes, Reference Batjes2011). On P fixing soils (e.g., Acrisols, Andosols, Ferralsols and Nitisols), greater emphasis should also be placed on the choice of P sources and appropriate combinations of P fertilizer with organic inputs such as farmyard manure (Sileshi et al., Reference Sileshi, Jama, Vanlauwe, Negassa and Harawa2019) and agroforestry practices (Sileshi et al., Reference Sileshi, Akinnifesi, Debusho, Beedy, Ajayi and Mong’omba2010). On inherently fertile soils such as Andosols, investments should focus on erosion control measures and maintenance of fertility by targeted application of N, P and K combined with the other yield-limiting nutrients.
Conclusion
This analysis has attempted to quantify the probability of non-responsiveness and its underlying causes on African soils. The main conclusions emerging from this analysis are (1) the soil type, its mineralogy and resilience to erosion are important determinants of responsiveness to NPK fertilizers; (2) the target yield of 3 t ha−1 can be attained with greater probability (>0.80) on Andosols, Vertisols and Nitisol, but with very low probability (<0.30) on Alisols and Arenosols and (3) the risks of no response can be up to two times more on farmers’ fields than on research stations. The diversity of soils and their mineralogy emphasise that land management needs to be tailored to address the unique limitations of each soil type and fertilizer inputs need to be sufficiently site and soil specific. It does also have important policy implications with respect to NPK fertilizer subsidies in many SSA countries that are generally poor in targeting inputs to soils where the investment is likely to be more efficiently used.
Supplementary Material
For supplementary material for this article, please visit https://doi.org/10.1017/S0014479721000247
Acknowledgements
We are grateful to the anonymous reviewers for their constructive comments on the draft manuscript.
Conflict of Interest
The authors declare no conflict of interest.
Funding support
This work was supported, in whole or in part, by the Bill & Melinda Gates Foundation [INV-005460]. Under the grant conditions of the Foundation, a Creative Commons Attribution 4.0 Generic License has already been assigned to the Author Accepted Manuscript version that might arise from this submission.


 Open access