


Introduction
The creamatocrit is a simple technique for estimating the lipid and energy content of human milk, based on the separation of cream and aqueous fractions of milk in a capillary tube using a microhematocrit centrifuge—the creamatocrit value is determined as the percentage of the cream column length out of the total milk column (Lucas et al., Reference Lucas, Gibbs, Lyster and Baum1978). The technique has been widely adopted for clinical practices and milk research, owing to its simplicity and minimal needs for equipment, supplies, or chemicals. It is an economical and safe alternative to other techniques such as the Gerber standard method (Collares et al., Reference Collares, Goncalves and Ferreira1997).
Numerous studies have evaluated the validity and reliability of the creamatocrit technique. These include the effect of storage temperatures (Silprasert et al., Reference Silprasert, Dejsarai, Keawvichit and Amatayakul1987), freezing and thawing (de Groot et al., Reference de Groot, Kramer, Bulux, Solomons, Green and West1998; Silprasert et al., Reference Silprasert, Dejsarai, Keawvichit and Amatayakul1987; Vazquez-Roman et al., Reference Vazquez-Roman, Alonso-Diaz, Garcia-Lara, Escuder-Vieco and Pallas-Alonso2014; Wang et al., Reference Wang, Chu, Mellen and Shenai1999), varying thawing protocols (Thatrimontrichai et al., Reference Thatrimontrichai, Janjindamai and Puwanant2012), temperatures during centrifugation, and the inter- and intra-rater errors (Tie et al., Reference Tie, Kent, Lai, Rea, Hepworth, Murray and Geddes2021).
These studies clarify the validity of the creamatocrit technique applied to frozen and thawed milk specimens for estimating milk lipid content. The creamatocrit values tend to be lower in frozen and thawed specimens than the values from fresh specimens (de Groot et al., Reference de Groot, Kramer, Bulux, Solomons, Green and West1998; Silprasert et al., Reference Silprasert, Dejsarai, Keawvichit and Amatayakul1987; Vazquez-Roman et al., Reference Vazquez-Roman, Alonso-Diaz, Garcia-Lara, Escuder-Vieco and Pallas-Alonso2014; Wang et al., Reference Wang, Chu, Mellen and Shenai1999). Mathematical formulae can be applied to account for this short-term freeze–thaw effect for estimating the lipid and energy content through the creamatocrit of previously frozen milk (Wang et al., Reference Wang, Chu, Mellen and Shenai1999). This is particularly important for research in remote sites or population-level research in which immediate laboratory analysis of the specimens is unfeasible.
We evaluated the effect of longer-term storage on the creamatocrit values through a comparison of the creamatocrit values from human milk specimens undergone 10 years in cryogenic storage to the original creamatocrit values from the same specimens prior to long-term storage (but have undergone one short-term freeze–thaw cycle). Human milk specimens in cryogenic archival storage are abundant in universities, milk banks, and other clinical and research facilities. These specimens hold potential for the retrospective determination of their nutritional content for research on human milk variation across time and place. It is currently unclear whether the magnitude of the long-term cryogenic storage effect would be equivalent to that of the shorter-term freeze–thaw effect. Characterizing the agreement or difference between the creamatocrit before and after long-term archival storage would help fill this knowledge gap and facilitate research opportunities using archival milk specimens.
Methods
The creamatocrit
Frozen and thawed milk specimens (n = 18) originally collected among volunteers in rural Kenya were subjected to the creamatocrit in 2008 and again in 2018, separated by storage at cryogenic temperatures (<70°C). The specimen collection and the creamatocrit measurement in 2008 were approved and overseen by the institutional review boards of the University of Washington and the Kenya Medical Research Institute. The procedure for specimen collection can be found in Fujita et al. (Reference Fujita, Shell-Duncan, Ndemwa, Brindle, Lo, Kombe and O’Connor2011). The creamatocrit re-testing of de-identified milk specimens in 2018 required no further approvals.
The published methodology for the creamatocrit technique (Lucas et al., Reference Lucas, Gibbs, Lyster and Baum1978) explained more in detail by Wang et al. (Reference Wang, Chu, Mellen and Shenai1999) was used. In short, the homogenized milk was drawn into the capillary tube, and the dry end of the tube was sealed with sealing clay. The process was repeated two more times to produce three sealed tubes per specimen. The tubes were centrifuged to separate the cream/lipid from the aqueous fraction. The length of the cream column and the length of the total milk column of the centrifuged tubes were measured to the nearest 0.5 mm. The creamatocrit value was reported as the average percentage of the cream column length out of the total milk column length.
The 2008 (pre-storage) and 2018 (post-storage) creamatocrit analyses were performed, using the same protocol and equivalent equipment by the same trained observer (MF) albeit in two laboratories. The former analysis was performed at the Biodemography Laboratory of the University of Washington, and the latter at the Biomarker Laboratory for Anthropological Research of Michigan State University where specimens have been housed since 2011 under the Material Transfer Agreement between the two universities.
Data analysis
Descriptive statistics were applied to the creamatocrit values and their natural logarithmic values. The correlation between these pre- and post-storage logarithmic values was tested. The scatterplot was constructed to visualize the relationship between pre- and post-storage logarithmic values.
A Bland–Altman plot was created to allow visual evaluation of the agreement between the pre- and post-storage creamatocrit values and identify any systematic bias. The distribution of the percentage difference between post-storage and pre-storage creamatocrit (calculated as post-storage minus pre-storage multiplied by 100, then divided by their mean; equivalently 100 × ln(post-storage) − 100 × ln(pre-storage); Cole & Altman, Reference Cole and Altman2017) was plotted against their means. This plot displayed three reference lines (with 95% CIs [confidence intervals]): the observed mean percentage difference, the upper limit of agreement ( $ \overline{x} $
+ 1.96 SD), and the lower limit of agreement (
$ \overline{x} $
+ 1.96 SD), and the lower limit of agreement ( $ \overline{x} $
− 1.96 SD; Bland & Altman, Reference Bland and Altman1999; Giavarina, Reference Giavarina2015) along with the theoretical line for no difference (% difference = 0). The calculation of 95% CIs was based on an exact method using the noncentral t-distribution, proposed by Carkeet (Reference Carkeet2015), Chatfield (Reference Chatfield2022), and Shieh (Reference Shieh2018). If post-storage values perfectly reproduce pre-storage values, then the percentage difference would be zero. The difference between the mean percentage difference and this theoretical zero was interpreted as the overall bias between pre- and post-storage values. The upper and lower limits of agreement were interpreted as the largest extent of biases.
$ \overline{x} $
− 1.96 SD; Bland & Altman, Reference Bland and Altman1999; Giavarina, Reference Giavarina2015) along with the theoretical line for no difference (% difference = 0). The calculation of 95% CIs was based on an exact method using the noncentral t-distribution, proposed by Carkeet (Reference Carkeet2015), Chatfield (Reference Chatfield2022), and Shieh (Reference Shieh2018). If post-storage values perfectly reproduce pre-storage values, then the percentage difference would be zero. The difference between the mean percentage difference and this theoretical zero was interpreted as the overall bias between pre- and post-storage values. The upper and lower limits of agreement were interpreted as the largest extent of biases.
The directional patterning of data points within the plane of the Bland–Altman plot was interpreted as the presence of bias that is nonconstant. The Pitman’s test of equality of variance evaluated the correlation between the paired logarithmic differences and the creamatocrit means; a significant correlation was interpreted as evidence for the presence of some linear patterning of the bias, owing to differing variances in the two sets of data (Bartlett & Frost, Reference Bartlett and Frost2008).
A second Bland–Altman plot was constructed, replacing the three reference lines with the regression-based ones for the bias of percentage difference and limits of agreement (Bland & Altman, Reference Bland and Altman1999; Chatfield, Reference Chatfield2022; Giavarina, Reference Giavarina2015; Ludbrook, Reference Ludbrook2010) for an additional characterization of the patterning of the data. Here, the bias equation was based on the regression of percentage difference in the natural logarithmic mean of post- and pre-storage values. The equations for the limits of agreement were respectively the bias equation ±1.96 SD, where SD was obtained by a second regression of the residuals (the absolute values taken and multiplied by $ \sqrt{\pi /2}\Big) $
from the first regression (Bland & Altman, Reference Bland and Altman1999; Chatfield, Reference Chatfield2022).
$ \sqrt{\pi /2}\Big) $
from the first regression (Bland & Altman, Reference Bland and Altman1999; Chatfield, Reference Chatfield2022).
We used Stata version 15 with the “BAPLOT” and “blandaltman” packages (Chatfield, Reference Chatfield2022) for statistical computation.
Results/conclusions
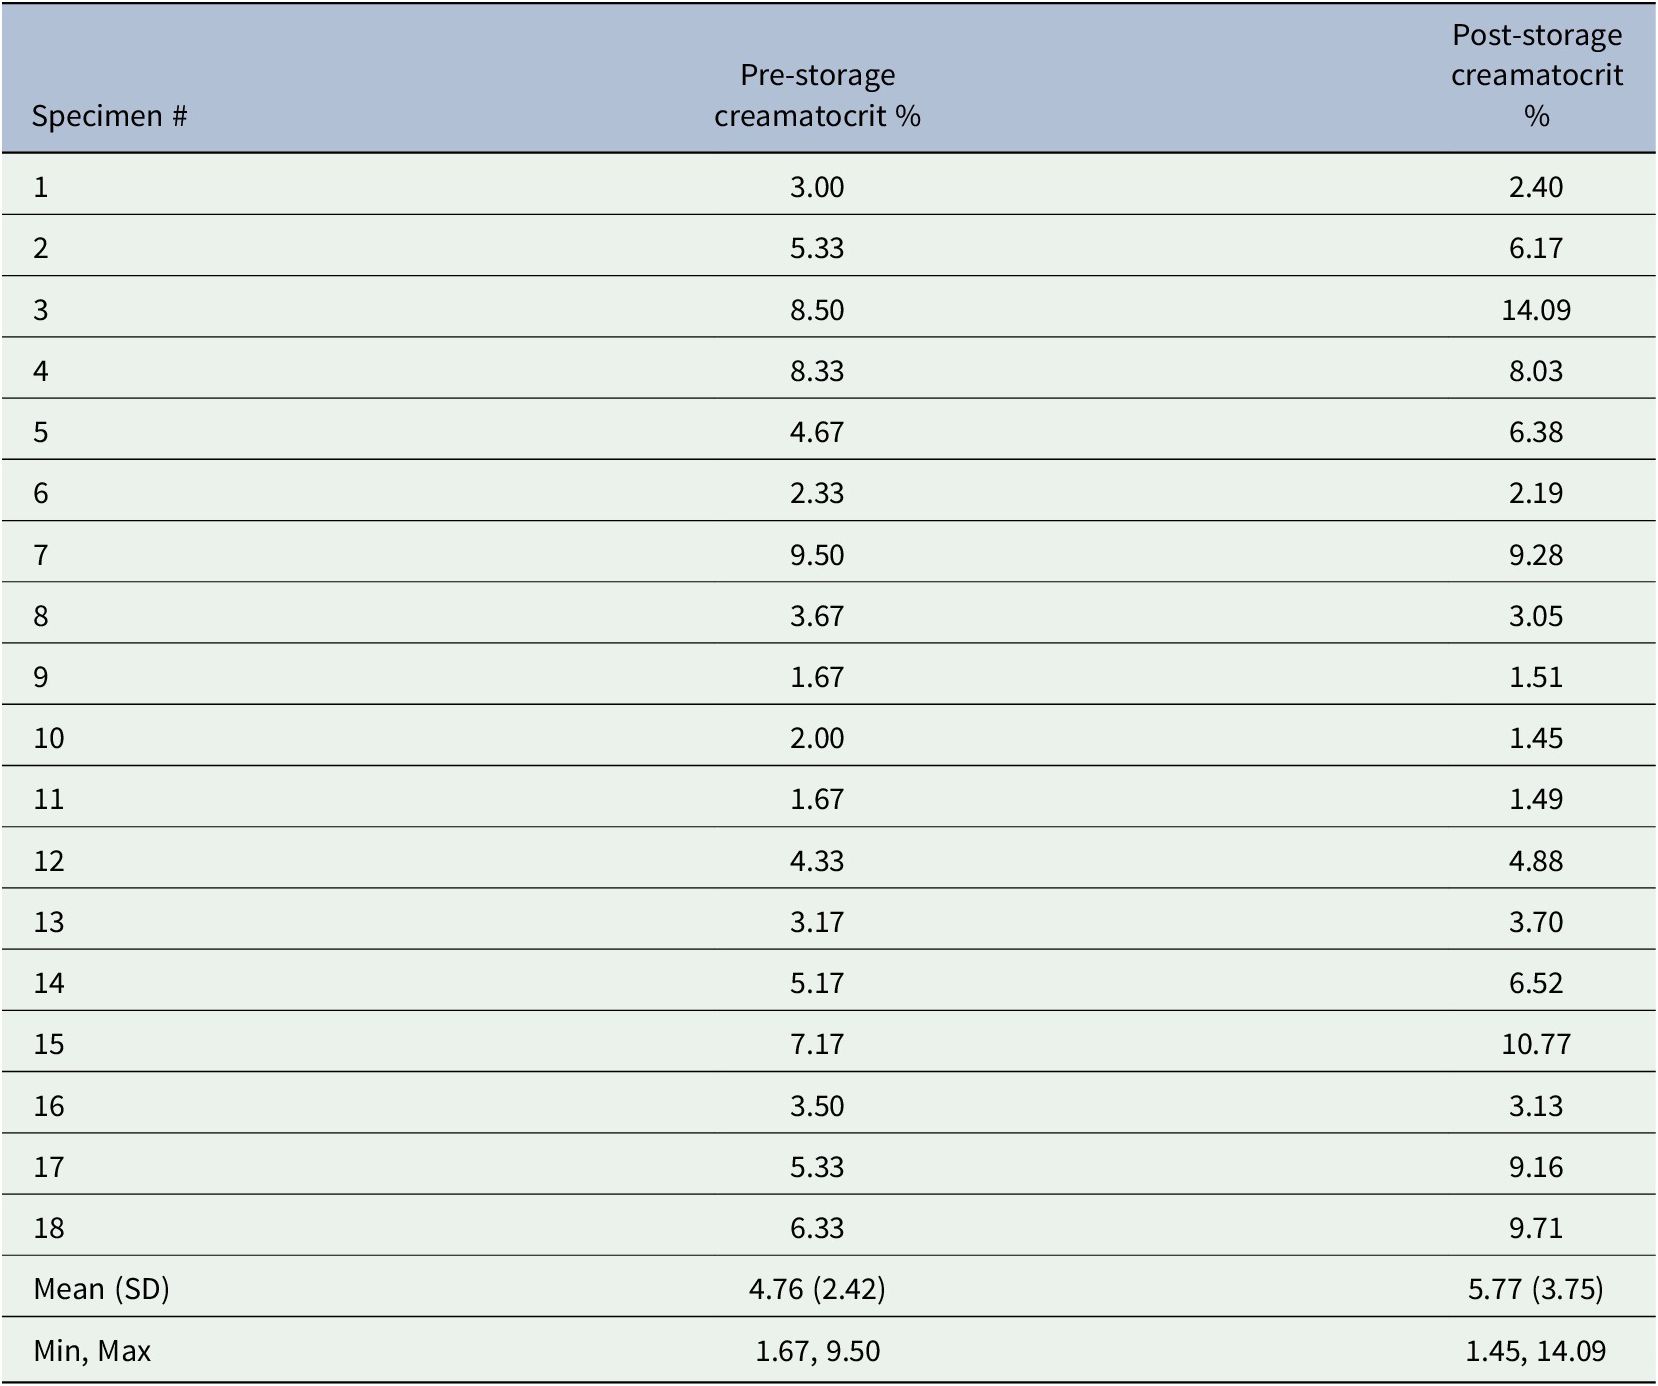
The pre- and post-storage creamatocrit percentages and their summary statistics are found in Table 1. These values were comparable to previously reported creamatocrit values, although the right-skewed distribution might have underrepresented the upper end of the physiological range. The mean (SD) total fat content calculated from the equation, $ 0.54\times creamatocrit+0.39 $
(Wang et al., Reference Wang, Chu, Mellen and Shenai1999), was 3.0 (1.3) g/dl, ranging from 1.3 to 5.5 g/dl, slightly lower than the aggregated range 2.5–6.0 g/dl reported from several human populations (Miller et al., Reference Miller, Aiello, Fujita, Hinde, Milligan and Quinn2013).
$ 0.54\times creamatocrit+0.39 $
(Wang et al., Reference Wang, Chu, Mellen and Shenai1999), was 3.0 (1.3) g/dl, ranging from 1.3 to 5.5 g/dl, slightly lower than the aggregated range 2.5–6.0 g/dl reported from several human populations (Miller et al., Reference Miller, Aiello, Fujita, Hinde, Milligan and Quinn2013).
Table 1. Creamatocrit data and summary statistics
Using the logarithmic values, the pre-storage and post-storage data were highly correlated (r = 0.960, p < .0001); the strong linear positive relationship is depicted in the scatterplot (Figure 1).
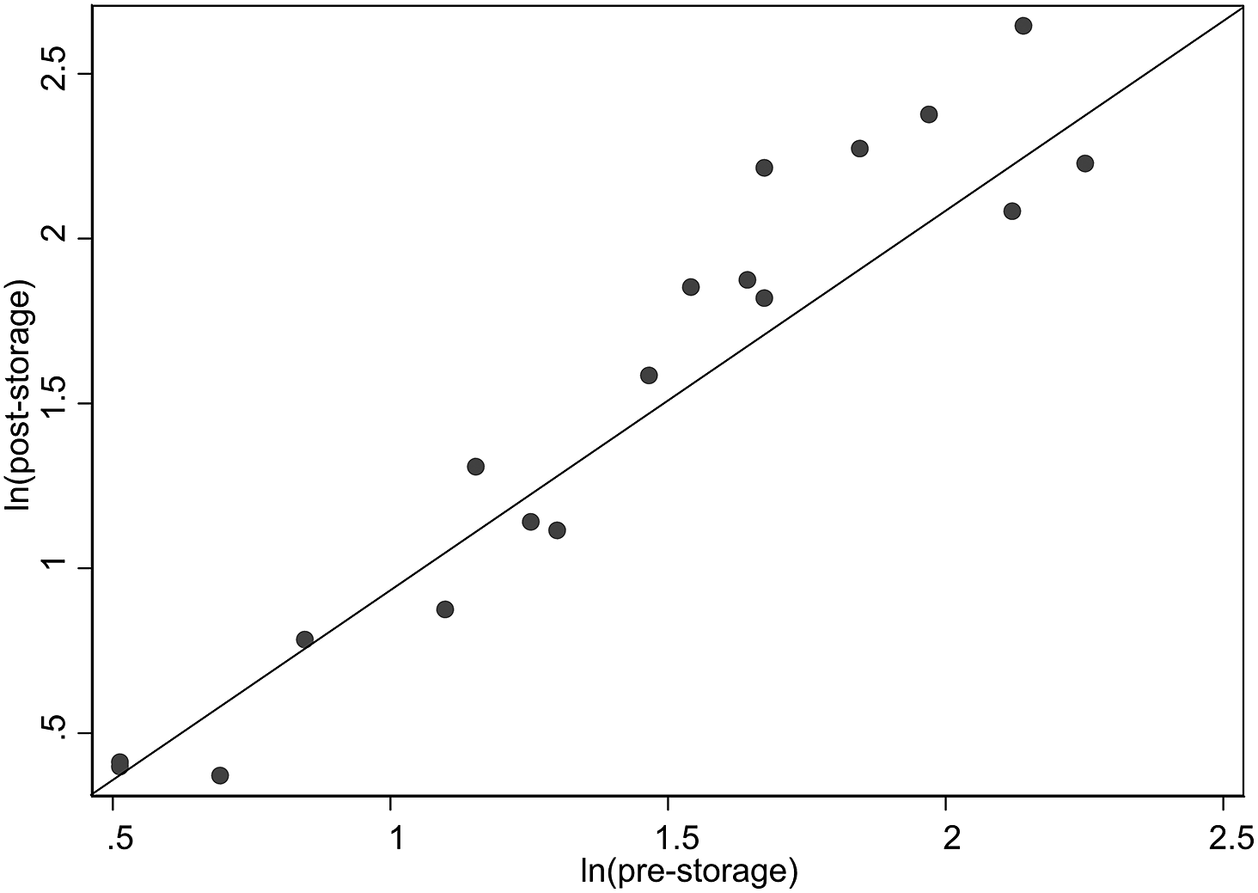
Figure 1. Scatterplot of post-storage versus pre-storage creamatocrit using natural logrithm-transformed values. The diagonal reference line represents the perfect correlation.
Figure 2 displays the Bland–Altman analysis for the percentage differences between post- and pre-storage creamatocrit percentages against their means, along with the reference lines. The mean percentage difference (dashed line) was 9.1% (95% CI −3.9, 22.0). The CI of the mean percentage difference includes the value zero (that is no difference), meaning that the overall bias was minor.
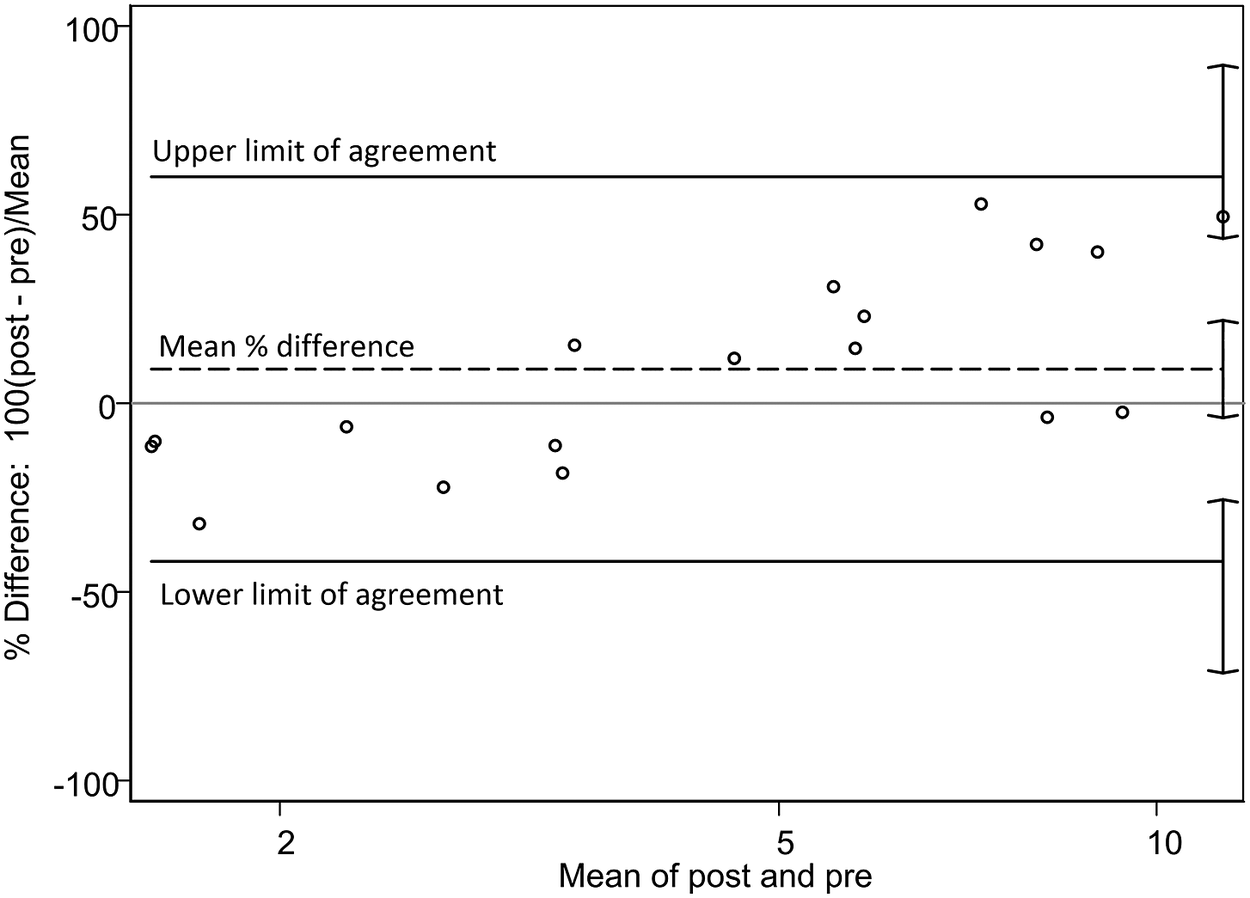
Figure 2. Bland–Altman plot for percent difference. The percentage difference between post- and pre-storage creamatocrit values versus the mean of post- and pre-storage creamatocrit values. Mean % difference, 9.1% (95% CI −3.9, 22.0); upper limit 60% (95% CI 43.7, 89.7); lower limit −42% (95% CI −71.5, −25.5).
However, the upper limit of agreement (60%; 95% CI 43.7, 89.7) and the lower limit of agreement (−42%; 95% CI −71.5, −25.5) were wide apart from the mean, revealing that the extent of under- and overestimations were large. Furthermore, there was an upward slope in the percentage difference across the mean, suggesting that the bias was not constant. Namely, the bias changed from negative to positive as the mean values increased; the post-storage values underestimated (that is fell short of) the pre-storage values by 42% in the lower range of creamatocrit, whereas they overestimated (that is exceeded) by 60% in the higher range. This positive association was significant when evaluated by the Pitman’s test (r = 0.738, p < .001) between logarithmic creamatocrit differences versus creamatocrit means. This suggests that the variance of the pre-storage values differed from that of the post-storage values, contributing to nonconstant bias (Bartlett & Frost, Reference Bartlett and Frost2008). In the second Bland–Altman plot, the regression-based bias and limits of agreement had prominent positive slopes, corroborating the finding of the positive association (Figure 3).
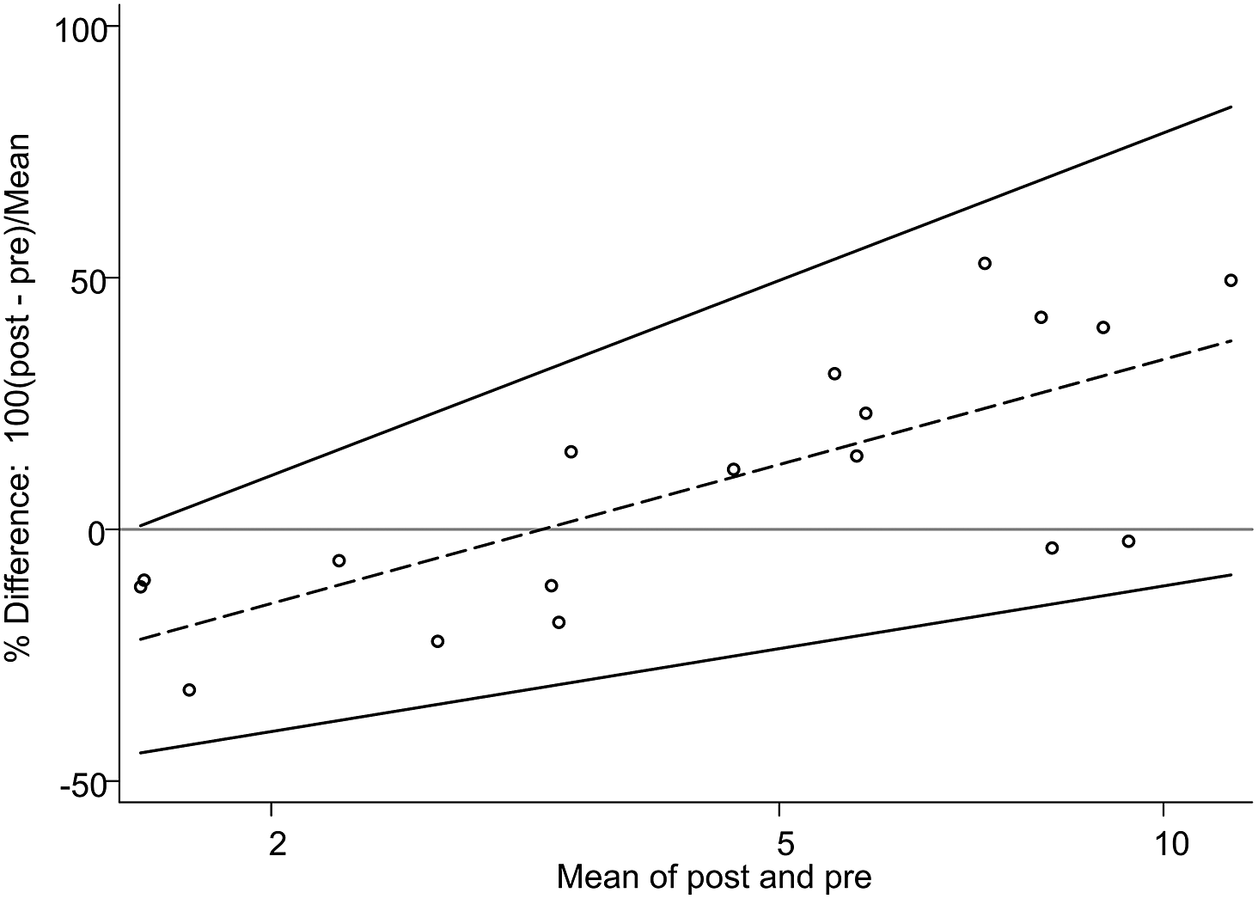
Figure 3. Bland–Altman plot with the regression-based percentage difference and limits of agreement. The same plot as Figure 2 displaying the regression-based bias of percentage difference (y = −35.6 + 30.1 × ln(M); dashed line) and upper and lower limits of agreement (y = −18.6 + 42.3 × ln(M) and y = −52.6 + 18.0 × ln(M), respectively), where M stands for the mean of post- and pre-storage creamatocrit values.
The widely separated limits of agreement and corresponding large extent of over- and underestimations can be attributed to the small sample size (Giavarina, Reference Giavarina2015). Nonetheless, the strong positive association between differences and means is apparent and suggests the presence of a systematic, concentration-dependent bias.
This study found that the creamatocrit of human milk undergone 10 years of cryogenic storage can provide values in high correlation with creamatocrit values obtained prior to storage; however, our results suggest a systematic bias that may vary with milk lipid concentration. This bias may result in a subtle but systematic underestimation in the lower creamatocrit range and overestimation in the higher creamatocrit range. Further research with a larger sample size is needed to scrutinize the extent of this bias and determine if a mathematical formula could correct it.
Acknowledgment
Emma Bignall and Nerli Paredes Ruvalcaba assisted with creamatocrit analysis at the Biomarker Laboratory for Anthropological Research.
Data availability statement
The data used in this study are provided in Table 1.
Funding statement
Specimens and data used for this work were supported by the National Science Foundation (M.F.; grant numbers BCS 0622358 and BCS 1638167) and the Wenner-Gren Foundation (M.F.; grant numbers 7460 and 9278). The Eunice Kennedy Shriver National Institute of Child Health and Human Development research infrastructure grant (P2C HD042828) supported E.B. during a portion of the research.
Conflicts of interest
The authors declare none.
Authorship contributions
M.F. conceived and designed the study. E.B. and M.F. procured materials. M.F. performed laboratory and statistical analyses. M.F. drafted the article. E.B. and M.F. edited the article for intellectual content.


 Open access
Comments
Comments to the Author: In light of the data collection among volunteers in rural Kenya in 2008 and again in 2018, this agreement study is limited to 18 specimen (minimum 30-50 subjects would be clearly preferable in Bland-Altman analysis).
Abstract & Results: please indicate both p-values as ‘p<0.0001’ instead of ‘0.000’. These are small, but positive probabilities, not 0.
Methods, Data Analysis:
(1) please indicate how 95% CIs for the Bland-Altman Limits of Agreement were derived. From Fig. 2 it is apparent that the confidence limits are not symmetric around the point estimates (those originally proposed by Bland & Altman that is the approximate Wald-type ones). Later, exact non-symmetric confidence limits for the Limits of Agreement have been proposed by Carkeet (doi: 10.1097/OPX.0000000000000513). Were these employed?
(2) I agree with the indicated directional pattern. As there are only n=18 observations, I propose to stick to your analyses shown, but supplement the finding of the upwards trend in the data by another figure that shows Bland-Altman Limits of Agreement based on a regression approach (see Fig. 8 in doi:10.1177/096228029900800204, Fig. 2 in doi:10.1111/j.1440-1681.2009.05288.x, Fig. 3 in doi:10.11613/BM.2015.015).
(3) Other STATA package is concord.
Fig. 1: 1970’s way of displaying (dis)agreement; Bland & Altman argued that disagreement may be hard to detect visually here (see their seminal paper in Lancet 1986;1(8476):307-10, Fig. 1 vs. Fig. 2). Could also apply here. However, as supplementary plot, you may as well stick to it, but please enhance the scatter plot by adding a 45 degrees line for interpretability, thanks.