


Introduction
The Lithium-Ion battery developed four decades back has penetrated every electric component of daily human usage. Among the technological advancements, the automotive industry has changed its phase to adopt the electric propulsion system ending the traditional internal combustion engines to reduce emissions (Akhtar & Patil, Reference Akhtar and Patil2022). The performance of the combustion engines was measured using the vector engine operating point (EOP), which was traditionally accepted as an industry standard. However, the existing literature did not propose a similar concept for electric vehicles.
Kolachalama and Malik (Reference Kolachalama and Malik2021, Reference Kolachalama and Malik2022) performed multiple experiments using Cadillac test vehicle segments and analyzed the vector EOP. Hence, in this article, a similar experiment was conducted using the electric test vehicle 2023 Cadillac Lyriq to investigate the properties of the performance parameters. The vector electric vehicle operating point (EVOP) was proposed, representing the performance, using the parameters relevant to the elements (Battery, Inverter, and Motor) (Zhou et al., Reference Zhou, Zhao, Zhang, Gao and Pei2015). It is engrossing for every engineer to delve into the properties of EVOP vector in real time, and a definite behavior was not investigated in the existing literature. The details of the test procedure and process adopted was presented in the following sections.
Objective
The electric vehicle performance could be analyzed more precisely by identifying the effecting parameters in real time. Despite the advancement of computational techniques, virtual simulations representing normal driving conditions, and controlled test procedures, adapting the actual scenario of a vehicle traversing any terrain in real time is challenging (Donkers et al., Reference Donkers, Yang and Viktorović2020). Hence, to investigate the properties of EVOP, it is required to drive the test vehicle (2023 Cadillac Lyriq) on multiple terrains, and real-time vehicle data must be collected to analyze the performance parameters. This article summarizes the detailed experimental procedure based on the automotive industry standards and a new problem to explore for researchers.
Methodology
The vector EOP was defined with three elements (instantaneous engine torque [IET], instantaneous engine speed, and instantaneous fuel consumption rate [IFCR]), which is an established automotive standard (Kolachalama & Lakshmanan, Reference Kolachalama and Lakshmanan2021). In this article, analogous to EOP, the EVOP was proposed with the elements (battery operating point [BOP], inverter operating point [IOP], and motor operating point [MOP]). Table 1 lists the parameters defining the EVOP, and only the direct current discharged by the battery was considered in the following analysis assuming no losses, that is, IBAC $ \approx $
IINC
$ \approx $
IINC $ \approx $
IMOC. In real time, the vector EVOP is affected by multiple parameters listed in Table 2, and the steps involved in data retrieval are presented in the following section.
$ \approx $
IMOC. In real time, the vector EVOP is affected by multiple parameters listed in Table 2, and the steps involved in data retrieval are presented in the following section.
Table 1. Electric vehicle operating point (BOP, IOP, and MOP)
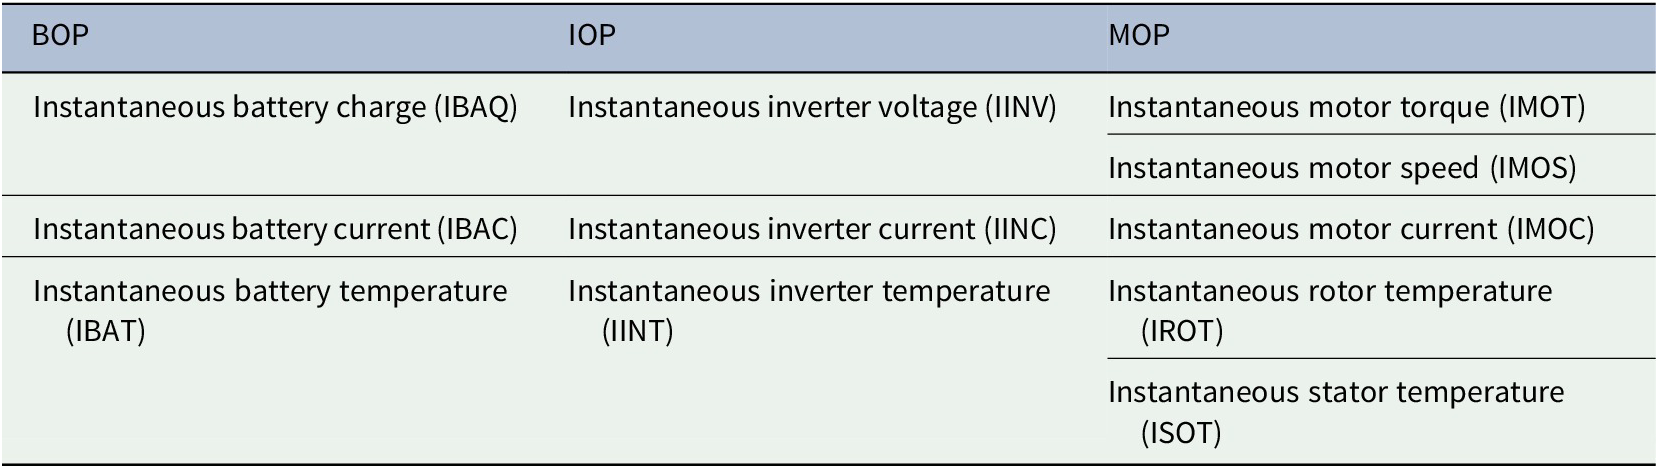
Table 2. Dynamic state of vehicle (body module, driver behavior, and environment)

Abbreviations: BOP, battery operating point; IOP, inverter operating point; MOP, motor operating point.
Data retrieval
In this experimental project, the test vehicle (2023 Cadillac Lyriq) was driven on the path (Milford–Lansing) with a speed range of [0 75] MPH, as shown in Figure 1. The vehicle is equipped with a single rear motor and 100-kWh battery pack and is expected to produce 340 horsepower and 312 miles of range (Source: General Motors Inc.).

Figure 1. Path traversed—2023 Cadillac Lyriq (January 10–11, 2022).
Source: Google Maps—Michigan, USA.
The data retrieval procedure adopted in Kolachalama and Malik (Reference Kolachalama and Malik2021) and Kolachalama and Malik (Reference Kolachalama and Malik2022) produced the best results for the computational model that predicted the driver behavior vector (DBV). Hence, a similar process was followed to retrieve the 2023 Cadillac Lyriq test vehicle data. The hardware tool neoVI–Fire 2 is attached to the controller area network (CAN) outlet under the vehicle’s steering wheel (Figure 2) and interfaced to the machine installed with Vehicle Spy software (Jaynes et al., Reference Jaynes, Dantu, Varriale and Evans2016). This setup accommodates the user to retrieve the selected vehicle data with a defined frequency of 10 Hz (Figure 3; Navet, Reference Navet1998). Two datasets were retrieved in the form of *.vsb files and using the built-in software tool Vehicle Spy, and the parameters were extracted in excel sheets (Fugiglando et al., Reference Fugiglando, Massaro, Santi, Milardo, Abida, Stahlmann, Florian and Ratti2018). Thus, the results were presented in the next section using the computational tool MATLAB.

Figure 2. Test setup-Data retrieval using Vehicle Spy.
Source: Intrepid CS and General Motors Inc.

Figure 3. Vehicle Spy software—graphical user interface.
Source: Intrepid CS and General Motors Inc.
Results
The functionality of the vector EVOP was investigated using the snippets of the data selected at multiple road segments for speeds ranging [0 75] MPH. The resulting plots of instantaneous [IOP, MOP] were shown in Figures S1–S12 in the Supplementary Material. The BOP was observed to be invariant for 10 s, and the analysis of the results was presented in the “Discussion” section.
Discussion
The test procedure was conducted using a human driver, and real-time data of the EVOP vector were retrieved using the integrated CAN architecture. The data were investigated, and the vectors [MOP, IOP] were plotted on the two-dimensional plane in the time domain. The graphs were developed for 1,000 time steps (1 time step = 100 ms), and the following details were interpreted.
A 10-s random snippet of the data was selected, and it was observed that the parameters [IBAQ, IBAT] of the vector BOP were invariant. Thus, an analogous correlation could be derived to combustion engine vehicles, where [IBAQ] reflects the level of the fuel tank, and [IBAT] corresponds to the engine surface temperature [EST]. In Kolachalama and Malik (Reference Kolachalama and Malik2021), EST $ \approx $
194°F was considered an optimization criterion to ameliorate HVAC functionality. Similarly, enhanced battery health could result when IBAT = [71 77]°F (Balamurugan et al., Reference Balamurugan, RamKumar, Singaraj, Vasudev, Kumar and Iruthayarajan2022).
$ \approx $
194°F was considered an optimization criterion to ameliorate HVAC functionality. Similarly, enhanced battery health could result when IBAT = [71 77]°F (Balamurugan et al., Reference Balamurugan, RamKumar, Singaraj, Vasudev, Kumar and Iruthayarajan2022).
The most exciting part of this research is the analysis of the vector [MOP] = [IMOT, IMOS, IMOC, IROT, ISOT]. In combustion engines, the values of [IET] and [IFCR] have fluctuating magnitudes due to the intricate property of the flame impingement (Kolachalama & Malik, Reference Kolachalama and Malik2022). In contrast, the curves [IMOT] and [IMOC] have smooth behavior with a direct linear relationship, except for the case Speed = 0 MPH. Similarly, the parameters [IMOS] and [Speed] are linearly related to the factor of transmission ratios of the vehicle. The IMOT < 0 reflects the case of regenerative braking, and thus IMOC < 0 represents the current directed toward the battery for recharging. The concept of regeneration is an additional advantage of electric vehicles, which is impossible in combustion engines. The [IROT, ISOT] plots depict that IROT > ISOT for all the cases and the range of IROT = [132 142]°F for Speeds > 25 MPH and EAT < 25°F. In the idling state, with Speed $ \approx $
0 MPH (end of the trip), the range of IROT was observed to be [132.5 134.5]°F, whereas ISOT has a range of [116 136]°F in all the scenarios.
$ \approx $
0 MPH (end of the trip), the range of IROT was observed to be [132.5 134.5]°F, whereas ISOT has a range of [116 136]°F in all the scenarios.
The parameter [IINT] fluctuates in the range [43 95]°F but does not have a definite relationship with Speed. The parameters [IINV] and [IINC], relevant to IOP, possess an inverse relationship, reflecting that the resistance would remain in a definite range (or constant) over time. These observations could lead to a new research pathway for engineers to investigate the vector EVOP in real time and develop performance optimization algorithms.
Conclusion
In this experiment, the concept of EVOP for battery-driven vehicles was proposed as analogous to the EOP applicable to combustion engines. In addition, the test vehicle was driven on regular terrain under normal driving conditions (human driver), and the relevant data applicable to the vector EVOP were extracted. The properties and behavior of the EVOP were well understood in real-time scenarios, and the possibility of developing empirical relationships was explored between the elements (MOP, Speed, and EAT). The results were satisfactory and could lead to the development of computational techniques for augmenting electric vehicle performance, as discussed in the “Future work” section.
Future work
The performance analysis of a vehicle in a virtual simulation environment or the setup in a plant model may not produce the accurate behavior of the proposed vector EVOP. Hence, in this work, the EVOP was measured using the real-time analysis of driving a single test vehicle with human intervention, with specific limitations of the testing scenarios (EAT < 25°F). In future work, multiple test cases could be developed with EAT > 60°F, HUM > 60%, and absolute slope > 10% to validate the observations. The investigation could be further deepened by extending the test cases with a multimotor electric vehicle (dual or triple) and utilizing the integrated adaptive cruise control feature, which provides controlled acceleration. Furthermore, selecting short snippets 10 s resulted in minimal (or zero) variance in some parameters, including [IBAQ]. Hence, the analysis could be extended for long periods where substantial changes are observed to the BOP (EAT > 60°F).
In addition, there are no abstract mathematical or empirical models in the existing literature correlating the environmental conditions, body module, and DBV with the EVOP. Thus, a customized deep learning model could be developed to predict EVOP, which could assist the researchers in altering the DBV in real time to enhance vehicle performance. The optimal performance criteria could be defined for the vectors [IMOT, IMOS, IMOC, IINV], and [IBAT, IROT, ISOT], considering the dynamic state of the system.
The adopted procedure of collecting data is not only well known in the industry, but also a tedious procedure which is the major limitation of this experiment. The vehicle was driven by connecting the neoVI–Fire 2 tool interfaced with the data collection machine (laptop) with integrated software Vehicle Spy. The data are collected in the form of *.vsb files, which are encrypted, and it is a time-taking process to retrieve the data in a readable format. The cellular connectivity feature could be used in future work to transmit the required data to the cloud. This could potentially help the engineers selectively retrieve the data in a readable format directly from the server.
Acronyms
- BOP
-
battery operating point
- CAN
-
controller area network
- CAT
-
cabin air temperature
- DBV
-
driver behavior vector
- EAT
-
external air temperature (°F)
- EOP
-
engine operating point
- EVOP
-
electric vehicle operating point
- HUM
-
relative humidity (%)
- IOP
-
inverter operating point
- MOP
-
motor operating point
- MPH
-
miles per hour
Open peer review
To view the open peer review materials for this article, please visit http://doi.org/10.1017/exp.2022.27.
Supplementary materials
To view supplementary material for this article, please visit http://doi.org/10.1017/exp.2022.27.
Acknowledgment
The technical analysis was performed using the tools provided by General Motors Inc. (Vehicle Spy and neoVI–Fire 2) and the University of Michigan (MATLAB).
Data availability statement
The data used in this work are proprietary to General Motors Inc., and further details cannot be publicly available. However, the details of the test procedures can be disclosed on request.
Authorship contributions
S.K. developed the concept and performed the analysis. I.S. led the detailed test procedure, and H.M. was the principal investigator for this project.
Funding statement
This experimental project, “Interpretation of the Electric Vehicle Operating Point,” was performed under the research collaboration of the University of Michigan and General Motors Inc., funded by William J. Clifford (Director) of the Systems Engineering department at General Motors Inc.
Conflict of interest
The authors declare that there is no conflict of interest regarding the publication of this article.
Ethical standards
The research meets all the ethical guidelines, including adherence to the legal requirements of the study country.


 Open access
Comments
Comments to the Author: This manuscript defines the operating point of the electric vehicle system according to its dynamic state. The performance of electric vehicle systems can be analyzed more precisely by identifying affecting parameters in real-time. It is meaningful for establishing empirical models and performance improvement of electric vehicles in the future. This article is interesting and I suggest it can be considered for acceptance. However, there are some questions for the author to consider. How reliable are the collected data that need to be considered by the author? What can be improved on the electric vehicle used to collect data according to the experimental results? In addition, the acronyms in the manuscript are repeatedly explained, such as EVS, EOP and EVOP. Are the acronyms directly usable after the explanation?