


Impact Statement
Organisms responsible for biofouling increase ship drag, and thereby increase the fuel consumption and reduce the top speed. Invasive species can also travel on ship hulls, which can profoundly affect the ecosystems to which they are introduced. Hull fouling can be mitigated by the careful selection of surface treatments and maintenance protocols. A contactless device which can be used to reduce biofouling while reducing damage to surface coatings is the Bernoulli pad, which cleans hulls using wall shear. This mechanism is consistent with the working mechanism of slime-release surface coatings. Here, we use data from a large number of simulations to show that the peak shear force created by these devices has a dimensionless power-law relationship with the fluid power delivered to the inlet of the pad and the equilibrium distance between the pad and the hull. This prescriptive model can be used to determine the geometry and operating characteristics of a pad which will be required to produce a given level of wall shear, and thereby dislodge a given tenacity of biofouling agent.
1. Introduction
Bernoulli pads or Bernoulli grippers are used widely to grip objects or surfaces without physically contacting them. In its simplest implementation, this device consists of an axial jet surrounded by a surface which is parallel to the exit of the jet – see figure 1. Other implementations exist, which use a simple (Reference Brun and MelkoteBrun & Melkote, 2009) or complex (Reference Wagner, Chen, Nayyerloo, Wang and ChaseWagner, Chen, Nayyerloo, Wang, & Chase, 2008) centre body to redirect the axial flow as it exits the jet. Because of their ability to manipulate delicate parts in a clean environment, Bernoulli pads and similar technologies (Reference Paivanas and HassanPaivanas & Hassan, 1981) see widespread use in the semiconductor industry, and a rich patent literature focused on this application has also been developed (Reference FreyFrey, 1999; Reference LogueLogue, 1970; Reference McIlwraith and ChristieMcIlwraith & Christie, 2003). Because these devices are able to exert force to grip soft and pliable workpieces, they have also been explored in medical (Reference Ertürk and ErzincanlıErtürk & Erzincanlı, 2020), apparel (Reference Fantoni, Santochi, Dini, Tracht, Scholz-Reiter, Fleischer and VerlFantoni et al., 2014) and meat processing (Reference Misimi, Oye, Eilertsen, Mathiassen, Asebo, Gjerstad and SkotheimMisimi et al., 2016) applications. The direction and magnitude of the normal force produced by the pad depends on the distance between the pad and the opposite surface. In the limit where the pad contacts the surface, the repulsive force is equal to the product of the jet's area and feed pressure, whereas at very large distances, the repulsive force scales with the jet momentum. An attractive force is produced at some intermediate distance, which can be understood, with an important caveat, in the context of the Bernoulli equation. By combining the Bernoulli equation with mass conservation, we find an expression for the local pressure
 \begin{equation} p(r) = p(0)-\frac{\rho}{2}\left(\frac{{\rm \pi} d^2 u_{in}}{8{\rm \pi} hr} \right), \end{equation}
for the geometry in figure 1. In figure 1 and (1.1),  $\rho$ denotes the fluid density, $u_{in}$ denotes the inlet flow velocity, $r$ denotes the radial direction, h is the gap height and d is the inlet diameter of the pad. For small values of the product $hr$, a net negative gage pressure results, which can produce a net attractive force integrated over the pad area. Because the force is repulsive in the limits of large and small $h$ and attractive for intermediate values, the system has two equilibrium points, one stable and the other unstable (Reference Kamensky, Hellum and MukherjeeKamensky, Hellum, & Mukherjee, 2019; Reference Li and KagawaLi & Kagawa, 2014). Assuming a sufficient flow rate for the applied force, the system will operate at its stable equilibrium height $h_{eq}$, which dictates the distance between the pad and the opposing surface. This height is important in a variety of applications (Reference Olsson and WilliamsOlsson & Williams, 1969; Reference Wagner, Chen, Nayyerloo, Wang and ChaseWagner et al., 2008), and also is linked to the amount of fluid power required to operate the device (Reference Kamensky, Hellum and MukherjeeKamensky et al., 2019).

Figure 1. A Bernoulli pad showing the inlet and outlet flow parameters.
Reference Kamensky, Hellum and MukherjeeKamensky et al. (2019) produced a scaling relationship between operating power and equilibrium height, the derivation of which indicates that work added to the system is primarily required to overcome shear at the wall. This wall shear is the reason that the inviscid analysis in (1.1) is not fully correct (Reference Wark and FossWark & Foss, 1984). For most applications, the wall shear is a by-product of the normal force that supports the workpiece. Although the effect of the pressure distribution on delicate (Reference Brun and MelkoteBrun & Melkote, 2009) and flexible (Reference Dini, Fantoni and FailliDini, Fantoni, & Failli, 2009) workpieces has been examined, shear is less well studied. Typically, deformation or destruction of the opposing surface due to shear forces is not a substantial concern, because the maximum normal stresses are much larger.
The present work is motivated by a grooming application in which a Bernoulli pad is moved around the submerged hull of a marine vessel to remove biofouling. In this application, the pad keeps itself close to the surface of the vessel using the attractive normal forces generated, and simultaneously uses the wall-shear forces for biofouling mitigation (Reference Kamensky, Hellum, Mukherjee, Naik and MoisanderKamensky, Hellum, Mukherjee, Naik, & Moisander, 2020). This method of cleaning is consistent with the operation of commercially available fouling-release coatings (Reference Hu, Xie, Ma and ZhangHu, Xie, Ma, & Zhang, 2020), which use boundary-layer shear while the vessel is underway to slough fouling organisms. Biofouling colonization on a ship's hull is most problematic in port, where these forces are not present. For the grooming device to keep the vessel clean, it is necessary for the local shear stress imposed at the hull to be large enough to dislodge fouling organisms, a value which depends on the organism and settling time (Reference Menesses, Belden, Dickenson and BirdMenesses, Belden, Dickenson, & Bird, 2017). The maximum shear stress created by the flow field is therefore a parameter of interest for this application.
In this work, we simulate a large number of Bernoulli pad geometries, using water as the working fluid. The methods used in these simulations are validated by a particle tracking velocimetry (PTV) experiment performed for one of the geometries. These simulations indicate that the maximum shear stress increases as the equilibrium height decreases, and as the inlet fluid power increases. We also present a dimensionless power-law model for the inlet fluid power, based on the maximum shear stress and equilibrium height. These data also indicate a power-law relationship between the maximum shear stress and the inlet Reynolds number. The empirical form found for the relationship between maximum shear stress and inlet power also indicates a relationship between the inlet Reynolds number and the length scale which characterizes the dissipation of power by wall shear.
2. Methodology
2.1 Computational domain
The Bernoulli pad is axially symmetric and therefore the fluid dynamics is investigated using a two-dimensional axisymmetric computational model; this significantly reduces the computational time. The computational domain is defined by the inner diameter  $d$, outer diameter $D$ and gap height $h$ – see figure 1. An axial flow is provided at the inlet; assuming incompressibility, the flow parameters include the inlet velocity $u_{in}$, the inlet pressure $p_{in}$ and fluid density $\rho$. After impinging the wall, the fluid flows radially outward through the gap; the pressure at the outlet is atmospheric, $p_{atm}$. The surface roughnesses of the pad and the wall are $\varepsilon _{p}$ and $\varepsilon _{w}$, respectively, and no-slip boundary conditions are imposed on both surfaces. Following the work by Reference Kamensky, Hellum and MukherjeeKamensky et al. (2019), a four equation-based transition-shear stress transport model is used for turbulence modelling. As discussed therein, there exists a stable equilibrium gap height $h_{eq}$, where the net normal force on the wall is zero. In this study, the same model is used to determine the inlet velocities that correspond to different configurations of stable equilibrium gap, $h_{eq}$. It should be noted that, although $h_{eq}$ is an imposed condition for the CFD model, in a physical system $h_{eq}$ is the result of the imposed flow conditions and pad geometry. In this study, we investigate the relationship between inlet fluid power and maximum wall-shear stress at $h_{eq}$.
2.2 Validation with PTV
The CFD simulations were carried out using an element size of  $6 \times 10^{-5}$ m; this resulted in $61\ 302$ elements and a maximum $y^{+}$ value of $7.5$. A smaller element size of $5 \times 10^{-5}$ m resulted in $75\ 315$ elements but the percentage change in the maximum wall normal and maximum wall-shear stresses ( $0.11\,\%$ and
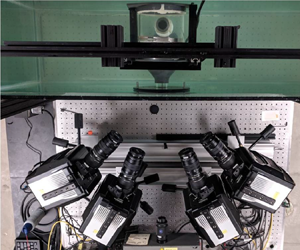
  $0.87\,\%$, respectively) did not justify the additional computational cost. To gain confidence in our CFD results, we compare them with experimental results obtained using three-dimensional PTV. The details of the experimental set-up can be found in Reference KamenskyKamensky (2020). The PTV data are used to determine the ensemble averaged velocity on an $r$–
$r$– $z$ plane of the flow domain (refer to figure 1) and is compared with CFD results in figure 2 for $z = h/2$: the radial velocity was non-dimensionalized with respect to its maximum value $u_{max}$ and the radial position was non-dimensionalized with respect to the outer radius of the pad. There is a good agreement between the velocity profiles obtained using CFD simulations and PTV experiments; the location of the maximum peak is also observed at the same value of $r$ (
$r$ ( $r = 16.62$ mm), which is very near to the entrance of the fluid in the radial direction ( $r = d/2 = 15.875$ mm). This provides us with confidence to proceed with analysis of CFD data.

Figure 2. Comparison of PTV and computational fluid dynamics (CFD) data: plot of non-dimensional radial velocity at  $z = h/2$ with respect to non-dimensional radial position.
2.3 The CFD data
The nominal parameter values used for the CFD simulations are
 \begin{equation} d = 31.75\ {\rm mm}, \quad D = 200\ {\rm mm}, \quad h_{eq} = 1.5\ {\rm mm}, \quad \varepsilon_{p} = \varepsilon_{w} = 0.04\ {\rm mm}. \end{equation}
A total of 45 design points were generated using three values of  $d$ (
$d$ ( $0.5$, $0.707$ and $1$ times the nominal value), five different values of $D$ (
$D$ ( $0.5$, $0.707$, $1$,
$1$,  $1.414$ and $2$ times the nominal value) and three different values of $h_{eq} = \{1.4, 1.5, 1.6\}$ mm. The values of $\varepsilon _{p}$ and $\varepsilon _{w}$ used are consistent with the surface roughness of structural steel. A brief discussion of hydraulic roughness can be found in the Discussion section.
The inlet fluid power  $\dot W_{in}$, defined in Reference Kamensky, Hellum and MukherjeeKamensky et al. (2019) as
 \begin{equation} \dot{W}_{in} = 2{\rm \pi} \int_0^{d/2} \left[\frac{1}{2} \rho [U(r)]^2 + p(r) \right] U(r) r \, {\rm d}r, \end{equation}
and the maximum shear stress on the wall  $\tau _{{w},{max}}$ are obtained for all these design points; they are plotted in figure 3 in log–log scale. The 45 data points are grouped into nine sets of five points. Each set of five points are joined by straight line segments and correspond to the five different values of $D$ for specific values of $d$ and $h_{eq}$; the direction in which $D$ increases is shown in the figure. The data points shown with $*$,
$*$,  $\circ$ and $\bigtriangleup$ symbols correspond to specific values of $h_{eq}$, shown in the figure. For clarity, a magnified image of a portion of the plot is shown in the inset; the top three lines (dashed) correspond to $d = 31.75$ mm, the middle three lines (solid) correspond to $d = 31.75 \times 0.707 = 22.44$ mm and the bottom three lines (dotted) correspond to $d = 31.75 \times 0.5 = 15.875$ mm. It is evident that the maximum wall-shear stress varies linearly with the inlet fluid power for given values of $d$ and $h_{eq}$; furthermore, as expected, the maximum wall shear stress increases as $h_{eq}$ decreases for the same level of inlet power.

Figure 3. Plot of inlet fluid power versus maximum wall-shear stress.
The region of peak shear inside the pad is also the region of lowest pressure. If the flow rate is high enough, this pressure could potentially reach the vapour pressure of the working liquid, inducing cavitation. If cavitation were to occur, the wall-shear stress would likely reduce dramatically in the presence of vapour bubbles, reducing the cleaning performance of the Bernoulli pad. Also, cavitation could have a potentially damaging effect on the surface. Hence, its presence is undesirable. To avoid cavitation, the flow rates considered are such that the lowest pressure inside the pad does not go below the vapour pressure of water at room temperature.
3. Analysis
In a physical system like the one considered in this study, the gap between the pad and wall is not imposed. Rather, the system reaches the equilibrium gap  $h_{eq}$ as the result of the imposed pad geometry (inner and outer diameters $d$ and $D$, respectively), and inlet flow conditions (inlet velocity $u_{in}$, characteristic length $d$ and fluid physical properties). Also, as a result of those imposed conditions, the flow will exhibit a maximum wall shear $\tau _{{w},{max}}$ somewhere along the radius of the gap, and consequently will demand a certain amount of power $\dot {W}_{in}$ to sustain the inlet flow conditions. With this in mind, the independent variables governing the flow through a Bernoulli pad in equilibrium conditions are the geometric parameters $d$ and $D$ and the inlet flow parameters $\rho$, $\mu$ and $u_{in}$, because those are the only variables controlled by the experimentalist; and in consequence $\dot W_{in}$, $h_{eq}$ and $\tau _{{w},{max}}$ are the dependent variables because they result from the imposed geometric conditions and inlet flow conditions. Therefore, the dependent variables can be expressed as a function of the independent variables as follows:
 \begin{equation} \dot W_{in} = f(\mu, u_{in}, D, d, \rho), \quad h_{eq} = g(\mu, u_{in}, D, d,\rho), \quad \tau_{{w},{max}} = h(\mu, u_{in}, D, d, \rho). \end{equation}
After choosing the inlet diameter  $d$, dynamic viscosity $\mu$ and inlet velocity $u_{in}$ as repeating variables, a dimensional analysis over each one of the above functional forms provide the following set of dimensionless parameters:
 \begin{equation} \tilde{\dot W}_{in} = \frac{ \dot{W}_{in}}{\mu u_{in}^2 d}, \quad h^ * = \frac{h_{eq}}{d}, \quad \tilde \tau_{w, max} = \frac{\tau_{{w},{max}} d}{\mu u_{in}}, \quad D^ * = \frac{D}{d}, \quad {Re}_{in} = \frac{\rho u_{in} d}{\mu}. \end{equation}
The non-dimensional maximum shear stress  $\tilde \tau _{w, max}$ is the ratio between the maximum wall-shear stress and a combination of parameters that together also have the dimension of stress: $\mu u_{in}/d$. This combination of parameters is, however, representative of a shear scale in the inlet pipe rather than in the pad gap. A more appropriate shear scaling would be of the form $\mu u_{c}/h_{eq}$, where $u_{c}$ is the characteristic velocity at the inlet of the pad gap (since the maximum shear occurs in this region), and can be determined from the volumetric flow rate $\dot {V}$ and the inlet cross-section of the pad gap as follows:
 \begin{equation} \dot{V} \triangleq \left(\frac{\rm \pi}{4}d^2\right) u_{in} \Rightarrow u_{c} = \frac{\dot{V}}{{\rm \pi} d h_{eq}} = \frac{1}{4}\times\frac{u_{in}\, d}{ h_{eq}}. \end{equation}
Hence, the shear scaling for the inlet region of the pad gap is
 \begin{equation} \mu \frac{u_{c}}{h_{eq}} = \frac{1}{4}\times\frac{\mu u_{in}d}{ h_{eq}^2} \sim \frac{\mu u_{in}d}{ h_{eq}^2}. \end{equation}
The factor  $1/4$ can be ignored because it will be ultimately absorbed by a fitting coefficient. The non-dimensional shear stress $\tilde \tau _{w, max}$ can now be manipulated based on this shear scaling as follows:
 \begin{equation} \tilde\tau_{w, max} = \frac{\tau_{{w},{max}} d}{\mu u_{in}} = \frac{\tau_{{w},{max}} d}{\mu u_{in}(d/h_{eq}^2)}\times \frac{d}{ h_{eq}^2} = \frac{\tau_{{w},{max}}}{\mu u_{in}(d/h_{eq}^2)} \times [h^ * ]^{{-}2}.\end{equation}
Equation (3.5) shows that  $\tilde \tau _{w, max}$ is the combination of a new expression for the dimensionless maximum shear and $h^*$, but $h^*$ is one of the dependent non-dimensional variables. To eliminate this redundancy, $\tilde \tau _{w, max}$ is replaced by $\tau _{w, max}^*$, which is defined as follows:
 \begin{equation} \tau_{w, max}^ * = \frac{\tau_{{w},{max}}}{\mu u_{in} (d/ h_{eq}^2)}. \end{equation}
The set of dimensionless parameters in (3.2a–e) can now be modified to
 \begin{equation} \tilde{\dot W}_{in} = \frac{\dot{W}_{in}}{\mu u_{in}^2 \,d}, \quad h^ * = \frac{h_{eq}}{d}, \quad \tau_{w, max}^ * = \frac{\tau_{{w},{max}}}{\mu u_{in} (d/ h_{eq}^2)}, \quad D^ * = \frac{D}{d}, \quad {Re}_{in} = \frac{\rho u_{in}\, d}{\mu}. \end{equation}
This set of parameters reduces the physical system to three dimensionless functions of the form
 \begin{equation} \tilde{\dot W}_{in} = \varPhi(D^ * , {Re}_{in}), \quad h^ * = \varGamma(D^ * , {Re}_{in}), \quad \tau_{w, max}^ * = \varPsi(D^ * , {Re}_{in}). \end{equation}
The dimensionless system described by (3.8a–c) has two independent variables ( $D^*$ and ${Re}_{in}$) as opposed to the five independent variables ( $\mu, u_{in}, D, d, \rho$) of the dimensional system in (3.1a–c). While there are no analytical solutions available to determine the exact form of the relationships in (3.8a–c), it is possible to use regression analysis to determine how the independent variables predict the dependent variables. Figure 3 suggests that the inlet power $\dot {W}_{in}$ is linearly related to the maximum shear stress $\tau _{{w},{max}}$ in a log–log space. This suggests that the relationships in (3.8a–c) are also linear in a log–log space
 \begin{gather} \ln\tilde{\dot{W}}_{in} = C_{11}\ln{D^ * } + C_{12}\ln{{Re}_{in}} + C_{13}, \end{gather}
 \begin{gather}\ln{h^ * } = C_{21}\ln{D^ * } + C_{22}\ln{{Re}_{in}} + C_{23}, \end{gather}
 \begin{gather}\ln \tau_{w, max}^ * = C_{31}\ln{D^ * } + C_{32}\ln{{Re}_{in}} + C_{33}. \end{gather}
Equations (3.9a), (3.9b) and (3.9c) can be used to eliminate  $D^*$ and ${Re}_{in}$ and obtain the relationship between the dependent variables
 \begin{equation} \ln\tilde{\dot W}_{in} = \kappa_1 \ln{h^ * } + \kappa_2 \ln{\tau_{w, max}^ * } + \kappa_3, \end{equation}
where the coefficients  $\kappa _1$, $\kappa _2$ and $\kappa _3$ can be obtained using the relations
 \begin{gather} \kappa_1 = \frac{C_{12} C_{31} - C_{11} C_{32}}{C_{22} C_{31} - C_{21} C_{32}}, \end{gather}
 \begin{gather}\kappa_2 = \frac{C_{11} C_{22} - C_{12} C_{21}}{C_{22} C_{31} - C_{21} C_{32}}, \end{gather}
 \begin{gather}\kappa_3 = \frac{C_{13} C_{22} C_{31} - C_{12} C_{23} C_{31} - C_{13} C_{21} C_{32} + C_{11} C_{23} C_{32} + C_{12} C_{21} C_{33} - C_{11} C_{22} C_{33}}{C_{22} C_{31} - C_{21} C_{32}}. \end{gather}
 If the assumption of linearity in log–log space is true, the linear model in (3.10) can also be used for a direct fit to the data, and the resulting values of the coefficients  $\kappa _i$, $i = 1, 2, 3$, should be consistent with the values determined from (3.11a), (3.11b) and (3.11c). This latter approach can be viewed as the indirect fit.
4. Results
A direct fit of the linear model in (3.10) to the CFD data results in the following values of the coefficients:
 \begin{equation} [\!\begin{array}{ccc} \kappa_1 & \kappa_2 & \kappa_3 \end{array}\!] = [\!\begin{array}{ccc} -1.9683 & 2.3416 & 0.1115 \end{array}\!]. \end{equation}
These coefficient values can be substituted in (3.10) to obtain the following power-law expression:
 \begin{equation} \tilde{\dot W}_{in} = 1.1180 [\tau_{w, max}^ * ]^{2.3416} [h^ * ]^{{-}1.9683}. \end{equation}
The power law obtained in (4.2) collapses the data on a straight line in a log–log plane – this is shown in figure 4.

Figure 4. Plot showing CFD data collapsing onto a straight line corresponding to the power law in (4.2).
By fitting (3.9a), (3.9b) and (3.9c) to the CFD data, we get the following results for the matrix of coefficients  $\mathbb {C} = [C_{ij}]$, $i, j= 1, 2, 3$; the coefficients can then be computed indirectly as follows:
 \begin{equation} \mathbb{C} = \left[\begin{array}{ccc} -1.4703 & 2.1924 & -5.9854\\ 0.8564 & -0.7021 & 1.9268\\ 0.0867 & 0.3477 & -0.9874 \end{array}\right] \Rightarrow [\!\begin{array}{ccc} \kappa_1 & \kappa_2 & \kappa_3 \end{array}\!] = [\!\begin{array}{ccc} -1.9554 & 2.3568 & 0.1094 \end{array}\!]. \end{equation}
 A comparison of the results in (4.1) and (4.2), obtained through direct and indirect fits of the data, indicates that  $\kappa _1$ and $\kappa _2$ differ by 0.65 %, the results for $\kappa _3$ differ by 1.9 %. A goodness-of-fit analysis of the direct fit was conducted via calculation of the relation coefficient and an Anderson–Darling normality test (Reference D'Agostino and StephensD'Agostino & Stephens, 1986; Reference StephensStephens, 1974). The details of these statistical tests are not shown here for brevity, but the results confirm that (4.2) describes the data adequately and is likely a good model for the physical phenomenon studied herein: the direct fit exhibits a relation coefficient of $R^2=0.9951$; and the Anderson–Darling normality test demonstrates that the residuals of the direct fit follow a normal distribution.
In the study by Reference Kamensky, Hellum and MukherjeeKamensky et al. (2019),  $\dot {W}_{in}$ was non-dimensionalized as follows:
 \begin{equation} \dot{W}_{in}^ * = \frac{\dot{W}_{in}}{\mu u^2_{in}D(D/d)}. \end{equation}
To put the current results in context with that study,  $\tilde {\dot W}_{in}$ can be shown to be equal to $\dot {W}_{in}^* {D^*}^2$. Therefore, we get from (4.2)
 \begin{equation} {\dot W}_{in}^ * = 1.1180 [\tau_{w, max}^ * ]^{2.3416} [h^ * ]^{{-}1.9683} [D^ * ]^{{-}2}. \end{equation}
Based on theoretical grounds, Reference Kamensky, Hellum and MukherjeeKamensky et al. (2019) proposed a proportionality of the form:  ${\dot W}_{in}^* \propto [h^*]^{-3}$, which was near to the scaling observed in that work. But (4.5) suggests a proportionality closer to ${\dot W}_{in}^* \propto [h^*]^{-2}$. These results are different because they describe different phenomena. While the former is based on the global effect of inlet fluid power on equilibrium height, the latter focuses on the local effects (where the shear stress is maximum) that relate fluid power with maximum shear stress and equilibrium height.
5. Discussion
5.1 Relationship between maximum shear stress and inlet Reynolds number
The location of the maximum shear stress is just beyond the location of the corner,  $r \approx d/2$; this short development length indicates a laminar boundary layer over the range of flow speeds examined here. The shear stress for a large number of laminar flows takes the form $\tau \propto \rho U^2 {Re}^n \varLambda$, where $U$ is the flow velocity and $\varLambda$ is a flow-dependent length scale. The value $n = -1/2$ has been found for pure boundary layers with zero and non-zero pressure gradients (Reference WhiteWhite, 1974). This value of $n$ was also found for the developed portion of the flow under a Bernoulli pad by Reference Guo, Shan, Xie, Li, Xu and ZhangGuo et al. (2017). The same is true for the maximum wall shear produced by both the planar and axisymmetric wall jet, which is an unconfined analogue of the developing region of the Bernoulli pad flow (Reference Phares, Smedley and FlaganPhares, Smedley, & Flagan, 2000).
The latter work uses laminar boundary-layer theory to yield (in our nomenclature) the expression  $\tau _{{w},{max}} \propto \rho u_{in}^2 {Re}_{in}^n [h^*]^{-2}$ for the maximum shear stress. The use of the gap height arises in the wall jet because of the development of the shear layer at the edge of the jet. Using our scaling relationships, this expression predicts that
 \begin{align} \tau_{w, max}^ * & = \frac{\tau_{{w},{max}}}{\mu u_{in} d/h_{eq}^2} \propto \frac{\rho u_{in}^2}{\mu u_{in} d/h_{eq}^2} {Re}_{in}^{n}[h^ * ]^{{-}2} = \left(\frac{\rho u_{in} d}{\mu}\right) \left(\frac{h_{eq}^2}{d^2}\right) {Re}_{in}^n [h^ * ]^{{-}2} = {Re}_{in}^{n + 1} \nonumber\\ &\Rightarrow \tau_{w, max}^ * \propto {Re}_{in}^{n + 1} , \end{align}
that is, the non-dimensional shear stress is not dependent on any length scale other than the one appearing in the Reynolds number. We have found this to be the case (see figure 5), where the value  $n+1 = 0.42$, or $n = -0.58$, is broadly in line with the findings for other flow fields. We can write (4.2) as a proportionality in terms of ${Re}_{in}$ and $h^*$
$h^*$
 \begin{equation} \tilde{\dot W}_{in} \propto [{Re}_{in}^{0.42}]^{2.3416} [h^ * ]^{{-}1.9683} = [{Re}_{in}]^{0.98} [h^ * ]^{{-}1.9683}. \end{equation}
Figure 5. Best fit of CFD data showing power-law relationship between  $\tau _{w, max}^*$ and ${Re}_{in}$.
The exponents which appear in (5.2) are enticingly near to round numbers but we have not been able to predict them using analytical methods. This statement also holds for expressions presented in the following section. We therefore present these relationships as implications of the data rather than derivations.
5.2 Implications of the observed scaling relationship
We can write the power  $\dot {W}_{in}$ required to operate the pad in terms of the shear stress
 \begin{equation} \dot{W}_{in} \propto \int^{2{\rm \pi}}_0 \int^{D/2}_0 \tau_{w}(r) U(r) r \, {\rm d} r \, {\rm d} \theta \propto\int^{r_{w}}_0 \tau_{{w},{max}} U(r) r \, {\rm d} r,\end{equation}
where  $r_{w}$ is a radial location which characterizes an area over which we have to integrate the shear stress, and $U(r)$ is the mean radial component of the velocity in the gap. There are two critical assumptions being made. The first assumption is that the power required to operate the system is well characterized by the integral of the wall shear over the entire pad area; this is consistent with a low fraction of the inlet power being used to provide kinetic energy to the fluid (Reference Kamensky, Hellum, Mukherjee, Naik and MoisanderKamensky et al., 2020). The second assumption is that the integral of the wall shear over the entire pad area can be characterized using the maximum shear stress, integrated over a much smaller area. We justify this partially on the basis of the mean radial velocity $U(r)\propto r^{-1}$. Because $\tau _{w}(r) \propto [U(r)]^2$, $\tau _{w}(r) U(r) r \propto r^{-2}$, and therefore most of the power used to overcome wall shear is expended at small $r$. This assumption is further justified by the observed empirical form, in which the outer diameter $D$ does not explicitly appear. We now manipulate the integrand, using the result from mass conservation
 \begin{equation} U(r) \propto \dfrac{u_{in} d}{h^ * r} \Rightarrow \tau_{{w},{max}} U(r) r \propto \tau_{w, max}^ * \left(\frac{\mu u_{in}}{d [h^ * ]^{2}} \right) \left(\frac{u_{in} d}{h^ * r}\right)r \propto \mu u_{in}^2 \tau_{w, max}^ * [h^ * ]^{{-}3}. \end{equation}
Placing this form into (5.3) and making the result non-dimensional yields
 \begin{equation} \dot{W}_{in} \propto \int_0^{r_{w}} \mu u_{in}^2 \tau_{w, max}^ * [h^ * ]^{{-}3} \, {\rm d} r \Rightarrow \tilde{\dot W}_{in} \propto \frac{1}{\mu u_{in}^2 d} \int_0^{r_{w}} \mu u_{in}^2 \tau_{w, max}^ * [h^ * ]^{{-}3} \, {\rm d} r = \tau_{w, max}^ * [h^ * ]^{{-}3} \left(\frac{r_{w}}{d} \right).\end{equation}
The empirical relationship in (4.2) has the form  $[\tau _{w, max}^*]^m [h^*]^{-2}$, where $m=2.34$. A comparison between this form and the above relationship, and substitution of (5.1) along with the value of the observed constant $n=-0.58$, yields
 \begin{equation} \frac{r_{w}}{d}\propto [\tau_{w, max}^ * ]^{m-1} h^ * \Rightarrow \frac{r_{w}}{h_{eq}} \propto {Re}_{in}^{(m-1)(n + 1)}\approx {Re}_{in}^{0.56} .\end{equation}
This indicates that the length scale in the problem which best represents the power dissipated by wall shear is the equilibrium gap height  $h_{eq}$, but with a non-trivial dependence on the inlet Reynolds number. The reason for this Reynolds number dependence is likely related to both the growth of the boundary layer on the wall, and the scale of the recirculation bubble on the pad (Reference Nakabayashi, Ichikawa and MorinishiNakabayashi, Ichikawa, & Morinishi, 2002).
As a final comment, we note that the ‘entrance length’ of a pipe or channel is defined as a region with wall shear substantially above the value in the fully developed flow (Reference WhiteWhite, 1974). This is analogous to our definition of  $r_{w}$ within the gap between the pad and the wall. For planar channels, the dimensionless entrance length scales with ${Re}^{1.0}$. Equation (5.6) indicates that the entrance length to a radial outflow scales instead with ${Re}_{in}^{0.56}$, notably reduced from the planar case.
5.3 Hydraulic roughness
The roughness used in our simulations follows the model of monodisperse sand grains (Reference NikuradseNikuradse, 1950). That source uses the roughness Reynolds number to define the wall as hydraulically smooth for  $\varepsilon ^+ \lesssim 5$, transitionally rough for $5 < \varepsilon ^+ < 70$ and rough for $\varepsilon ^+ \gtrsim 70$, where
 \begin{equation} \varepsilon^ + \triangleq \varepsilon u_\tau \rho/ \mu, \quad u_\tau \triangleq \sqrt{\tau_{w}/\rho}. \end{equation}
 Although the present study was not undertaken in a zero pressure gradient boundary layer, we can use these values to provide context for the material roughness employed in the simulations by defining a local value for  $\varepsilon ^+$ based on the local value of $u_\tau$.
The flow was hydraulically smooth predominantly over most of the pad's surface in all simulations. The worst case was observed for the nominal pad:  $d = 31.75$ mm, $D = 200$ mm, $h_{eq} = 1.5$ mm, $\varepsilon _{p} = \varepsilon _{w} = 0.04$ mm, which showed $\varepsilon ^+ \approx 8.096$ at the point of maximum shear stress. For this worst case, there was a mild transitionally rough behaviour around the region of maximum shear. A full examination of the roughness in the context of the proposed biofouling removal application would probably require a more detailed description of the roughness, to include material properties and inhomogeneities. For the present work, we have restricted ourselves to a real material for which we have experimental data, and with a roughness which is small with respect to the gap height.
6. Concluding remarks
A computational study of Bernoulli pads has been performed in order to determine a relationship between the input power required to maintain stable equilibrium and the maximum shear stress. The scaling law presented collapses the power and shear stress results of a large number of pad geometries and operating conditions onto a single curve. This collapse is extremely robust over the range of parameters examined. Because the inlet power is computed using a combination of the pressure and velocity at the inlet, it is not obvious a priori that the inlet power would be so well described by the maximum value of shear stress. Reference Kamensky, Hellum and MukherjeeKamensky et al. (2019) indicated that the fluid power scaled with ‘worst case’ choices of characteristic parameters: largest velocity, largest gradient and largest area. Although the largest velocity and gradient occur near the location of maximum shear stress, this position is much nearer to the jet exit  $d$ than the outer diameter $D$. These findings are not inconsistent, since the outer diameter is being used in (3.8a–c) to scale the power, equilibrium height and shear stress. It appears that (per the arguments made in the Discussion) the power expended to overcome wall shear over the entire pad is proportional to the maximum value.
Unusually, this work has used water as the working fluid in its simulations of the Bernoulli pad flow field. This is consistent with our proposed application, which is to use a Bernoulli pad to groom underwater surfaces without contact. This choice of working fluid introduces a great deal of potential richness – particularly cavitation – which has been ignored in the present work. Because cavitation occurs when the local pressure is below the vapour pressure, bubble formation tends to happen where the local velocity is large – precisely where we observe the highest wall-shear stress. The design of alternate flow geometries which create sufficiently high levels of shear stress to groom surfaces while controlling cavitation will be examined in future work. Although it is unlikely that the scaling laws proposed here will work ‘off the shelf’ on these new geometries, we anticipate that the techniques used here will be employed.
Funding statement
This work was partially funded by the Office of Naval Research, grant no. N00014220-1-2170, through a subcontract provided by the University of Massachusetts, Dartmouth.
Declaration of interests
The authors declare no conflict of interest.
Data availability statement
The datasets generated during and/or analysed during the current study are available from the corresponding author on reasonable request.


 Open access