


1. Motivation and background
The rising consumer interest in environment-friendly and healthful diets has contributed to the valuation of organic products (e.g., Batte et al., Reference Batte, Hooker, Haab and Beaverson2007; Gundala and Singh, Reference Gundala and Singh2021; Thompson, Reference Thompson1998). Organic food has been a significant food segment in the United States that continued to grow over time in recent decades (Organic Trade Association, 2021). Overall, the recent growth of many organic products and their premiums can be partly attributed to a rise in demand (Badruddoza et al., Reference Badruddoza, Carlson and McCluskey2022). This is intuitive because a large number of studies have shown that consumers perceive organic food products as healthier, tastier, and environment-friendly (Schleenbecker and Hamm, Reference Schleenbecker and Hamm2013). Sociodemographic features such as household income, education, perceived quality, and the presence of children in the household are commonly studied predictors of organic food purchases (Janssen, Reference Janssen2018). Given that the motivation for purchasing organic is related to personal and family health, a relevant question is whether the preference for organic increases when the meal is prepared for the family. For example, the valuation of food items that are perceived as healthful may increase when the meal is prepared for the family on special occasions, e.g., during the holidays.
Multiple holidays are celebrated in the United States, among which Thanksgiving ranks as the most popular, with a trend toward the highest caloric intake (Huen, Reference Huen2016; Statista, 2021), as households celebrate material abundance through feasting (Wallendorf and Arnould, Reference Wallendorf and Arnould1991). Purchasing behavior during this season differs from the rest of the year. Purchase tracking in 2021 showed that four weeks before the holiday, Thanksgiving-related items accounted for 81% of the $2.2 billion in grocery sales in the United States (Browne, Reference Browne2021). The sharp increase in demand for organic products has created shortages of some items before Thanksgiving, such as the turkey shortage during Thanksgiving 2021 (Lawrence White, Reference Lawrence White2021; Severson, Reference Severson2021).
Given the importance of Thanksgiving in the U.S. food market, the current study examines consumer valuation of Thanksgiving baskets comprised of commonly purchased Thanksgiving items, especially those with certified organic or similar regional claims. It also attempts to understand the impact of the holiday season on consumption motivated by perceived health and environmental well-being. The specific objectives are to 1) understand consumer preferences for common Thanksgiving food items and analyze consumer valuation of organic Thanksgiving items due to health or environmental motivation, 2) measure consumer preferences for Thanksgiving-themed products with other organic-like claims, such as naturally grown, 3) compare consumer preferences for various Thanksgiving-themed items with a pre-defined Thanksgiving-themed basket, and 4) identify consumer characteristics that affect these preferences.
The motivation of this research is to understand the opportunities for organic agriculture. For example, an increase in valuation for organic items during holidays indicates that organic items are more marketable for family meals, and organic producers and retailers should expect greater demand during occasions with family meals. Although the concept of organic is nothing new, organic food has gained further popularity among consumers in recent years (Badruddoza et al., Reference Badruddoza, Carlson and McCluskey2022). For instance, organic products can be found in three out of four conventional grocery stores in the United States, and the majority of consumers have purchased at least one organic product at some point (Earthbound Farm, 2018; USDA, 2022). The sales of organic products were $13.26 billion in 2005, and this figure was projected to reach about $56.4 billion by 2020. The United States is the top market for organic food, with $44.7 billion in sales, constituting 1.8% of the food market in 2019 (Research Institute of Organic Agriculture 2021; Organic Trade Association, 2021). Because of the increasing demand for organic products, 16,476 organic producers were covering more than 2 million hectares in the United States as of 2019 (Research Institute of Organic Agriculture 2021).
Organic production requires certification to ensure quality and consistency. Certification labels can be found on products such as produce, dairy, meat, processed foods, condiments, and beverages. Several organic-related claims are observed in U.S. markets, with the USDA Organic certification being the most common and mainly adopted by larger producers. Nonprofit certification alternatives like the Certified Naturally Grown (CNG) and California Certified Organic Farmers (CCOF) are often used by small producers to indicate the organic production process.
The United States National Organic Program (NOP) – a federal regulatory program – develops and enforces standards for organic agricultural products produced, labeled, and sold in the United States. The USDA Organic label indicates a certification created by NOP, which implies that the product follows the Organic Foods Production Act of 1990. All ingredients comply with the National List of Allowed and Prohibited Substances, which has been in use since 2002 (USDA, 2021). The USDA organic label can be found on produce, dairy, meat, processed foods, condiments, and beverages. Products bearing this label must contain at least 95% organic ingredients and no antibiotics, pesticides, GMOs, or hormones (Farm Aid, 2021).
The Certified Naturally Grown Label (CNG) is a peer review certification founded by farmers in 2002. The certification can be obtained for produce and flowers, livestock, apiary, aquaponics, and mushrooms; and is used mainly by small-scale operations operating in local markets, fomenting farmer-to-farmer knowledge sharing. To get the CNG certificate, farmers must commit not to use synthetic herbicides, pesticides, fertilizers, or genetically modified organisms, and must follow the standards of the NOP (Lemeilleur and Allaire, Reference Lemeilleur and Allaire2016). However, these organic techniques do not automatically yield USDA organic certifications since the CNG is nonaffiliated with the NOP (Certified Naturally Grown, 2021).
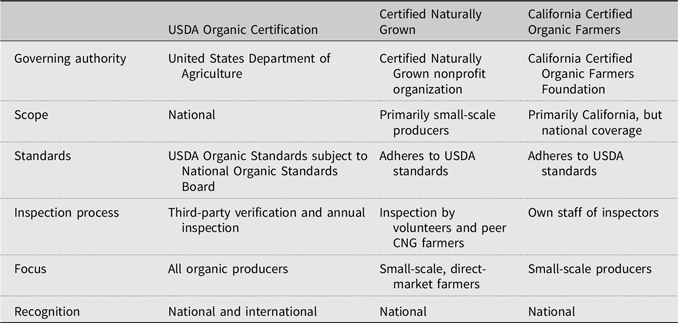
Among other organic certifications, the CCOF is a nonprofit organization that provides organic certification for farmers, ranchers, and processors. The requirements for the CCOF certification are similar to those for the USDA National Organic Program. The differences between the USDA Organic certification label, CNG label, and CCOF certification are displayed in Appendix 1. Overall, the main differences between the certifications lie in the production scale of the farm operations and inspection process. While the USDA Organic certification is a nationally recognized certification program by the USDA adopted by all production scales that relies on third-party agencies for certification, the CNG and CCOF programs focus on small-scale and direct-market farmers as an alternative option for organic certification and the inspection process is carried by peer CNG farmers for the CNG certification and own inspectors for the CCOF certification (CNG, 2023; USDA, 2023; CCOF 2023).
A large number of studies measure consumer valuations of the USDA organic label or organic products (e.g., Bauer et al., Reference Bauer, Heinrich and Schäfer2013; Conner and Christy, Reference Conner and Christy2004; Lee et al., Reference Lee, Shimizu, Kniffin and Wansink2013). However, the literature on the other two labels – CNG and CCOF – is limited. Most studies use stated preference approaches such as choice experiments to measure consumer willingness to pay (WTP) for organic certification and its sociodemographic determinants (e.g., Bauer et al., Reference Bauer, Heinrich and Schäfer2013; Lee et al., Reference Lee, Shimizu, Kniffin and Wansink2013; Janssen and Hamm Reference Janssen and Hamm2014). For example, researchers have investigated the valuation of the USDA label for produce, dairy, meats, processed products, and so on, finding that consumers are willing to pay positive premiums for the USDA organic label (Batte et al., Reference Batte, Hooker, Haab and Beaverson2007; Bernard et al., Reference Bernard, Zhang and Gifford2006; Hu et al., Reference Hu, Woods and Bastin2009; Katt and Meixner, Reference Katt and Meixner2020; Li and Kallas, Reference Li and Kallas2021; Van Loo et al., Reference Van Loo, Caputo, Nayga, Meullenet and Ricke2011). However, studies have found mixed evidence on the Certified Naturally Grown label, and the research has been conducted only using strawberries (Chen et al., Reference Chen, Gao, Swisher, House and Zhao2018, Reference Chen, Gao and McFadden2020; He et al., Reference He, Shi, Gao and House2020; He and Gao, Reference He and Gao2015). Some studies have found that consumer perceptions of organic certification change depending on the presence of other labels like “locally produced” and the organic certification agency (Meas et al., Reference Meas, Hu, Batte, Woods and Ernst2015; Ward et al., Reference Ward, Hunnicutt and Keith2004).
Considering the previous literature on stated preference for organic products, the current study evaluates the demand for Thanksgiving-themed products and their valuations when labeled as organic and identifies sociodemographic determinants associated with consumer preferences. It also compares the WTP to pay for individual products versus a basket of the same products sold together. While doing so, we include both USDA and non-USDA labels for a comprehensive insight.
To the best of our knowledge, this is the first study that quantitatively examines Thanksgiving-themed products and the valuation of their organic counterparts. Our findings provide a better understanding of consumer valuation of Thanksgiving items and organic food during the holiday. They may help producers, retailers, researchers, both large- and small-scale producers, and policymakers understand the surge in demand for food items during Thanksgiving. The comprehension of the organic market enables policymakers, researchers, and food industry professionals to strategize and ensure a smooth supply of organic products during Thanksgiving, as well as construct marketing strategies for the future. The study also guides producers and retailers by assessing the use and preferences of certification programs. This is important, as several producers aim to obtain certifications to improve profitability.
2. Method
We conduct a survey divided into three sections to collect information on 1) sociodemographic characteristics, 2) households’ consumption and perceptions of organic products, and 3) a choice experiment to assess their preferences for organic certification labels and producer scale in hypothetical Thanksgiving-themed products. The Institutional Review Board of Texas Tech University, Lubbock, TX, United States (IRB2021-684) approved the study on November 16, 2021. We describe each component below.
2.1. Choice experiment
The survey instrument used for data collection includes two versions of choice experiments. The first version of the choice experiment consists of two choice sets of a basket of goods for a Thanksgiving dinner. The second version of the choice experiment involves two sets of three individual Thanksgiving-themed products. The reason for using two versions of the choice experiments is to evaluate consumers’ stated preference for both individual items and a combination of items, as some previous studies have argued that a basket of goods would reflect consumers’ diet in a more general way (Balcombe et al., Reference Balcombe, Fraser and Di Falco2010). By measuring the WTP for individual goods and the same goods in a basket, results reflect if consumers have preferences for attributes byproducts or attributes that influence diet. The respondents were asked to choose products to prepare an eight-people dinner for Thanksgiving (Myers, Reference Myers2014). The products selected for the experiment were turkey, potatoes, and cranberry sauce. The relevance of these products to Thanksgiving dinner often reflects on sales, e.g., in October 2021, turkey sales were up over 200% compared to the sales in 2020, whereas November sales were up by 110% (Hughes and Breeding, Reference Hughes and Breeding2021). The popularity of potatoes is very similar to turkey. Potatoes producers name Thanksgiving the number one sales holiday (Johnson, Reference Johnson2022), and Ipsos survey results report that mashed potatoes are the number one side dish for Thanksgiving dinner and are present in 77% of Thanksgiving dinners (Snider, Reference Snider2021). Finally, cranberries are highly demanded on Thanksgiving. OceanSpray, which markets about 70% of the canned jellied cranberry sauce market, reported in 2017 that 20% of its sales (about 80 million pounds) are during the Thanksgiving season alone (OceanSpray, 2017).
The survey instrument used for data collection includes two versions of choice experiments. The first version of the choice experiment consists of two choice sets of a basket of goods for a Thanksgiving dinner. The second version of the choice experiment involves two sets of three individual Thanksgiving-themed products. The reason for using two versions of the choice experiments is to evaluate consumers’ stated preference for both individual items and a combination of items, as some previous studies have argued that a basket of goods would reflect consumers’ diet more comprehensively (Balcombe et al., Reference Balcombe, Fraser and Di Falco2010). By measuring the WTP for individual goods and the same goods in a basket, the results reflect whether consumers have preferences for attributes byproducts or attributes that influence diet. The respondents were asked to choose products to prepare an eight-people dinner for Thanksgiving (Myers, Reference Myers2014). The products selected for the experiment were turkey, potatoes, and cranberry sauce. The relevance of these products to Thanksgiving dinner is often reflected in sales, e.g., in October 2021, turkey sales were up over 200% compared to the sales in 2020, whereas November sales were up by 110% (Hughes and Breeding, Reference Hughes and Breeding2021). The popularity of potatoes is very similar to turkey, with potato producers naming Thanksgiving the number one sales holiday (Johnson, Reference Johnson2022), and Ipsos survey results reporting that mashed potatoes are the number one side dish for Thanksgiving dinner, present in 77% of Thanksgiving dinners (Snider, Reference Snider2021). Finally, cranberries are highly demanded on Thanksgiving. OceanSpray, which markets about 70% of the canned jellied cranberry sauce market, reported in 2017 that 20% of its sales (about 80 million pounds) occur during the Thanksgiving season alone (OceanSpray, 2017).
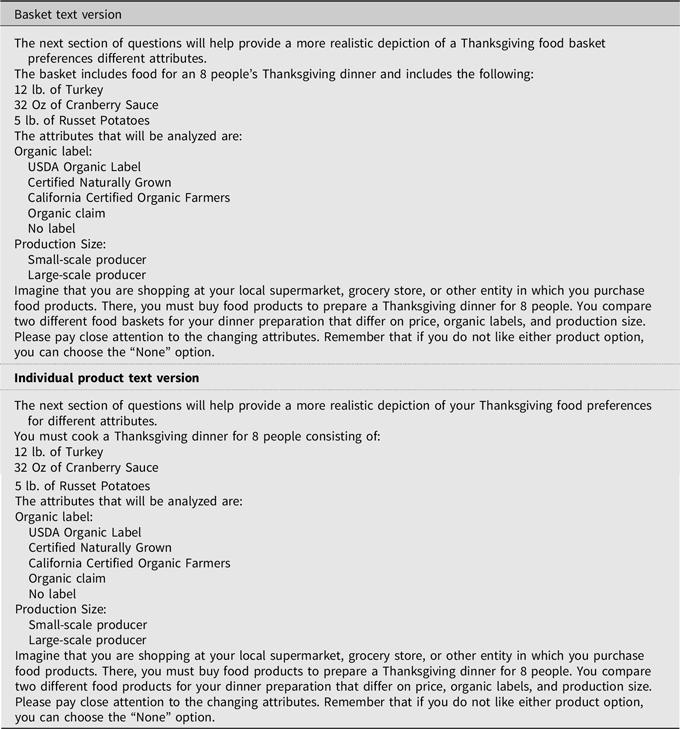
The first choice version included a basket of Thanksgiving-themed products consisting of a 12 lb. turkey, five lb. of potatoes, and 32 oz. of cranberry sauce. In this version, two choice scenarios were given to each respondent. Respondents were asked to select between two basket profiles that varied in organic certification labels, production size, and price, or they could choose a “none” option if none of the profiles were appealing. The organic certification label attribute had four levels: USDA organic label, CNG label, CCOF label, organic claim, and none label. While most of these organic levels are familiar to the public, the organic claim level aimed to gauge preferences for products purporting to be organic but lacking certification from an established agency or government entity.
The producer scale attribute was divided into small-scale producers and large-scale producers. The choice to use these terms instead of a label like “locally produced” was made because the survey was distributed at a national level, and a “locally produced” label would need to be adapted for the specific location where the survey was conducted, thus reducing randomization. The price attribute included four levels: $14.75, $17.55, $19.55, and $21.30. These prices were randomly defined based on a sample range of the basket products collected from online retailers in November 2021 (Walmart, 2021). Figure 1 presents an example of the two versions of the choice experiment that were presented to respondents.

Figure 1. Choice experiment.
The second choice version utilized the same organic certification label attributes and production scale attributes as the first choice version. In this version, respondents were asked to select between two products that differed in attributes and prices across a total of six choice scenarios. The first two scenarios presented a 12 lb. turkey, followed by two scenarios featuring 5 lb. of potatoes, and the last two scenarios highlighting 32 oz. of cranberry sauce. Unlike the first choice version, the individual products were the focus rather than a combined basket. Prices for the goods were gathered from online retailers in November 2021 (Walmart, 2021), with the overall average for a 12 lb. turkey being $11.40 ($0.95/lb.), the average for 5 lb. of potatoes being $4.00 ($0.80/lb.), and the average for 32 oz. of cranberry sauce being $3.15 ($0.098/oz.). Price levels used in the choice experiments were established at 5 and 15% above and below these average observed prices.
WTP studies are based on stated preferences, and as such, there is potential for hypothetical bias in the WTP estimates. To address this concern, a cheap talk section was included before the choice scenarios. This section described the products needed for an 8-person Thanksgiving dinner and explained the different attributes and levels presented in the Thanksgiving-themed products and basket. Respondents were also asked to make choices as if they were in a regular shopping location. Using this cheap talk approach before the choice experiments helps make consumers aware of the attributes of the products and encourages them not to exaggerate their WTP values in a hypothetical scenario, thus aligning the responses more closely with a real-life setting (Gschwandtner et al., Reference Gschwandtner, Jang and McManus2020; Loomis, Reference Loomis2014; Van Loo et al., Reference Van Loo, Caputo, Nayga, Meullenet and Ricke2011). Moreover, studies have shown that the use of cheap talk before choice experiments can significantly decrease the estimated premium values, resulting in more reliable estimates (Carlsson et al., Reference Carlsson, Frykblom and Lagerkvist2005; Tonsor and Shupp, Reference Tonsor and Shupp2011).
The design of the experimental questions for the survey was created using SAS 9.4 software. With the combination of all the attributes and levels for the two versions, it resulted in 40 (5 × 2 × 4) possible product profiles, leading to C 40 2= 780 possible choice scenarios, where C n r signifies the number of unobserved combinations of n objects taken r at a time (Wackerly et al., Reference Wackerly, Mendenhall and Scheaffer2014). A fractional factorial design selection was utilized to create 10 possible choice scenarios for all products and the basket that maximized determinant efficiency or D-efficiency, a measure of how well the design distinguishes between different potential models. The D-efficiency for this design was 6.5447, with a Relative D-efficiency of 65.4468, and a D-error of 0.1528, representing the precision of the estimators. The scenarios were then divided into five different versions of the questionnaire, or blocks, to make the survey more manageable for respondents. This approach ensures that the most essential information is captured while minimizing the complexity and time required for each participant to complete the survey.
2.2. Statistical analysis and estimation procedures
The econometric models in this study are based on Lancaster’s (Reference Lancaster1966) demand theory of product characteristics or attributes, as well as the random utility model (McFadden, Reference McFadden1973). These models assume that consumers prefer specific product attributes or characteristics rather than the stated product itself. Furthermore, consumers are assumed to select products with attributes or characteristics that maximize their utility, subject to budget constraints. The attributes of interest in this study are organic certification labels and production scale. We employ the following random utility model for the analysis, consistent with Lancaster’s demand model, and subject to utility maximization within budget constraints (Train and Weeks, Reference Train and Weeks2005).
Two popular models for this task, the mixed logit model and latent class model, have unique benefits and drawbacks, making it difficult to definitively favor one over the other (Greene and Hensher, Reference Greene and Hensher2003). The latent class model segments individuals into discrete classes with similar preferences, while the mixed logit model assumes a continuous distribution of preferences, capturing individual-level variations. We chose the mixed logit model for its flexibility in analyzing the impact of sociodemographic factors on WTP values. This choice allows for more nuanced substitution patterns and avoids the potential pitfalls of arbitrary segmentation. Unlike the latent class model, which would require estimating multiple parameters for each product, the mixed logit model provides a two-step evaluation yielding more intuitive results. This approach better accommodates unobserved individual heterogeneity, fitting our needs for this specific research where the pattern of such heterogeneity is unknown.
A consumer’s indirect utility function depends on product characteristics (non-price attributes) and prices. For consumer i choosing between j alternatives in choice scenario t, the utility of choice j is given by:
 $$ U_{ijt}=V_{ijt}+e_{ijt} $$
where i = 1, …, I; j = 1, …, J; t = 1, …, T. V ijt is the measurable utility of the observable product price and non-price attributes e int represents the effects of the unobserved factors on utility not included on V ijt .
Let V ijt be a linear function of the price p ijt and non-price attributes X ijt , equation (1) can be rewritten as:
 $$U_{int}=-\alpha_{i}p_{ijt}+{\boldsymbol\beta}_{i}^{\prime}{X}_{ijt}+e_{ijt}$$
where a i and β i ′ represent the parameters corresponding to the price and non-price attributes, respectively, for consumer i. We assume e ijt to have an i.i.d. extreme value distribution, the probability of a consumer i to select alternative j in choice scenario t, conditional on the coefficient vector θ i = [γ i W i ′], is (Revelt and Train, Reference Revelt and Train1998):
 $$ P_{ijt}\left(\theta _{i}\right)={e^{{\boldsymbol{V}_{ijt}}\left(\boldsymbol{\theta }_{\boldsymbol{i}}\right)} \over \sum _{j}e^{{V_{ijt}}\left(\theta _{i}\right)}}$$
where V ijt ( θ i ) = − γ i p ijt + (γ i W i )′ X ijt . Also, conditional on θ i , the probability for consumer i’s observed sequence of T choices is expressed as (Train, Reference Train1998):
 $$ R_{i}\left(\boldsymbol{\theta }_{\boldsymbol{i}}\right)=\prod _{t}P_{ij\left(i,t\right)t}\left(\boldsymbol{\theta }_{\boldsymbol{i}}\right)$$
where j(i,t) denotes the specific product alternatives j that consumer i selects in choice situation t. The coefficient vector
θ
i
is unobserved for all consumers iand varies in the population with density $f(\boldsymbol{\theta }|{{\bf \Gamma})}d\boldsymbol{\theta }_{\boldsymbol{i}}$
where
$f(\boldsymbol{\theta }|{{\bf \Gamma})}d\boldsymbol{\theta }_{\boldsymbol{i}}$
where ${\bf \Gamma\ }$
are the parameters of the distribution. Therefore, the unconditional probability of the observed sequence of choices (the mixed logit probability) is expressed as:
${\bf \Gamma\ }$
are the parameters of the distribution. Therefore, the unconditional probability of the observed sequence of choices (the mixed logit probability) is expressed as:
 $$ P_{i}\left({\bf \Gamma\ }\right)=\int R\left(\boldsymbol{\theta }_{\boldsymbol{i}}\right)f_{i}\left(\boldsymbol{\theta }_{\boldsymbol{i}}|{\bf \Gamma}\right)d\boldsymbol{\theta }_{\boldsymbol{i}}$$
The log-likelihood function for all i consumers is as follows:
 $$ LL\left({\bf \Gamma}\right)=\sum _{i}\ln P_{i}\left({\bf \Gamma}\right)$$
The estimation of the parameter ${\bf \Gamma}$
is carried out using simulated maximum likelihood procedures in Stata software (Rigby and Burton, Reference Rigby and Burton2006; StataCorp, 2019; Train, Reference Train1998). Regarding the distribution of the coefficients in
θ
i
, the price coefficient was specified as lognormal, with a standard deviation constrained to 0, and all non-price attributes were assumed to be normally distributed (Carson and Czajkowski, Reference Carson and Czajkowski2019) to obtain a well-defined distribution of the WTP values for the non-price attributes (i.e., with finite second moments). As shown in Carson and Czajkowski (Reference Carson and Czajkowski2019), we use the ratio of the non-price attribute’s mean coefficient (
${\bf \Gamma}$
is carried out using simulated maximum likelihood procedures in Stata software (Rigby and Burton, Reference Rigby and Burton2006; StataCorp, 2019; Train, Reference Train1998). Regarding the distribution of the coefficients in
θ
i
, the price coefficient was specified as lognormal, with a standard deviation constrained to 0, and all non-price attributes were assumed to be normally distributed (Carson and Czajkowski, Reference Carson and Czajkowski2019) to obtain a well-defined distribution of the WTP values for the non-price attributes (i.e., with finite second moments). As shown in Carson and Czajkowski (Reference Carson and Czajkowski2019), we use the ratio of the non-price attribute’s mean coefficient ( ${\hat{{\beta}_i}}$
) and the natural exponential function of the estimated price coefficient, WTP =
${\hat{{\beta}_i}}$
) and the natural exponential function of the estimated price coefficient, WTP = ${\hat{{\beta}_i}}$
/exp (
${\hat{{\beta}_i}}$
/exp ( ${\hat{\alpha}_i}$
).
${\hat{\alpha}_i}$
).
2.3. Factors affecting the WTP for attributes
The relationship between consumers’ WTP values for the non-price attributes (organic certification labels and production scale) was analyzed using a two-step approach (Castillo and Carpio, Reference Castillo and Carpio2019). In the first step, we calculated the estimated WTP values for the organic certification label attributes and the production scale attribute. In the second step, we employed a regression model to analyze the association between WTP and consumer sociodemographic characteristics. The estimation of consumers’ WTP values relies on the application of Bayes’s rule. Since the density of each θ i is conditional on the individual’s sequence of choices and the population parameters, it can be written as follows (Hess, Reference Hess2007; Revelt and Train, Reference Revelt and Train1998):
 $$ g\left(\boldsymbol{\theta }_{i}|{\bf \Gamma\ }\right)={R_{i}\left(\boldsymbol{\theta }_{i}\right)f\left(\boldsymbol{\theta }_{i}|{\bf \Gamma}\right) \over P_{i}\left({\bf \Gamma}\right)}$$
expected value of θ i is given by:
 $$ E\left(\boldsymbol{\theta }_{i}|{\bf \Gamma\ }\right)=\int {\boldsymbol{\theta} }_{i}g\left(\boldsymbol{\theta }_{i}|{\bf \Gamma}\right)$$
And the simulated approach to the individual vector of values for the attributed is expressed as (Train, Reference Train2000):
 $$ \hat{E}\left(\boldsymbol{\theta }_{i}|{\bf \Gamma}\right)={\sum _{j}{\boldsymbol{\theta} }^{s}R_{i}\left({\boldsymbol{\theta}}^{\boldsymbol{s}}\right) \over \sum _{j}R_{i}\left(\boldsymbol{\theta }^{s}\right)}$$
where
θ
s
corresponds to the sth draw from the population density $f(\boldsymbol{\theta }_{i}|{\bf \Gamma})$
, and R
i
(
θ
s
) is the probability of individual i’s sequence of choices. The estimated parameters
$f(\boldsymbol{\theta }_{i}|{\bf \Gamma})$
, and R
i
(
θ
s
) is the probability of individual i’s sequence of choices. The estimated parameters $\hat{{\bf \Gamma}}$
were used instead of the parameters
$\hat{{\bf \Gamma}}$
were used instead of the parameters ${\bf \Gamma}$
(Hess, Reference Hess2007). The stability of the estimated
${\bf \Gamma}$
(Hess, Reference Hess2007). The stability of the estimated $\hat{E}(\boldsymbol{\theta }_{i}|{\bf \Gamma})$
values were verified, and the empirical results were calculated using various sizes for the number of sample draws (1,000 draws).
$\hat{E}(\boldsymbol{\theta }_{i}|{\bf \Gamma})$
values were verified, and the empirical results were calculated using various sizes for the number of sample draws (1,000 draws).
The second step is using random effects regression model for the non-price attributes (Campbell, Reference Campbell2007):
 $$ WTP_{ia}=n_{a}+{\boldsymbol{z}_{\boldsymbol{i}}^{\boldsymbol{'}}\boldsymbol{b}}+u_{k}+e_{ia}$$
where, WTP ia is the ith respondent’s WTP attribute a (i.e., a = USDA Organic certification label, CNG, CCOF, organic claim, small producers), n a and b are coefficients, Z i is a vector of respondent-related characteristics, u k is a consumer-specific random error, and e ia is the equation error term. This approach provides estimates of the mean marginal effects of the factors on the WTP values for a group of attributes (Campbell, Reference Campbell2007; Hu et al., Reference Hu, Woods and Bastin2009).
3. Data
The data for this study were collected from an online survey of United States households. Initially, a pilot test was conducted in November 2021 with 100 respondents to assess the quality of the survey instrument. The final survey was then distributed via an online link through Amazon Mechanical Turk (mTurk) from December 2021 to January 2022. The screening criteria for inclusion in the study required respondents to be 18 years of age or older, to be responsible for food purchases within their household, and to have completed all survey questions. After excluding observations that did not meet the screening criteria, a total of 1,562 observations were used for the statistical analysis. This sample represents the United States population with a confidence level of 95% and a margin of sample error of ±2.5% (Fowler Jr. Reference Fowler2014).
3.1. Sociodemographic characteristics
Table 1 details the survey respondents’ sociodemographic characteristics. The results are presented for the whole sample and divided into two subsamples. The first subsample provides information on respondents who completed the choice experiments for the Thanksgiving-themed products, while the second subsample delineates the characteristics of respondents who completed the choice experiment for the basket of Thanksgiving-themed products.
Table 1. Sociodemographic characteristics of the sample and subsamples
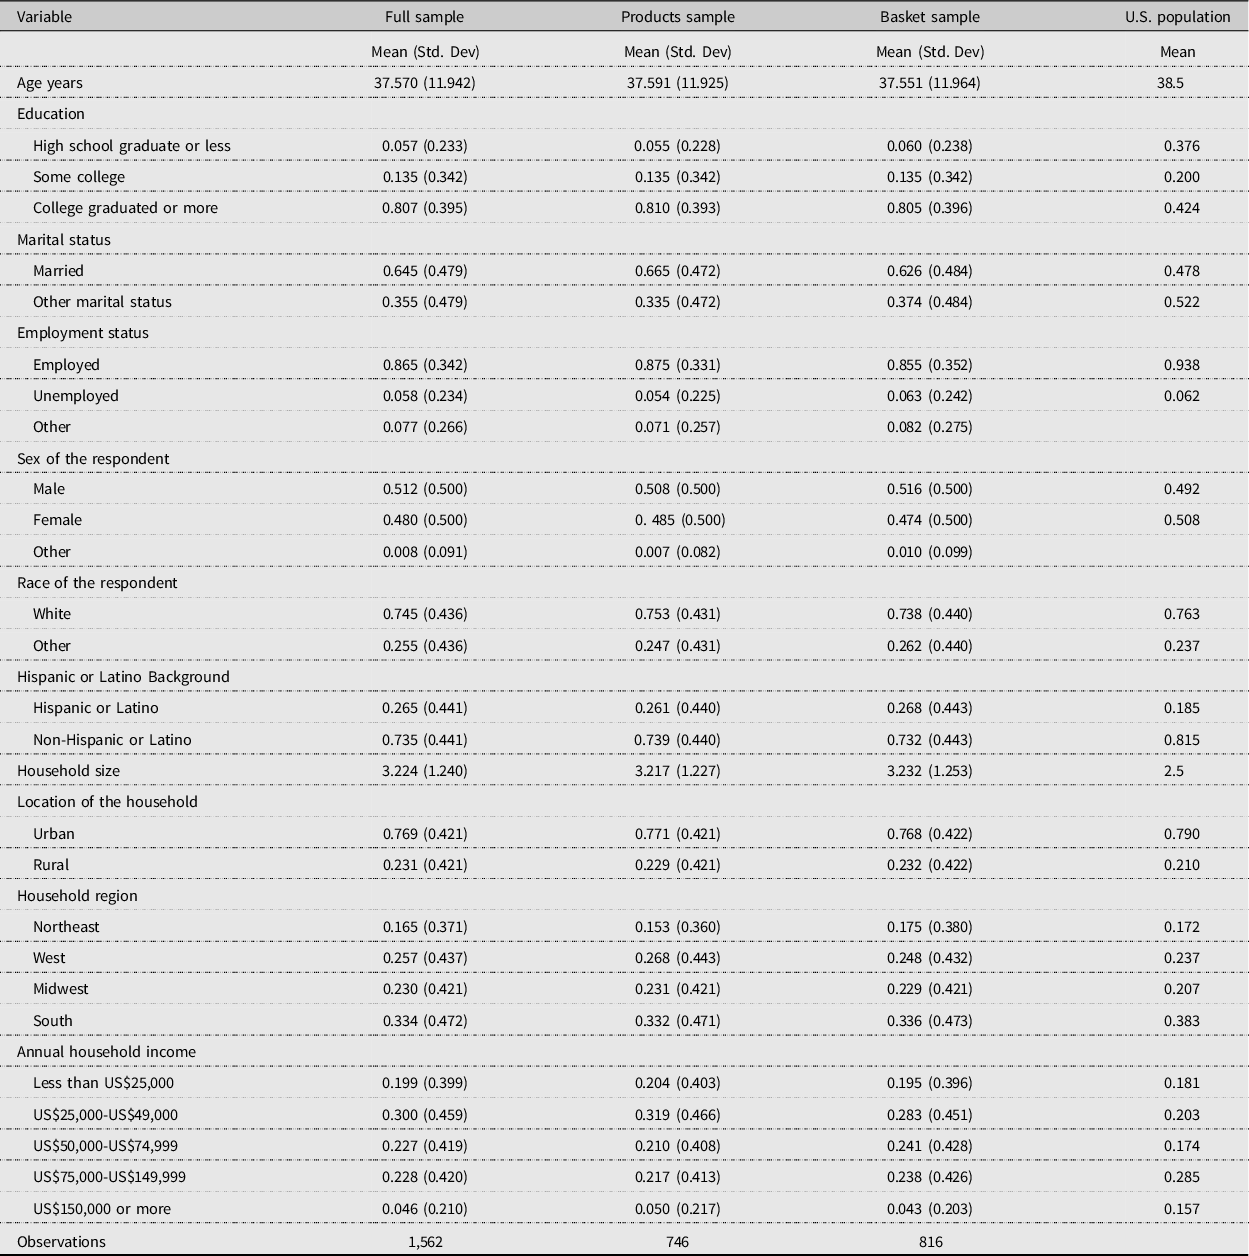
The average age of the respondents was approximately 38 years, and about half of them were male (51%). A significant majority, 81%, reported having a college education, and 86% stated that they were employed. The predominant racial group among the respondents was white (75%). The average household size consisted of about three members, with the majority located in urban areas (77%). These households reported an average annual income in the range of $50,000 to $74,999. Notably, both subsamples were similar in terms of their sociodemographic characteristics.
The demographic characteristics of our sample mostly align with the United States national averages. Specifically, our sample corresponds to the national average age (38), the percentage distribution of males (49%) and females (51%), the proportion of white households (72%), average household size (2.5), and the national average household income range (between $50,000 and $74,999), as reported by the United States Census Bureau. However, our sample deviates slightly from the national average by having a larger share of individuals with a college education (80.7% compared to the national average of 42.4%) and those with a Hispanic or Latino background (26.5% compared to 18.5%) (United States Census Bureau (USCB) 2019; USCB 2021).
3.2. Organic product consumption and perceptions
Respondents were queried about their consumption habits and preferences concerning organic products and certifications. Data on the frequency and importance of consumption were collected using a five-point Likert scale. A significant portion of the respondents indicated that they consume organic products at least once a week (68%). For more than half of the respondents (59%), organic labels proved to be either extremely important or very important. When asked to select the organic products they typically consume, the majority indicated that fruits (75.35%) and vegetables (77.02%) are their most popular organic choices, as shown in Table 2. Animal-based products such as dairy and meat were the next most common selections.
Table 2. Organic product consumption, preferences, and perceptions
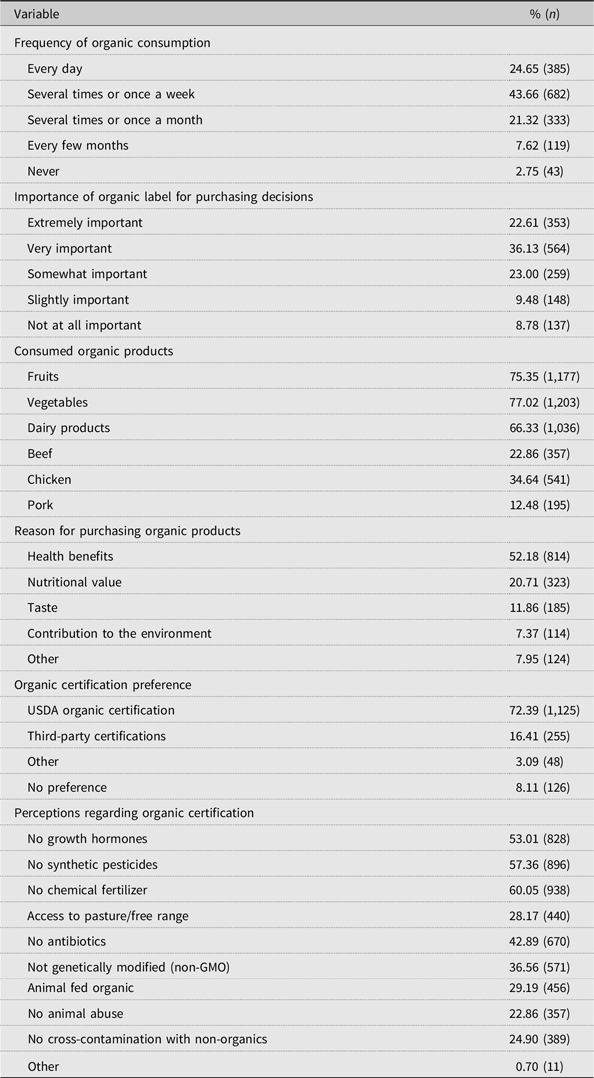
Consistent with the literature discussed earlier, respondents further indicated that the primary reasons for consuming organic products include health benefits (52%), nutritional value (21%), taste (12%), and contribution to the environment (7%). Regarding preferences for organic certifications, 72% of respondents favor the USDA Organic Certification, compared to only 16% who prefer third-party certifications. These results align with those of Ward et al. (Reference Ward, Hunnicutt and Keith2004), who report that consumers perceive products with an organic label as better when credited by a third party or the USDA, rather than self-certified products.
To better understand what respondents believe are the requirements for organic certification, we asked them to identify the necessary standards for a product to be considered organic. Over half of those surveyed recognized specific criteria such as access to pasture or free range (60%), the prohibition of synthetic pesticides (57%), and the absence of growth hormones (53%) as key requirements for organic certification (Table 2). These findings are in alignment with the standards enforced by USDA-accredited certified agents and mirror the regulations set by other certification organizations like CNG and CCOF. These commonly acknowledged standards encompass a range of considerations including access to pasture or free range, the restriction of synthetic pesticides and growth hormones, the use of organic feed, adherence to animal welfare principles, commitment to the conservation of natural resources, and the banning of genetic engineering (USDA, 2023).
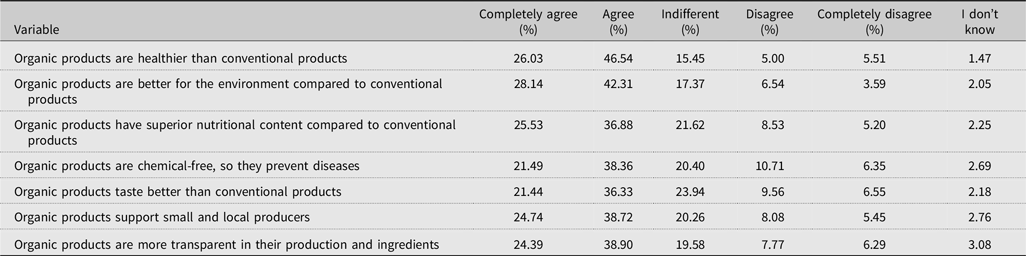
Table 3 reports the perceptions of respondents about organic products. In general, consumers believe that organic products possess superior properties compared to conventional products. More than half of the respondents agree (73%) that organic products are healthier, better for the environment (70%), have superior nutritional content (62%), and taste better (58%) than conventional products. Additionally, most respondents concur that organic products are chemical-free and thus prevent diseases (60%), support small and local producers (63%), and are more transparent about their production and ingredients (63%). These results align with Jolly’s (Reference Jolly1991) findings that 65% of consumers rate organic products as better than conventional products.
Table 3. Perceptions of organic products
3.3. Thanksgiving purchasing behavior
To understand respondents’ consumption behavior for Thanksgiving purchases, we asked, “What are your typical purchasing behaviors for Thanksgiving?” Respondents selected different options to indicate their purchasing behavior, with 16% stating that they did not change their purchasing behavior or did not celebrate Thanksgiving (see Table 4). Of the remaining 84% (or 1,306 respondents) who indicated that they changed their purchasing behavior for the holiday, the most commonly selected reasons were: “I buy more food products than usual” (52%), “I buy more organic products” (44%), and “I buy more high-quality products” (42%) (see Table 4).
Table 4. Thanksgiving purchasing behavior

Additionally, respondents were asked about their budget for a dinner serving eight people. The results showed that most respondents spent less than $200 on Thanksgiving dinner. This calculated average spending is higher than the results from the 36th annual Thanksgiving dinner survey conducted by the American Farm Bureau Federation (AFBF). The AFBF calculated that the average cost of a Thanksgiving dinner for ten people in 2021 was $53.31. However, the AFBF’s results were determined using a smaller sample of 218 respondents, and the data was collected through menu-tracked prices at the store level, rather than using actual purchase data (AFBF, 2021).
4. Results
4.1. Mixed Logit results
The results from the mixed logit model in the preference space are presented in Table 5. The significant and positive coefficients indicate that consumers prefer and are willing to pay for some of the attributes presented in the first column. However, the estimated coefficients related to the mean distributions are assumed to have a lognormal distribution, meaning that they cannot be directly interpreted as effects in the indirect utility function. The estimated coefficients of the mixed logit model in the preference space were used to calculate the mean WTP values for the non-price attributes used in the choice experiment. Most of the standard deviation coefficients were non-statistically significant (p < 0.05), indicating no evidence of heterogeneity in the WTP values for organic and scale production attributes. Furthermore, the Alternative Specific Constant (ASC) coefficient and standard deviation for Models 3 and 4 are not statistically significant (p < 0.05). This result might suggest that respondents have homogeneous preferences regarding potatoes and cranberry sauce. Product attributes in the choice experiment influence the decision-making process more than the unobserved factors captured by the ASC or the “none” option.
Table 5. Mixed logit model estimation results
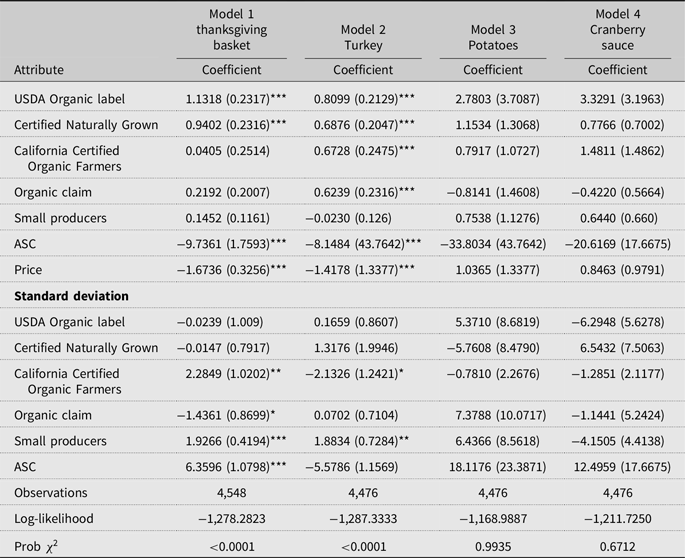
Base attributes: Panel mixed logit model using 500 Halton draws.
Attributes assigned a normal distribution except for price that was designated to follow a lognormal distribution.
No label for organic attribute, and large producers serve as the baseline level.
ASC: “None” option.
*for significance at 10%
** for significance at 5%
*** for significance at 1%
Standard error in parenthesis.
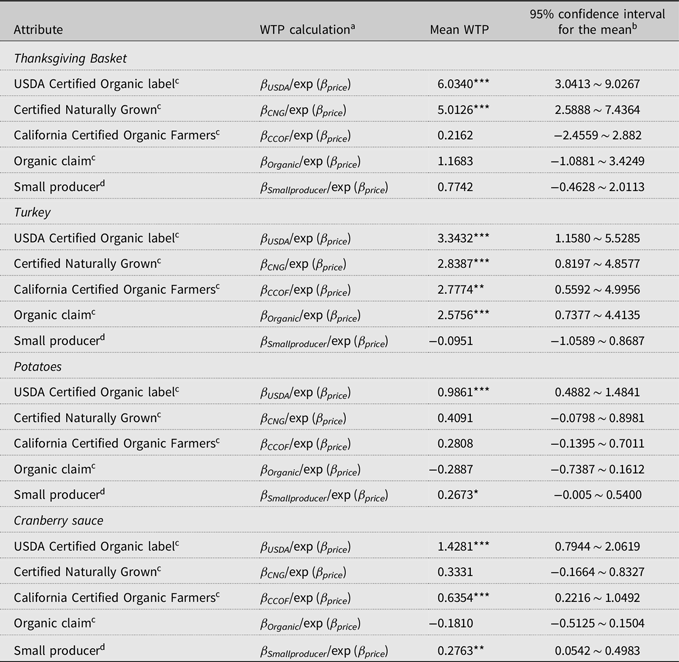
Table 6 presents the estimated mean WTP values obtained from Table 5. These mean WTP values are interpreted as the calculated monetary amounts that consumers are willing to pay for the organic certification and producer attributes in Thanksgiving-themed products. For the purpose of this analysis, the baseline attribute for organic certification labels was defined as “no label,” and for production scale, it was categorized as “large-scale producer.”
Table 6. Marginal effects of Mixed Logit Models
*** indicates significance at 1%.
** indicates significance at 5%.
* indicates significance at 10%.
a Carson and Czajkowski (Reference Carson and Czajkowski2019), when price attribute follows a lognormal distribution and constraining the standard deviation of price to 0 and other variables follow a normal distribution.
b 95% confidence intervals found using Fieller (1954) method.
c No label indicating organic production as the base attribute.
d Large-scale producers as the base attribute.
For the Thanksgiving basket, the results imply that consumers are willing to pay premium values for all organic certification labels and producer scale attributes on average. However, only the USDA Certified Organic label and CNG label have statistically significant WTP values of $6.03 and $5.01 compared to no label, respectively. For a 12 lb. turkey, consumers’ mean WTP was statistically significant for all the organic certification labels. On average, consumers are willing to pay $3.34 for the USDA Certified Organic label, $2.84 for the CNG label, $2.78 for the CCOF label, and $2.57 for the organic claim. There appears to be no statistically significant preference for small producers for turkey. A similar analysis on potatoes indicates that consumers are willing to pay $0.99 for the USDA Certified Organic label and $0.26 for small-scale producers. However, there was no statistically significant WTP for the rest of the attributes. Finally, the attributes that showed statistically significant WTP for cranberry sauce were the USDA Certified Organic label at $1.43, $0.64 for the CCOF, and $0.27 for small-scale producers.
Given the observed market prices for turkey, potatoes, and cranberry sauce at $11.40, $4.00, and $3.14, respectively, the estimated consumers’ premiums suggest a strong preference for Thanksgiving-themed products with certified organic labels. These results are consistent with previous findings that revealed positive premiums for jams, turkey, and potatoes with organic labels (Bir et al., Reference Bir, Widmar, Davis, Erasmus and Zuelly2020; Loureiro and Hine, Reference Loureiro and Hine2002; Meas et al., Reference Meas, Hu, Batte, Woods and Ernst2015).
Moreover, the Thanksgiving-themed basket results might suggest that consumers’ WTP for different product attributes is better captured when the products are presented individually, or there may be unknown factors influencing product selection in the case of the themed basket. For example, the WTP for the CCOF label and small-scale producers on the Thanksgiving-themed basket are not statistically significant, yet there is a significant positive WTP for the CCOF label and small-scale cranberry sauce producers. A study by Hu et al. (Reference Hu, Batte, Woods and Ernst2012) found positive premiums from production scale and organic labels in Blackberry jam. The results indicated that consumers are willing to pay $0.27 for the USDA organic label and $0.09 for the small family farm logo.
4.2. Regression results: What determines the WTP?
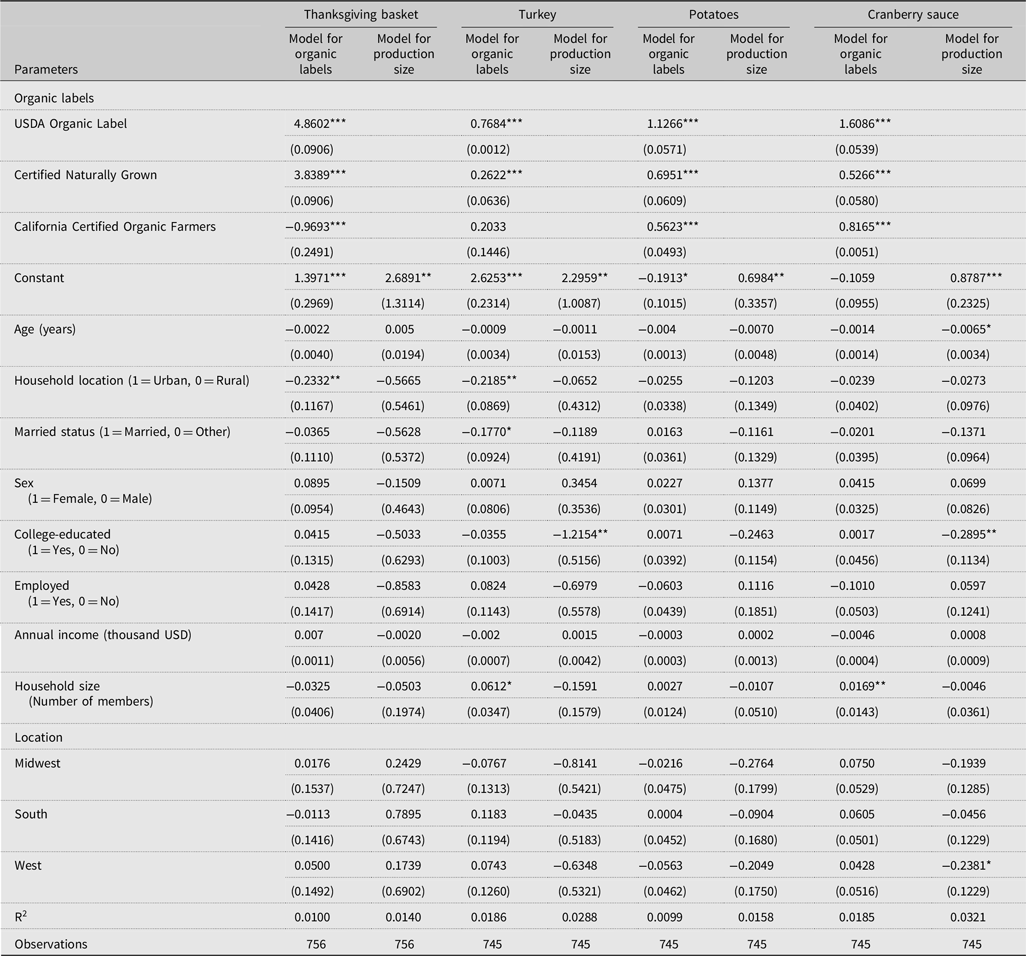
Table 7 presents the regression results, confirming the relationship between the calculated WTP values and the sociodemographic characteristics of the respondents. Two regression models were estimated for each product and the basket. The first regression model, focused on organic attributes, uses the WTP values for organic labels compared to “no label,” using the WTP for an organic claim as a benchmark attribute. In this model, we also included dummy variables for the USDA Certified Organic label, CNG label, and CCOF to differentiate the differences in the WTP. The second regression model, which concentrates on production scale, uses the WTP for small-scale producers as the benchmark attribute. No dummy variables for production scale were included in this model (Table 7) since the calculated WTP value for small-scale production is made in comparison to large-scale producers.
Table 7. Random effects regression model results
Notes. ***indicates significance at 1%, ** indicates significance at 5%, and * indicates significance at 10%. Standard error in parenthesis. Organic claim as base level for organic label attribute.
A statistically significant difference exists in the WTP for organic labels among the different products. The estimated WTP for the USDA Certified Organic label for turkey, potatoes, cranberry sauce, and the Thanksgiving-themed basket are $0.77, $1.13, $1.61, and $4.86, respectively, higher than the WTP for the non-certified organic claim. A slightly lower WTP is found for the CNG label: $3.84 for the Thanksgiving-themed basket, $0.26 for turkey, $0.69 for potatoes, and $0.52 for cranberry sauce. However, there are differences in the effects of the CCOF (California Certified Organic Farmers) label with respect to the organic claim in the products and basket. For example, the CCOF label shows positive and statistically significant WTP for potatoes ($0.56) and cranberry sauce ($0.81). No statistically significant WTP is found for turkey, and there is a negative and statistically significant effect on the WTP for the Thanksgiving-themed basket of $0.97.
For sociodemographic characteristics, statistical significance differs across products. In the case of turkey, respondents from urban locations have a $0.21 lower WTP for organic labels than their rural counterparts. Only two other variables have a significant association with the WTP of organic labels. For example, married status has a $0.18 lower WTP than non-married status, and household size has a $0.06 higher WTP for each additional household member. For potatoes, regression results do not show statistically significant effects of sociodemographic characteristics. In the case of cranberry sauce, household size has a $0.02 higher WTP for organic labels per member. Noticeably, households in urban areas have $0.02 less WTP for the Thanksgiving basket than rural households. The results are somewhat different from the findings of Zhang et al. (Reference Zhang, Huang, Lin and Epperson2008), as the results in Table 7 do not show the positive effects of income on the WTP. We find adverse effects in urban areas, whereas Zhang et al. (Reference Zhang, Huang, Lin and Epperson2008) found a positive effect in urban areas compared to rural areas. Moreover, Dettmann and Dimitri (Reference Dettmann and Dimitri2009) found that income and higher education increase the probability of consuming organic vegetables, contrary to regression results in Table 7 that did not find a statistically significant effect of income or education on the WTP values. A possible explanation is that organic consumption during family holidays like Thanksgiving became more common across income and education groups in 2021 than in 2008. Another explanation is that urban and more educated consumers emphasize celebrating Thanksgiving and following the traditional menu less.
The second set of regressions in Table 7 excludes organic labeling variables and includes production scale variables. There is no statistically significant sociodemographic effect on the WTP for the Thanksgiving-themed basket and potatoes. However, consumers with college degrees have $1.21 less WTP for turkey as opposed to consumers with no college education. College-educated consumers have $0.29 less WTP for cranberry sauce based on production size. In addition, the age variable correlates with a slightly lower WTP for production size. For every additional year in a consumer’s age, the WTP for production size decreases by $0.01; and a consumer located in the West region of the United States is willing to pay $0.24 less compared with a consumer located in the Northwest region of the United States.
5. Concluding remarks
This study evaluates consumption patterns and perceptions of organic products and assesses consumer valuations and their determinants for organic food items usually consumed more during Thanksgiving. Using an online survey conducted in November 2021, we found that 68% of respondents consume organic products every day, several times, or once a week, and the most consumed organic products are fruits, vegetables, and dairy products. Consistent with the literature, the USDA organic certification is the most preferred organic certification, and the top reason for consuming organic products is health benefits. At least six out of 10 respondents perceive organic products as healthier, better for the environment, having superior nutritional content, and tasting better than conventional products.
Our main contribution, however, is to unravel how consumer valuations for these food items change during Thanksgiving. About 84% of respondents indicate changes in their food consumption, buying more products than usual, and more high-quality and organic products. Results from the choice experiments reveal a strong preference and WTP for organic certification labels instead of no labels. It is important to consider the broader context of organic production and certification. Organic certification is a costly and time-consuming process for producers, given the strict guidelines and standards set by regulatory authorities. The additional cost of organic production varies by crop and livestock type, and it is estimated to be about 10 to 20% higher than conventional production cost (Carlson et al., Reference Carlson, Greene, Skorbiansky, Hitaj, Ha, Cavigelli, Ferrier and McBride2023). Despite these higher costs, organic products often receive price premiums throughout the year, providing financial incentives that make organic production a viable strategy. It is estimated that organic production can become more profitable within a 3-year period (Carlson et al., Reference Carlson, Greene, Skorbiansky, Hitaj, Ha, Cavigelli, Ferrier and McBride2023). In North America, the number of hectares devoted to organic farming has grown from 1.06 million in 2000 to about 3.5 million in 2021 (Willer et al., Reference Willer, Schlatter and Trávníček2023). Results demonstrating consumer preferences for organic Thanksgiving-themed products and WTP during the holiday season do not necessarily imply that organic production should focus on a specific timeframe. Instead, our findings suggest that seasonal demand may present an opportunity for increased production and sales.
It was also discovered that consumers’ preferences and greater WTP for organic certification and producer’s size are more discernible and measurable when Thanksgiving-themed items are presented individually. Additionally, the results from the regression analysis identified a few statistically significant consumer sociodemographic characteristics, such as college education or household location, that affect WTP values for organic certified labels and production scale; these varied from product to product. The study provided evidence that organic certification labels influence consumer preferences, as reflected in the choices made in hypothetical experiments.
There are no uniform standards for what qualifies as “locally produced,” and the definition varies from one state to another, ranging from products produced within state boundaries to those within a certain distance from the shopping location (Yost, Reference Yost2022). However, the USDA defines small farm operations as farms with a gross cash farm income under $250,000 (USDA, 2010). Apart from cranberry sauce, we did not find a statistically significant WTP for small-scale producers. Cranberry sauce was the only processed food product in the experiment. This finding, along with the literature discussed above (Hu et al., Reference Hu, Batte, Woods and Ernst2012), may suggest that small farm operations can utilize the scale attribute as a marketing tool in processed food products. Small-scale producers could capitalize on other berry-derived products like sauces or jams, as they may be perceived as products where the production scale holds value concerning factors such as taste, quality, or sustainability.
From a policy perspective, our study also highlights that the most accepted among all organic certification labels is the USDA Organic Certification, a distinction that can be difficult and expensive to obtain, especially for small farmers who have not achieved economies of scale. We found that the preference for other certifications like CNG and COOF is heterogeneous across products and consumers. To maximize the benefits of organic certification and foster the growth of the organic industry, policymakers, in collaboration with stakeholders, may take initiatives that enhance consumer knowledge and awareness of the organic standards as well as facilitate access to organic certification for producers of various scales. Such collaboration would reduce the heterogeneity among consumers regarding organic products and make organic standards more consistent across the industry.
Our future research will explore how small farmers and producers might benefit from cost reduction and facilitation in the organic certification process, potentially through government or retailer support, to boost organic production in anticipation of Thanksgiving or similar periods of seasonal demand increase.
Data availability statement
The data that support the findings of this study are available on request from the corresponding author, MDA. The data are not publicly available due to containing information that could compromise the privacy of research participants.
Author contribution
Conceptualization, O.S., and M.D.A.; Methodology, O.S., and M.D.A; Formal Analysis, O.S., and M.D.A.; Data Curation, O.S.; Writing – Original Draft, O.S., and M.D.A., Writing – Review and Editing, O.S., and M.D.A.; Supervision, M.D.A.; Funding Acquisition, O.S., and M.D.A.
Financial support
This research received no specific grant from any funding agency, commercial or not-for-profit sectors.
Competing interests
Oscar Sarasty and Modhurima Dey Amin declare none.


 Open access