


Introduction
Goat meat is consumed in many Asian, African, and Latin American countries (Dubeuf, Morand-Fehr, and Rubino, Reference Dubeuf, Morand-Fehr and Rubino2004; Lohani and Bhandari, Reference Lohani and Bhandari2018), and for many Asian and African subsistence farmers, it is a vital source of income (Singh et al., Reference Singh, Dixit, Roy and Singh2013). While China is the largest producer, Australia is the largest exporter of goat meat (FAOSTAT, 2022).
Per pound, goat meat has fewer calories, less saturated fat, less cholesterol, and more protein than beef, pork, lamb, and chicken (USDA ARS, 2019; Ivanović, Pavlović, and Pisinov, Reference Ivanović, Pavlović and Pisinov2016; Mazhangara et al., Reference Mazhangara, Chivandi, Mupangwa and Muchenje2019). Its production uses less water, emits less greenhouse gas per pound than beef (Mekonnen and Hoekstra, Reference Mekonnen and Hoekstra2010; Poore and Nemecek, Reference Poore and Nemecek2018), and has emissions comparable to pork and lamb. Goats can survive on brush-like vegetation and weeds, supplying brush control in marginal lands, and adapt easily to diverse climates (Hart, Merkel, and Gipson, Reference Hart, Merkel, Gipson, Hart, Merkel and Gipson2018; Mahmoud, Reference Mahmoud2010; Schweihofer, Reference Schweihofer2011). Thus, goat meat is healthier than other meats and environmentally friendlier than beef.
Nevertheless, goat meat has only niche market status in the United States, with under a pound of goat meat consumed per capita. Goat meat costs more in the United States than other meats, mainly due to the high production costs and inefficient marketing channels (Gillespie, Nyaupane, and McMillin, Reference Gillespie, Nyaupane and McMillin2013; Nyaupane, Gillespie, and McMillin, Reference Nyaupane, Gillespie and McMillin2016). The gamey flavor of goat meat reportedly contributes to the lower demand (Jacques and Norwood, Reference Jacques and Norwood2017). However, with the growing foreign-born population, goat meat consumption in the United States is steadily increasing (Ibrahim et al., Reference Ibrahim, Onyango, Pattanaik and Liu2018). Imported goat meat fulfills much of the U.S. demand. According to the United States Department of Agriculture (USDA), in 2021, the United States imported over 99 million pounds of goat meat, reflecting a threefold increase in imports since 2014 (USDA ERS, 2022).
Among problems in the U.S. goat industry, the lack of a proper grading system is a significant marketing challengeFootnote 1 (Gillespie, Nyaupane, and McMillin, Reference Gillespie, Nyaupane and McMillin2013). It constrains producers from producing goats with traits that can command higher prices, ultimately affecting profitability. Some studies report producers tend to overestimate the value of desirable attributes (Gillespie, Nyaupane, and McMillin, Reference Gillespie, Nyaupane and McMillin2015). Research identifying attributes that could command higher prices is necessary to address this gap. Therefore, we use a hedonic price model to analyze slaughter goat auction data for all major U.S. auction markets.
Although literature on the economics of meat goats is sparse, it is growing along with the interest in goats. Among notable studiesFootnote 2 : Ekanem et al. (Reference Ekanem, Mafuyai-Ekanem, Tagegne, Singh and Favors2013), who surveyed U.S. consumers to determine factors affecting demand for goat meat, found the growing immigrant population important to this demand. Jacques and Norwood (Reference Jacques and Norwood2017) used a blind sensory experiment to show favorable goat meat ratings. Gillespie, Nyaupane, and McMillin (Reference Gillespie, Nyaupane and McMillin2013) surveyed goat producers to identify production problems and challenges. Nyaupane, Gillespie, and McMillin (Reference Nyaupane, Gillespie and McMillin2016) found that direct-to-consumer and live auctions are the most common marketing channels and that Easter is the preferable time to sell goats. More relevant to our work, Thompson, Hogan, and Waldron (Reference Thompson, Hogan and Waldron2016) used San Angelo, Texas, auction data to study factors affecting the price of meat goats. Their findings suggest a seasonality in meat goat prices and that goats weighing 50–60 pounds and a lot size of 35 animals command the highest price per pound. However, this study did not include other attributes of meat goats and used data from only one auction market. Existing studies on the U.S. meat goat market have few observations, cover small geographical areas, and include few auction markets.
In contrast, this study includes three years of comprehensive data (from 2019 to 2021) from 55 auction markets in 16 meat-goat-producing states. We analyze five animal characteristics by controlling several fixed effect factors and the effect of the foreign-born population. This paper, therefore, is the first to comprehensively study the marketable attributes of meat goats by employing extensive U.S. auction data with wide geographical coverage.
Status of meat goats in the United States
In the United States, goats were traditionally raised for milk and fiber (Angora breeds) and eventually culled for meat (Hart, Merkel, and Gipson, Reference Hart, Merkel, Gipson, Hart, Merkel and Gipson2018). After the South African goat breed Boer was introduced in 1993, meat goat production accelerated (Greenberg, Reference Greenberg2016; Hart, Merkel, and Gipson, Reference Hart, Merkel, Gipson, Hart, Merkel and Gipson2018) due to their more efficient feed-to-meat conversion and faster growth than other goat breeds (Sheridan, Ferreira, and Hoffman, Reference Sheridan, Ferreira and Hoffman2003).
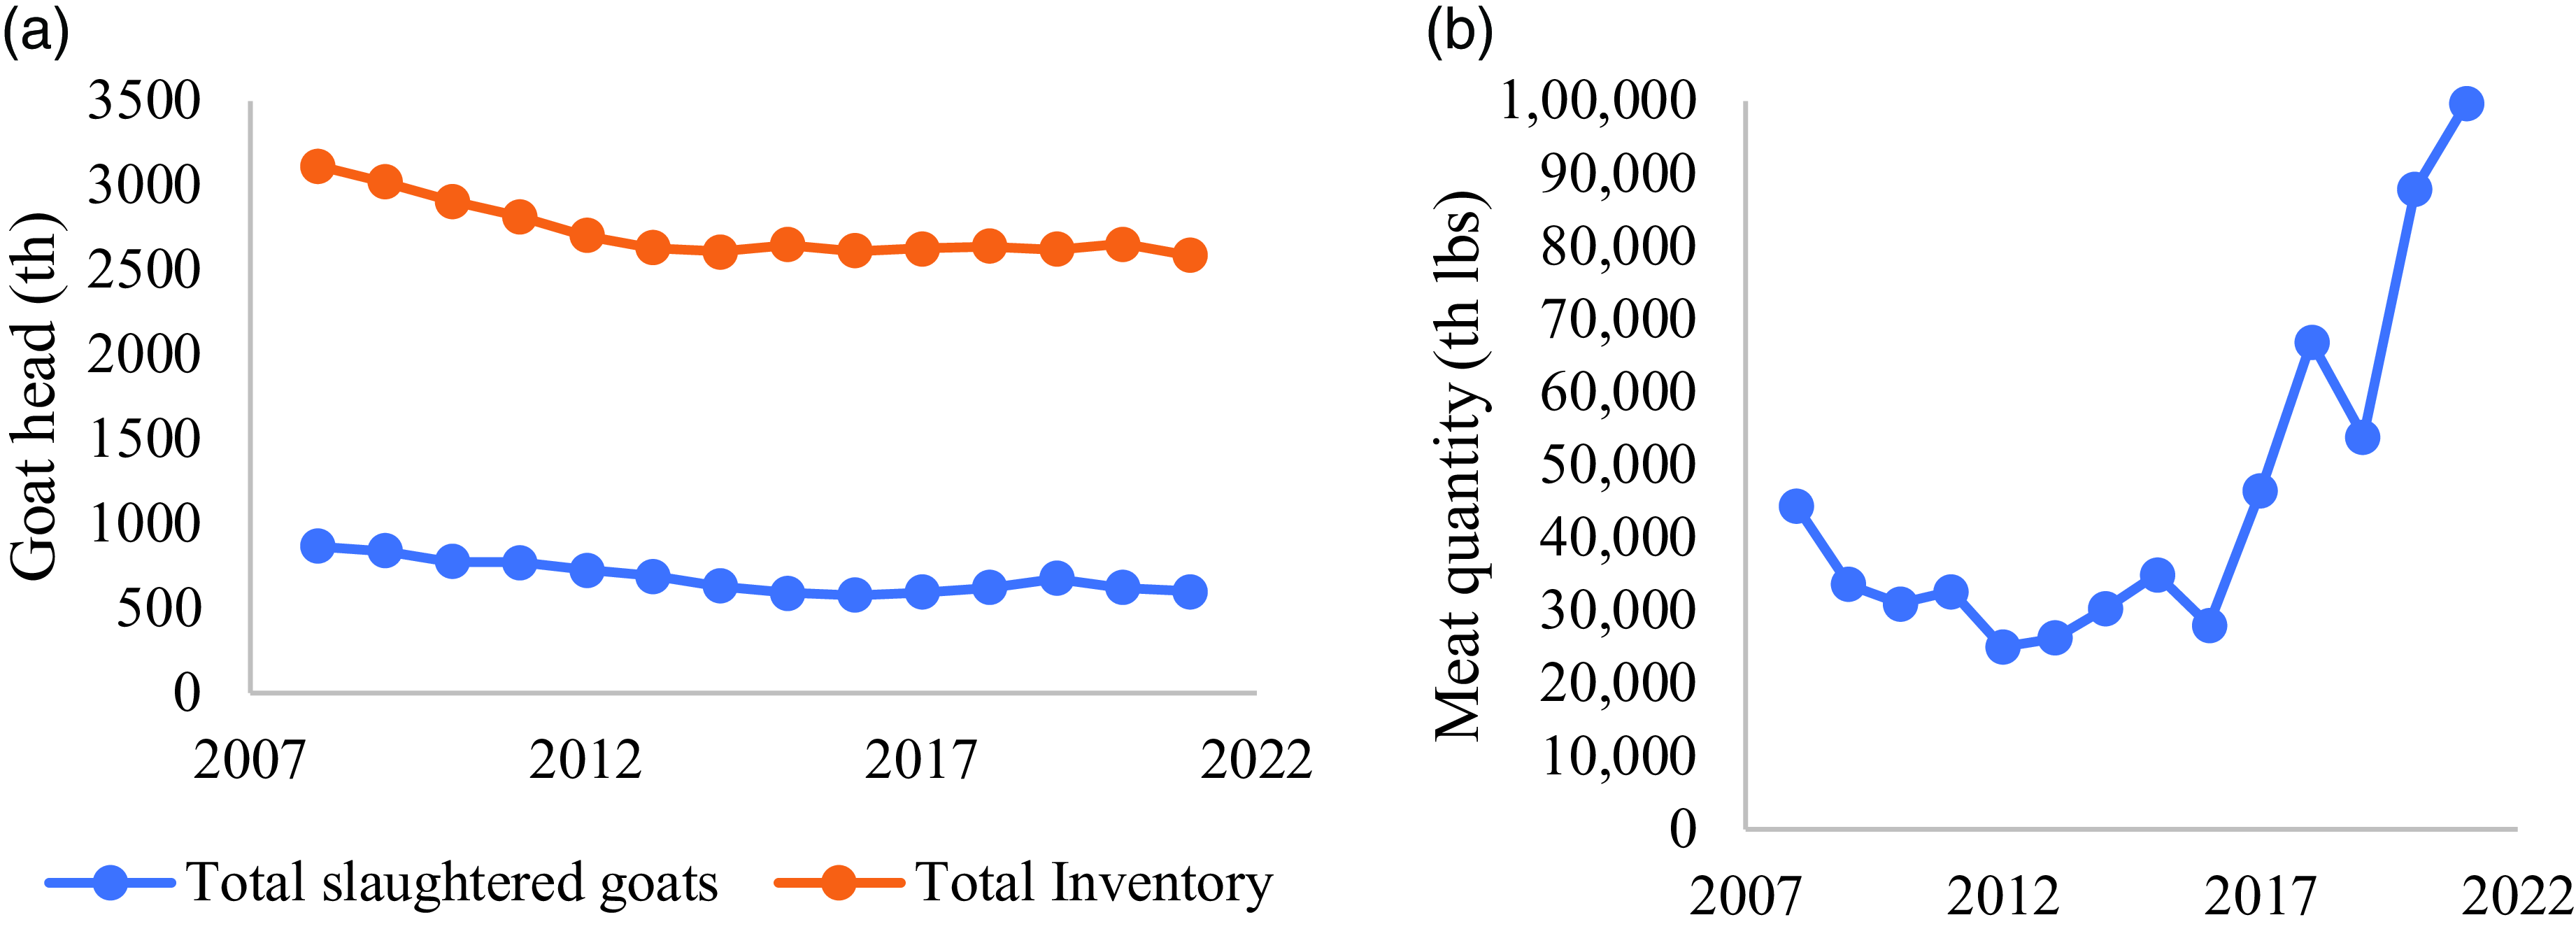
U.S. goat inventory (meat, dairy, and fiber) has shrunk significantly in recent years (Figure 1, Panel a). Over the last ten years, it decreased by over 10%, from 2.4 million in 2010 to 2.1 million in 2020. The number of meat goats slaughtered declined from 865,000 head in 2008 to 577,000 head in 2016 and has been growing slowly since then, reaching 600,000 head in 2021.Footnote 3 However, the demand for goat meat is increasing. The per capita consumption more than doubled, from about 0.15 lb in 2010 to about 0.35 lb in 2021. The increasing gap between the demand and supply has made the United States a net importer of goat meat for over two decades (Luginbuhl, Reference Luginbuhl2015). Imports increased dramatically after 2016 (Figure 1, Panel b). Shifts in preference, the increasing population, and growing immigration may have contributed to this increase. In the future, an increased foreign-born U.S. population and the U.S.-born population’s exposure to information about the benefits of goat meat could further increase demand.
Slaughter goat auction markets
Goat auctions are among the main marketing outlets for meat goats in the United States (Gillespie et al., Reference Gillespie, Nyaupane, McMillin and Harrison2014; Nyaupane, Gillespie, and McMillin, Reference Nyaupane, Gillespie and McMillin2016), with about 50% of meat goats marketed through them (Table 1A; USDA NASS, 2022). Goat auctions connect producers, wholesalers, and consumers (Figure 2). Many local producers and small traders use auction markets to market their goats.

Figure 2. Marketing channels for live goats and goat meat.
Source: Adopted and revised from PVAMU (2018).
Goats are marketed in auctions in groups or lots, ranging from one goat to hundreds of goats. Lots help to maintain homogenous attributes among the goats. For instance, a lot consists of animals of the same maturity and gender.
Goat lots are categorized based on the class (bucks, kids, nannies/does, wether, and wether-kids), dressing quality (high, average, and low), and selection (select 1, select 12, select 2, select 23, and select 3). The quality attributes are described below, based on the USDA guidelines (USDA AMS, 2021).
Class
Class indicates the age and gender of goats (USDA AMS, 2021). There are six broad categories: bucks, kids, nannies, yearlings, wether, and wether-kids. Bucks are uncastrated males over 12 months and have tougher, less juicy, strong-flavored meat. Kids (female or uncastrated male) are under 12 months. Kids’ meat is desirable because of its tenderness and juiciness. Nannies (female goats over 12 months) are less desirable because of the tough meat. Yearlings are goats of either gender that are between 12 and 24 months. Since the yearlings can be both bucks and nannies, they are not used in this analysis. Wethers (castrated male goats) are castrated to hasten their growth and increase meat quality. Young wether (castrated) goats are more desirable because the meat quality decreases with increasing age.
Dressing
The three dressing categories (high, average, and low) are based on the live animals’ appearance before being sold. Goats with a superior dressing percentage have a higher muscle-to-bone ratio.
Selection
Selection refers to the muscularity and conformity of the body to that of the ideal goat for that breed (USDA AMS, 2021). Select 1 indicates a thick sirloin and shoulder muscle, regardless of fat cover. Select 2 denotes average meat-type conformation (moderately muscled throughout the body). Select 3 goats have an inferior meat-type conformation with a sunken and angular appearance. There are also two intermediate categories: select 12 (with the muscularity between selects 1 and 2) and select 23 (between 2 and 3).
Modeling framework and empirical model
We use a hedonic pricing model in this study. Such models are widely used in the valuation of attributes of differentiated products in markets for food (Chang, Lusk, and Norwood, Reference Chang, Lusk and Norwood2010), housing (Coulson and Zabel, Reference Coulson and Zabel2013), and vehicles (Matas and Raymond, Reference Matas and Raymond2009). This model assumes that a product is a combination of several attributes. For example, meat goats can be seen as a combination of weight, age, selection type, dressing quality, etc. The earlier form of the hedonic model was used first by Waugh (Reference Waugh1928) in asparagus and then by Court (Reference Court1939) in automobiles. The model was improved by Lancaster (Reference Lancaster1966) and Rosen (Reference Rosen1974) and is still used extensively. The hedonic model has been used to determine factors affecting beef cattle prices (Martinez et al., Reference Martinez, Boyer and Burdine2021; Mintert et al., Reference Mintert, Blair, Schroeder and Brazle1990; Troxel et al., Reference Troxel, Gadberry, Cline, Foley, Ford, Urell and Widower2002; Williams et al., Reference Williams, Raper, Devuyst, Peel and Mckinney2012).
Among various functional forms of Hedonic price models, the linear and log-linear models generally perform best, with lower mean percentage error (Borchers, Ifft, and Kuethe, Reference Borchers, Ifft and Kuethe2014; Cropper, Deck, and McConnell, Reference Cropper, Deck and McConnell1988) than complex model forms. Thus, many recent hedonic models use linear or log-linear hedonic specifications (Borchers and Duke, Reference Borchers and Duke2012; Martinez et al., Reference Martinez, Boyer and Burdine2021). Further, if the pricing data vary spatially, using spatial fixed effects in the hedonic model addresses the potential bias from time-invariant omitted variables (Borchers, Ifft, and Kuethe, Reference Borchers, Ifft and Kuethe2014; Kuminoff, Parmeter, and Pope, Reference Kuminoff, Parmeter and Pope2010).
The log-linear empirical model that we use in this study is as follows:
 $$\begin{align*}LnAv. {Price}_{iat}&=\alpha _{0}++\alpha _{1}Av. {Weight}_{iat}+\alpha _{2}Av. {Weight}\ {squared}_{iat}+\alpha _{3}Head/lot_{iat}\\
&\quad+\,\alpha _{4}{Dress}\ High_{iat}+\alpha _{5}{Dress}\ {aveage}_{iat}+\alpha _{6}{Select}\ 1_{iat}+\alpha _{7}{Select}\ 12_{iat}\\
&\quad+\,\alpha _{8}{Select}\ 2_{iat}+\alpha _{9}{Select}\ 23_{iat}+\alpha _{10}{Bucks}_{iat}+\alpha _{11}Kids_{iat}+\alpha _{12}{Wetherkids}_{iat}\\
&\quad +\, \alpha _{13}{Wetheres}_{iat}+\alpha _{14}{Trend}_{t}+\alpha _{15}{PostCovid}_{t}+\gamma _{t}+\delta _{s}+\varepsilon _{iat}\end{align*}$$
$$\begin{align*}LnAv. {Price}_{iat}&=\alpha _{0}++\alpha _{1}Av. {Weight}_{iat}+\alpha _{2}Av. {Weight}\ {squared}_{iat}+\alpha _{3}Head/lot_{iat}\\
&\quad+\,\alpha _{4}{Dress}\ High_{iat}+\alpha _{5}{Dress}\ {aveage}_{iat}+\alpha _{6}{Select}\ 1_{iat}+\alpha _{7}{Select}\ 12_{iat}\\
&\quad+\,\alpha _{8}{Select}\ 2_{iat}+\alpha _{9}{Select}\ 23_{iat}+\alpha _{10}{Bucks}_{iat}+\alpha _{11}Kids_{iat}+\alpha _{12}{Wetherkids}_{iat}\\
&\quad +\, \alpha _{13}{Wetheres}_{iat}+\alpha _{14}{Trend}_{t}+\alpha _{15}{PostCovid}_{t}+\gamma _{t}+\delta _{s}+\varepsilon _{iat}\end{align*}$$
where Ln_Av_Price iat is the log of the average price of the goat in lot ‘i’ in an auction location ‘a’ in time ‘t’. We use a log price variable to ensure the normality of the data (Wooldridge, Reference Wooldridge2013) and to capture the non-linear nature of the relationship between price and other attributes. Av.Weight iat denotes the average weight of goats in the given lot, Av.Weightsquared iat is the square of the average weight variable, and Head/lot iat is the number of headcounts in a given lot. Dress high and Dress average are indicator variables for dressing high and average percentages, and Dress low is used as a reference group. We use indicator variables for Select 1, Select 12, Select 2, and Select 23, and Select 3 is used as a reference group. Likewise, Bucks, Kids, Wether-kids, and Wethers are indicator variables for class, and Nannies are used as a reference group. Trend t and PostCovid t denote the monthly trend variable and post-COVID period. ε iat denotes the iid error term. To control the seasonality and state-specific time-invariant unobservable variables, we use a month (γ t ) and state (δ s ) fixed effects, respectively. Additionally, we examine variations to model specification in equation 1, where we use categorical variables that could affect goat price. For example, instead of monthly fixed effects, we use festival dummies to examine festivals’ potential impact on meat goat demand. We also add a dummy variable for the kidding season, when the supply of goats is low, to study the effect of supply seasonality. Likewise, we examine the effect of the foreign-born population on meat goat demand. The inclusion of ‘market force’ variables (such as festivals, kidding season, and foreign-born population) in the hedonic model, along with variables regarding the animal’s physical characteristics, is important because the former can be correlated with the latter in the model.Footnote 4 All the models cluster the standard errors at the state level to address the correlation between the residuals at that level. By doing so, we assume that goat prices in the states are not independently distributed and could be affected by state-level factors (state policies, culture, religious belief, etc.).
Data
The primary data source is the slaughter goat auction data reported by auction markets nationwide and compiled by the USDA Agricultural Marketing Services (USDA AMS, 2022). Sixty goat and sheep auction markets in 17 states are listed and reported by the USDA AMS (2022) (Appendix: Table 1A). However, during the study period (2019 to 2021), only 55 auction markets in 16 states reported the transaction of meat goats through auction. These auctions cover over 50% of goats slaughtered in the United States annually (Table 1A in appendix). As shown in Table 1A, the auction market in Texas transacts almost 90,000 meat goats annually, followed by North Carolina (over 67,000) and Missouri (over 43,000). North Carolina has the most auction markets (10), followed by Missouri (7) and West Virginia (7). Slaughter goat auctions operate in various frequencies – most operate weekly, but some open only a few times a year.
After removing data with incomplete information and a weight outlier (one lot reported 800 lbs. kidFootnote 5 ), we have 106,505 observations (lots) for the final analysis. Each observation gives information on the average price of a goat head and other attributes (class, dressings, average weight, and selection) of the given lot at the time of sale. The number of goats per lot varies from one to 838. The price unit is reported either per head or per cwt. We converted all average prices into a dollar per pound unit.
Table 1 shows the descriptive statistics for the goat lots in the data set. The average goat price is 2.23 dollars per pound,Footnote 6 and the average goat weight is 85.79 lbs. On average, there are about 10 goats per lot. Almost all of the lots (98%) have average dressing. Likewise, 45% of the lots are select 1, 30% select 2, and 8% select 3. The other 17% lie between levels 1 and 2 or 2 and 3. Nearly 40% of the lots are kids, 27% are nannies, 22% are bucks, with the remainder wethers and wether-kids.
Table 1. Descriptive statistics (price and attributes)

# There are some outliers in the data. The high-priced goat lots are mainly small kids, and the low-priced ones are mainly nannies and lots with poor dressing quality. Only five lots (all bucks) have an average weight greater than 400 lbs. The exclusion of these outlier lots does not significantly alter our estimates.
* Dress quality, select, and class are categorical variables coded as 0 and 1; hence, the mean values for these variables in the table represent the percent shares.
Source: Calculated by the authors using USDA AMS data.
Figure 3 shows the relationship between goat class and weight. Bucks and wethers are about 110 pounds, while nannies are slightly below 100 pounds. Kids weigh about 60 pounds, and wether-kids weigh almost 70 pounds.

Figure 3. Average weight of different classes of live goats.
Source: Created by authors using USDA AMS data (N = 106,505).
Panel a of Figure 4 shows the seasonality (in supply and price) and price trend of goats – all averaged from the auction data. Meat goat prices are generally higher in March–April. The main reason for this seasonality could be the breeding season of goats (Delgadillo, Reference Delgadillo2011). In the United States, goats are usually bred from August to October. Their gestation period is 150 days – meaning they start kidding in February–April. Thus, the kidding season could lower the supply of slaughter-age goats, increasing the meat goat price. After 5–6 months, goat kids reach slaughter age, increasing the supply of meat goats (kids) during September–October and thus decreasing the price.

Figure 4. Seasonality and monthly trend of slaughter goat price. (a) Seasonal variation in the slaughter goat price and the total number of goats sold in auctions. (b) Monthly trend in the slaughter goat price from 2019 to 2021.
Note: The vertical line in March 2020 indicates the point when COVID-19 pandemic-related restrictions started in the United States. These figures are created by authors using USDA AMS (2022).
Another potential cause of high goat prices in February–April could be the Easter celebration, as members of Hispanic communities commonly serve lamb and goat meats at Easter dinners. Although Hindu and Muslim festivals fall in September and October (Jones and Raper, Reference Jones and Raper2017), goat prices are lower during these months, indicating that these festivals may not affect the demand for goat meat. Jones and Raper (Reference Jones and Raper2017) reported similar price trends. Panel b of Figure 4 shows that although goat prices temporarily decreased sharply in 2021, they show a generally increasing trend during the study period.
Hypothesized variable signs
Some of the expected coefficient signs are described in the literature, and others are based on economic intuition and empirical findings of related studies. The expected sign for average weight is negative due to the decrease in meat quality with weight (an indicator of fatty meat), as Schweihofer (Reference Schweihofer2012) discussed. We expect the weight-squared term to be positive because some communities prefer bigger goats. The expected sign for head/lot is positive since transporting larger goat lots from the auction market is economical. Likewise, we expect the higher dressing quality to be associated with a higher price. Select 1 and 2 indicate a conformation of high-quality animals and are expected to be valued more than select 3. Older goats have low-quality meat (less juicy and tougher), so nannies and bucks are expected to have low value (Webb, Casey, and Simela, Reference Webb, Casey and Simela2005).
We expect a positive sign for the price trend in the estimation, as suggested by Panel b in Figure 4, because of declining domestic production and increasing imports to fulfill the increasing demand. A positive price trend can also result from a climate-induced global decline in supply, increasing the global goat meat price (Aryal et al., Reference Aryal, Sapkota, Rahut, Marenya and Stirling2021). Likewise, the COVID-related supply chain disruption can increase the price post-COVID. Easter and Hindu-Muslim festivals and the lean supply period are expected to increase meat goat prices. This expectation is based on seasonality in the supply and demand of meat goats in the United States. The coefficient associated with the foreign population is expected to be positive, as the foreign-born population is believed to drive the demand for goat meat.
Results and discussion
Tables 2 to 4 provide the estimates from the hedonic model. We include month and state-fixed effects in the specification corresponding to the results in Table 2. The state-fixed effect controls for time-invariant factors such as weather patterns, geography, and relative market access, which can bias estimates of the attributes.Footnote 7 All models report robust standard errors clustered at the state level. We use the robust standard error to address the potential heteroskedasticity problem (Mitchell, Peel, and Brorsen, Reference Mitchell, Peel and Brorsen2018). The consistent results across the specification confirm the robustness of the estimates.Footnote 8 The negative and positive significant estimates corresponding to average weight and weight-squared, respectively, in Table 2 suggest a non-linear (convex) relationship between weight and price. The minimum point of this convex relationship suggests that goats weighing above 300 pounds show a positive relationship with the price. In our sample, however, only 109 observations (less than 1%) have an average weight exceeding 300 lbs. Thus, we can argue that weight and price are generally negatively correlated within the marketable goat weight range. The negative relationship between larger size and price might occur because goat slaughtering facilities are generally primitive, and goat processors prefer small animals, which are easier to slaughter. Further, consumers who directly buy whole goats from processors typically prefer small to medium goats. In cattle, a negative relationship between weight and price has also been reported (Bulut and Lawrence, Reference Bulut and Lawrence2007; Burdine et al., Reference Burdine, Maynard, Halich and Lehmkuhler2014; Martinez et al., Reference Martinez, Boyer and Burdine2021).
Table 2. Estimates from the hedonic model
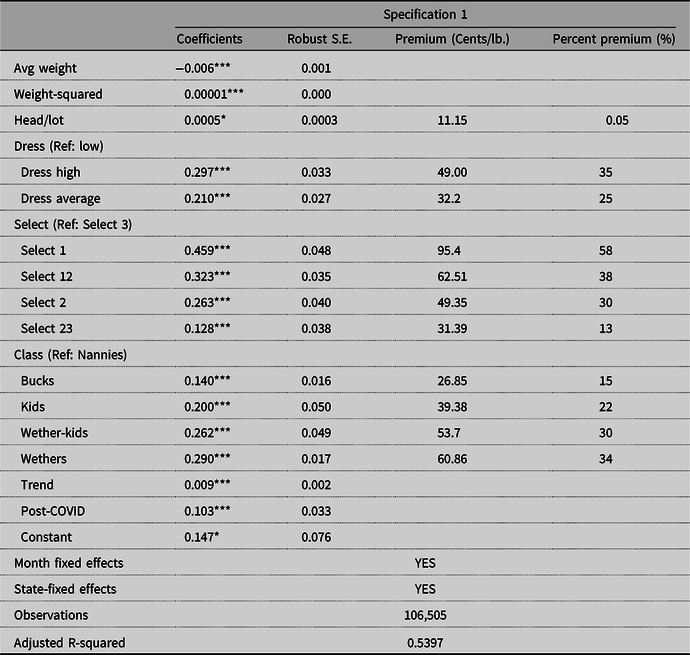
Note: ***, **, and * indicate the statistical significance level at less than 1, 5, and 10%, respectively. S.E.s are robust and are clustered at the state level. The percent premium column is calculated from the coefficient estimates, as explained in footnote 9. The percent premiums for dressing, select, and class categories are calculated in comparison with their reference categories (e.g., dress low is the reference category for dressing). For head/lot, the premium is relative to the average price of all lots.
The results suggest that the larger the lot size (Head/lot), the higher the average price per unit of goat weight. One more goat in a lot increases the average price by 0.05%,Footnote 9 translating into a premium of 11 cents per pound.Footnote 10 , Footnote 11 The positive relationship between lot size and goat price is intuitive as larger lots are economical to transport than smaller ones.
Expectedly, goats with above-average or average dressings receive a higher price than low-dressing goats. High and average-dressing quality is valued at 35 and 23% higher, respectively, than low-dressing goats. From these estimates, the price premiums of high and average-dressing goats are 49 cents and almost 32 cents per pound, respectively.
Consistent with the perceived quality of slaughter goats, select 1 and 2 have higher price premiums than select 3. Select 1, select 12, select 2, and select 23 are valued at 58, 38, 30, and 13%, respectively, more than select 3. These estimates suggest a price premium of 95, 63, 49, and 31 cents per pound, respectively. The result indicates that higher muscularity and better conformity are highly valued goat attributes. Better muscularity improves the taste of meat and suggests that the goat is healthy, which is reflected in the price premium for the goat.
Much as culled cows are valued less than other slaughter cattle (Hahn and Mathews, Reference Hahn and Mathews2007), nannies, used mainly for kidding and culled afterward, have the least-valued meat. Bucks, kids, wether-kids, and wethers are valued at 15, 22, 30, and 34% more with premiums of 27, 39, 54, and 61 cents per pound, respectively, than nannies. Significantly, the findings indicate that castrated goats (wether-kids and wethers) are valued most, possibly because of good meat flavor, superior dressing percentage, and better marbling (Koyuncu et al., Reference Koyuncu, Duru, Uzun, Öziş and Tuncel2007; Zamiri, Eilami, and Kianzad, Reference Zamiri, Eilami and Kianzad2012). Monthly slaughter goat prices (Figure 4, Panel b) show an increasing trend. On average, meat goat prices increased by almost 1% per month from 2019 to 2021. The price increase has been even more rapid post-COVID (after March 2020).
Table 3 uses specific temporal demand and supply factors instead of monthly fixed effects in the model. Jones and Raper (Reference Jones and Raper2017) and Nyaupane, Gillespie, and McMillin (Reference Nyaupane, Gillespie and McMillin2016) show the importance of Easter and Hindu and Muslim festivals (such as Dashain/Dussehra for Hindus and Eid for Muslims) for goat meat demand. Estimates from specification 2 show that the price is higher during Easter (March–April) but is lower during the fall, despite Hindu-Muslim festivals. The result is consistent with that of Jones and Raper (Reference Jones and Raper2017). However, when we use the indicator variable for the lean supply period (February–April) in specification 3 of Table 3, the positive estimate associated with Easter, as seen in specification 2, becomes insignificant, while there is a significant (7%) increase in the goat price during the lean supply period. This result indicates that a low supply of goats drives the price more than the demand during festivals.
Table 3. Hedonic estimates with demand and supply seasonal dummies
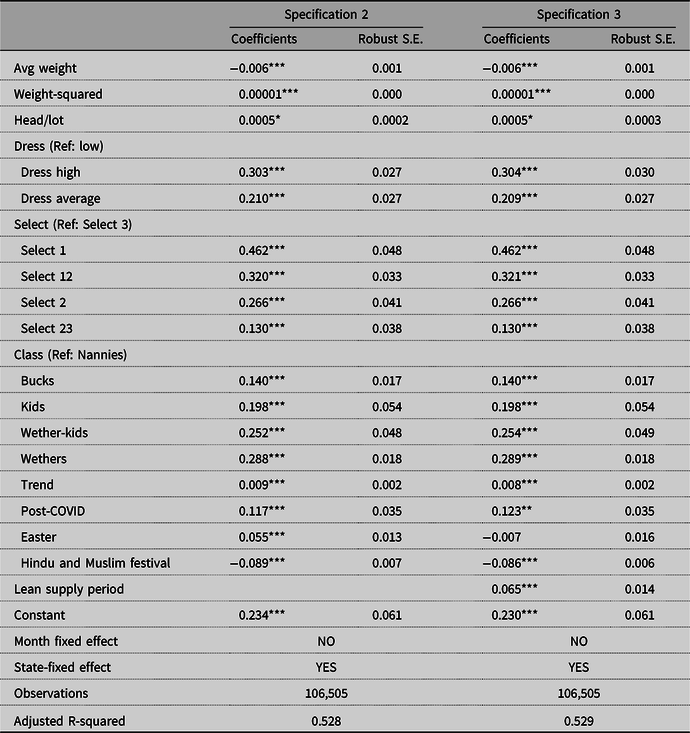
Note: ***, **, and * indicate the statistical significance level at less than 1, 5, and 10%, respectively. S.E.s are robust and are clustered at the state level.
Table 4. Hedonic estimates with the share of the foreign-born population in the states

Note: *** and ** indicate the statistical significance level at less than 1 and 5%, respectively. S.E.s are robust and are clustered at the state level.
In Table 4, we show the effect of the foreign-born population on meat goat prices.Footnote 12 Contrary to popular belief that the immigrant population increases goat meat demand (e.g., Ibrahim et al., Reference Ibrahim, Onyango, Pattanaik and Liu2018), we find no direct evidence in this regard in the auction markets.Footnote 13
Further, we interacted with the state indicator variables with the state’s share of the foreign-born population (U.S. Census Bureau, 2022) to find any effect of the foreign-born population at the state level (Table 5). Consistently, we find a positive but insignificant relationship between the percentage of the foreign-born population and meat goat prices.
Table 5. Hedonic estimates with state and foreign-born interaction

Note: ***, **, and * indicate the statistical significance level at less than 1, 5, and 10%, respectively. S.E.s are robust and are clustered at the state level.
++ WV*Foreign born is omitted because data show that the foreign-born population did not change from 2019 to 2021 in W.V.
Therefore, we lack sufficient evidence to claim a positive relationship between the foreign-born population and auction goat price definitively. A possible reason is that after the auction, goats might be transported to a state with a very different proportion of the foreign-born population, where they are eventually slaughtered and consumed.
Conclusion
Given its health and environmental benefits, goat meat has the potential to emerge from a niche market and increase its market share in the United States (Schweihofer, Reference Schweihofer2011). However, there is a significant research gap regarding the marketable attributes of meat goats. This paper employs a hedonic price model on the 2019 to 2021 meat goat auction dataset to analyze the drivers of meat goat auction prices in the United States.
Our results suggest that select 1 castrated male goats and kids with high dressings in bigger lot sizes are highly valued in the auction markets. Our results also show an increasing trend of meat goat prices, especially after the COVID pandemic. The decreased supply of goats during the kidding seasons is found to largely explain the increase in the price during spring, while the festivals (Easter and Hindu and Muslim festivals) do not increase the price significantly. The results of this study will aid goat producers in streamlining their expected prices in line with the market demand and adding value to their production by producing premium goats. Ultimately, this will expand domestic supply and minimize the import of goat meat into the United States.
Although this study has interesting first-hand results from goat auction markets and is among the first of its kind, a limitation emanates from the assumptions related to hedonic models. This study does not address the marginal costs associated with the desirable goat attributes. Adding some of the attributes to meat goats (for example, by castration) could be inexpensive. However, improving other attributes, such as muscularity and dressings, might be costlier, as they may entail better feeding, veterinary care, and husbandry. Sometimes, the marginal costs of these attributes could exceed the marginal benefits. Higher production cost (thus, less profitability) is a major challenge goat producers face (Gillespie, Nyaupane, and McMillin, Reference Gillespie, Nyaupane and McMillin2013). This issue should be addressed in a separate study to identify possible causes of a less competitive U.S. goat production system and find ways to improve it. Despite this limitation, this study is a first step in understanding the broad picture of the U.S. meat goat market. More economic analyses at various levels of the marketing chain are needed to address other issues related to meat goat marketing. Finally, studies of consumers’ demand for goat meat and willingness to pay for it will be crucial in understanding the current status and future prospects of goat meat.
Author contribution
Conceptualization, SPD (lead) and BK (support); Methodology, SPD (equal) and BK (equal); Data Curation, BK (lead) and SPD (support); Formal Analysis, SPD (equal) and BK (equal); Writing – Original Draft, BK (lead) and SPD (support); Writing – Review and Editing, SPD (Lead) and BK (equal); Supervision, SPD.; Funding Acquisition, SPD.
Data availability statement
The data used in this research are collected from the publicly available USDA AMS database (https://mymarketnews.ams.usda.gov/public_data). The data and codes used in this analysis are available on request.
Funding statement
This material is based upon work supported by the U.S. Department of Agriculture, Agricultural Research Service, under Agreement No. 58-3091-1-018 via the Institute of Advancing Health through Agriculture, Texas A&M AgriLife, Texas A&M University. Any opinions, findings, conclusion, or recommendations expressed in this publication are those of the author(s) and do not necessarily reflect the view of the U.S. Department of Agriculture.
Competing interests
The authors declare that no competing interest is involved in completing this work.
Appendix

Figure 1A. Histogram for the average price and log of average price.
Source: Created using the USDA AMS, 2022.
Table 1A. Total number of auctions and the number of goats transacted through auctions

Source: Calculated by authors using (USDA AMS, 2022).
+ Our study has information from only three auctions in G.A.
++ Our study has used data from only three auctions in P.A.
+++Auctions in Virginia did not transact slaughter goats from 2019 to 2021.


 Open access