


1. Introduction
Sorghum is the sixth-largest crop produced in the world. About 105 million acres of grain sorghum were planted worldwide in 2015. Most of the production was in Africa (57%), South Asia (14%), and North America (11%) (U.S. Department of Agriculture, Foreign Agricultural Service [USDA-FAS], 2017b). In terms of trade, U.S. sorghum accounted for almost 80% of the total exports, and China acquired 82% of the world imports (USDA-FAS, 2017a). In the United States, sorghum is the third-largest cereal grain crop with more than 7 million acres planted each year and a market value of more than $2.4 billion (USDA, National Agricultural Statistics Service [NASS], 2015).
Texas is the second-largest producer of grain sorghum in the country. In 2015, about 2.7 million acres were planted in the state with an estimated economic value of $742.7 million (Salinas and Robinson, Reference Salinas and Robison2015; USDA-NASS, 2015). However, the sorghum industry is threatened by a new invasive pest, the sugarcane aphid (SCA), capable of causing substantial damage to crop production (Brown, Kerns, and Beuzelin, Reference Brown, Kerns and Beuzelin2015; Knutson et al., Reference Knutson, Bowling, Porter, Bynum, Villanueva, Allen and Biles2015; Seiter et al., Reference Seiter, Lorenz, Studebaker and Kelley2015; Villanueva et al., Reference Villanueva, Brewer, Way, Biles, Sekula, Bynum and Swart2014). In fact, because of its rapid population growth, great dispersion capacity, and reduced availability of effective insecticides, the SCA has become the most damaging pest in sorghum since its detection in 2013 (Bowling et al., Reference Bowling, Brewer, Kerns, Gordy, Seiter, Elliott and Buntin2016).
Despite the importance of sorghum production to both national and state economies, very little work has been done to assess the economic impact caused by the SCA infestation. Particularly, the study of the SCA has focused on analyzing its behavior and control methods rather than on understanding its economic implications (Brown, Kerns and Beuzelin, Reference Brown, Kerns and Beuzelin2015; Knutson et al., Reference Knutson, Bowling, Porter, Bynum, Villanueva, Allen and Biles2015; Seiter et al., Reference Seiter, Lorenz, Studebaker and Kelley2015; Singh, Padmaja, and Seetharama, Reference Singh, Padmaja and Seetharama2004; Villanueva et al., Reference Villanueva, Brewer, Way, Biles, Sekula, Bynum and Swart2014). No previous study has been able to estimate the overall economic impact caused by the SCA outbreak.
The main objective of this study is to estimate the economic impact of the SCA at the farm, industry, and regional levels. Specifically, we focused on assessing the economic impact associated with the SCA outbreak in the Rio Grande Valley (RGV) of Texas. Given its geographic location just north of the Mexico-U.S. border, the RGV is a key region to understand and identify the economic impact of new invasive pests. In conjunction with overwinter survival, the RGV may have served as an initial focus of dispersion of this pest to the rest of the state. In 2015, about 310,000 acres of sorghum were planted in the region with an estimated economic value of $92.3 million (Salinas and Robinson, Reference Salinas and Robison2015; USDA-NASS, 2015).
This is the first study that has systematically documented the economic impact of the SCA in both producers and the overall economy. Direct, indirect, and induced impacts caused by the SCA in 2014 and 2015 were quantified. This study also estimates the monetary value and economic impacts of the control efforts aimed at mitigating the burden caused by this new invasive pest. Furthermore, this study contributes to the current literature in terms of novel approaches to assess the overall economic impact of invasive species. The valuation methodology developed can be replicated in other areas of the country affected by the SCA, and it can be extended to analyze the economic impact of other invasive pest outbreaks.
2. Background and Literature Review
2.1. A Brief History of the Sugarcane AphidFootnote 1
The SCA, Melanaphis sacchari Footnote 2 (Zehntner) (Hemiptera: Aphididae), is a common pest of sorghum and sugarcane in tropical regions around the world (Singh, Padmaja, and Seetharama, Reference Singh, Padmaja and Seetharama2004). Though reported in Hawaii in 1896, it was first documented in the continental United States on sugarcane in Florida in 1977 and then in Louisiana in 1999. These infestations were characterized by summer outbreaks followed by winter population decline. No previous occurrences resulted in permanent infestation by the pest, and there was no indication, at that time, that the SCA could successfully adapt to more temperate environments.
It was initially hypothesized that in 2013 the SCA population in the United States underwent an apparent host shift, likely because of a new haplotype introduction or sexual recombinant, resulting in a preference for plants in the genus Sorghum, but not those in the genus Saccharum (sugarcane), causing extensive damage to sorghum while not affecting sugarcane, corn, or wheat. However, recent findings suggest limited genetic diversity in the SCA populations across the United States (Medina, Armstrong, and Harrison, Reference Medina, Armstrong and Harrison2017; Nibouche et al., Reference Nibouche, Fartek, Mississipi, Delatte, Reynaud and Costet2014). The pest was first detected in sorghum near Beaumont, Texas, in June 2013, and now it is common to encounter large populations of this aphid species on sorghum plants from emergence to harvest. Exponential population growth is observed prior to boot, the stage when plants are most susceptible to injury. Later in 2013, outbreaks of this aphid occurred in grain sorghum fields in south and east Texas; northeastern Mexico; southwest, central, and northeast Louisiana; southern Oklahoma; and eastern Mississippi. Additional SCA outbreaks have been reported in Kansas, Georgia, Florida, New Mexico, Kentucky, Colorado, Illinois, Virginia, Arkansas, Missouri, Tennessee, South Carolina, North Carolina, southern California, and Arizona (Bowling et al., Reference Bowling, Brewer, Kerns, Gordy, Seiter, Elliott and Buntin2016). The rapid and widespread infestation by the SCA across a large and climatically diverse geography demonstrates the urgency of economic analysis regarding farm losses and regional economic impacts.
Several factors have been associated with the rapid and widespread growth of SCA on sorghum in North America. Empirical evidence suggests that overwintering survival on remnant and ratoon sorghum and perennial grasses, along with wind-aided movement of alate aphids have been fundamental to the dissemination of the pest over long distances. In addition, all SCAs are female, they reproduce asexually, and in 4 to 12 days they become adults capable of producing between 34 and 96 nymphs per individual depending on temperature and nutrition. Particularly, accelerated population growth has been observed during warm and dry weather. These climatic conditions are commonly encountered in much of the sorghum-producing regions of North America (Bowling et al., Reference Bowling, Brewer, Kerns, Gordy, Seiter, Elliott and Buntin2016).
The SCAs preferably feed on the abaxial (underside) surface of sorghum leaves. They colonize a different stratum of the canopy depending on the stage of growth that they arrive. On small plants, SCAs are primary found in the lower leaves and move progressively to superior leaves. In mature plants, the aphids colonize the upper canopy first. In severe infestations, the SCAs may eventually reach the seed heads (panicles). Aphid feeding produces yellow to red or brown leaf discoloration, which is visible on both sides of the leaf. Also, while feeding on sorghum the aphid leaves behind its body waste, also known as honeydew. When conditions are favorable, small colonies can grow exponentially producing large amounts of sticky honeydew. Indirect damage is caused by the abundant honeydew, which may support the growth of airborne, sooty mold fungus. Infestations on seedling grain sorghum can kill young plants and infestations during booting or heading can prevent the formation of grain. Losses may also occur as sticky leaves foul grain separation from stalks and leaves in the combine harvester, causing grain to “ride over” and be lost on the ground.
In terms of control options, insecticides are currently used for its control when aphid populations are increasing rapidly to prevent and reduce yield losses. Natural enemies including lady beetles, syrphid fly larvae, green lacewings, and parasitic wasps have been observed feeding on the SCA. However, these natural enemies are not able to keep up with rapid SCA outbreaks. Also, the seasonal occurrence of large SCA populations limits the permanent establishment of significant colonies of natural enemies. In addition, variety screening work has shown that certain sorghum lines offer varying degrees of host plant resistance to SCA, inhibiting population growth and reduced leaf damage.
2.2. Economic Impact of Invasive Insect Pests
Several introduction and dissemination pathways of nonindigenous species have been identified and inferred. Particularly, it has been observed that most invasive pests arrive in association with intentional and accidental human activities such as trade, transportation, cultivation, and tourism. In addition, exogenous alteration of natural habitats can create conditions favorable to the establishment of new invasive species (U.S. Congress, Office of Technology Assessment, 1993).
Approximately 50,000 foreign species have been introduced into the United States over the last two centuries. It is estimated that the economic losses associated with invasive species and their control add up to almost $120 billion per year (Pimentel, Zuniga, and Morrison, Reference Pimentel, Zuniga and Morrison2005). Some of these nonindigenous species have caused substantial economic damages to the agriculture sector. Pimentel, Zuniga, and Morrison (Reference Pimentel, Zuniga and Morrison2005) calculated that the total loss to crop production attributed to invasive insect pests is approximately $13.5 billion per year.
The economic impacts of invasive pests on specific agricultural industries and regions have been extensively studied. For example, Bolda, Goodhue, and Zalom (Reference Bolda, Goodhue and Zalom2010) analyzed the potential economic effects of spotted wing drosophila (Drosophila suzukii) on berry production in California, Oregon, and Washington. They found that based on maximum observed yield losses this fly could cause economic damage of about $422 million in the three states. Hoddle, Jetterb, and Morse (Reference Hoddle, Jetterb and Morse2003) assessed the economic damage caused by Scirtothrips perseae Nakahara on California avocado production. They concluded that this thrips infestation can cause annual economic losses of $8.11 million in the short run and $4.78 million in the long run to avocado producers. Other studies have focused on quantifying the economic impacts of invasive pest on forests’ market and nonmarket goods and services (e.g., Holmes et al. Reference Holmes, Aukema, Von Holle, Liebhold and Sills2009; Pimentel, Zuniga, and Morrison, Reference Pimentel, Zuniga and Morrison2005; Rosenberger and Smith, Reference Rosenberger and Smith1997), livestock production (e.g., Taylor, Moon, and Mark, Reference Taylor, Moon and Mark2012), and international economies (e.g., Oliveira et al., Reference Oliveira, Auad, Mendes and Frizzas2013; Pyšek and Richardson, Reference Pyšek and Richardson2010).
Little is known about the economic impact attributed to the SCA outbreak in Texas or across the United States. To the best of our knowledge, the only reported loss estimates associated with the SCA are from Louisiana sorghum producers. Namely, Kerns et al. (Reference Kerns, Brown, Beuzelin and Guidry2015) estimated that in 2013 the SCA caused a total economic loss of about $7.7 million to the Louisiana sorghum industry. Although the Kerns et al. (Reference Kerns, Brown, Beuzelin and Guidry2015) study and all the aforementioned valuation efforts estimated only the direct economic losses (i.e., revenue loss and/or control cost) caused by nonindigenous species on specific host agricultural industries, in this study we focused on assessing the direct effects of the SCA on sorghum production and the indirect and induced region-wide economic impacts resulting from the SCA infestation. Also, similar to Kerns et al. (Reference Kerns, Brown, Beuzelin and Guidry2015), our analysis is based on primary information provided by local sorghum growers rather than on aggregated secondary data.
3. Methods
3.1. Sorghum Producers Survey
In order to get the best representation on sorghum production in the RGV, we contacted local growers in Starr, Willacy, Cameron, and Hidalgo counties by telephone. The use of telephone surveys has some advantages over other sampling methods such as reduced self-selecting and self-administered effects, quick turnaround time, the possibility to clarify questions, and closer supervision of participants. On the other hand, telephone surveys have been shown to have lower response rates, a propensity for respondents to exert less cognitive effort to complete the survey (satisficing), and higher social desirability bias (Curtin, Presser, and Singer, Reference Curtin, Presser and Singer2005; Holbrook, Green, and Krosnick, Reference Holbrook, Green and Krosnick2003; Szolnoki and Hoffmann, Reference Szolnoki and Hoffmann2013). Although the presence of the aforementioned biases cannot be confirmed or refuted, producers’ responses regarding production outcomes and control efforts might represent their perceived values rather than actual measures.
Eighty-three potential participants were randomly selected from a list of growers who signed up to receive the Pest Cast newsletterFootnote 3 that is distributed every week to alert local growers of new pest developments during the growing season. Producers were called twice after the harvesting season (i.e., late June to August), the time when yields were being determined. Growers were first informed of who was calling and that their responses would be kept anonymous. As they agreed to participate in the survey they were asked a series of questions first for the year 2014 and then for their 2015 crop. The overall response rate was 47%. A total of 37 growers in 2014 and 39 growers in 2015 agreed to participate in the study. The questionnaire gathered detailed information about yearly crop yields, crop acreage, insecticide application decisions, and management and production practices. As a result of this survey, we obtained data for a sum of 46,578 acres in 2014 and 49,761 acres in 2015. Surveyed acres represent 14.7% and 15.8% of the total RGV sorghum acreage in 2014 and 2015, respectively.
3.2. Economic Impact of the Sugarcane Aphid on Sorghum Growers
The SCA has directly and indirectly affected the local economy of the RGV. Direct impacts are given by the reduction in growers’ profits, and the incidental impacts are generated by the subsequent decrease in the amount of money that circulates through the economy. A functional form for the sorghum growers’ profit was defined to calculate the reduction in profit associated with the SCA infestation. Specifically, the sorghum profit function is given by
 $$\begin{equation}
{\pi _t} = {p_t}{Y_t} - {{\bm{R}}_t}{{\bm{X}}_t} - {a_t}{N_t} - {h_t}{Y_t} - {s_t} - {m_t} - {C_t},
\end{equation}$$
$$\begin{equation}
{\pi _t} = {p_t}{Y_t} - {{\bm{R}}_t}{{\bm{X}}_t} - {a_t}{N_t} - {h_t}{Y_t} - {s_t} - {m_t} - {C_t},
\end{equation}$$
where the subscript t denotes the year, p is the price of sorghum, Y is the sorghum yield, R is a vector of pesticide prices, X is a vector of pesticide quantities, a represents the pesticide application cost, N is the number of pesticide applications, h is the variable harvesting cost, s represents the cost of seeds, m is the pest monitoring cost, and C represents all other production costs independent of Y, X , N, and pest management.
The SCA outbreak affects farmers’ profits by increasing the production cost because of additional costs to monitor and control the pest, and by reducing the revenues because of lower yields. Production cost substantially increased because of the additional insecticide and surfactant used. A typical practice of surveyed producers was to add surfactant to the targeted insecticide applications to control the pest. Adding surfactants is deemed by farmers to improve the efficacy of the insecticide; nevertheless, early evaluations suggest no significant difference (Jones et al., Reference Jones, Williams, Emfinger, Brown and Kerns2015b).
Also, a lower overall variable harvesting cost is expected in affected fields because of lower yields and partial abandonment. On the other hand, reduced harvesting efficiency has been reported in severely infected fields, which may result in higher harvesting costs (Kerns et al., Reference Kerns, Brown, Beuzelin and Guidry2015). In this study, the same variable harvesting cost per unit of output was considered for both infected and noninfected fields. Thus, our assessment could underestimate the effect that the SCA outbreak has on harvesting expenses.
The costs associated with seed selection are also expected to be affected by the appearance of the SCA. In particular, the use of insecticide seed treatment and tolerant hybrids have been proposed to reduce yield losses caused by the SCA (Bowling et al., Reference Bowling, Brewer, Kerns, Gordy, Seiter, Elliott and Buntin2016; Jones et al., Reference Jones, Brown, Williams, Emfinger and Kerns2015a). Given RGV's inherent production conditions, the adoption of insecticide-treated seeds had already been well implemented among grain sorghum growers; thus, no significant changes in costs related to seed treatment are anticipated. Finally, after the arrival of the SCA local farmers started scouting for the pest on a regular basis. Scouting activities were performed by either farm personnel or private consultants. Based on anecdotal evidence, it was assumed that monitoring for the SCA was conducted by those growers who implemented at least one of the other control practices. Before the arrival of the SCA, growers sporadically and not exhaustively scouted for pests.
The overall impact of the SCA at the farm level is given by the difference between the ex post (with SCA infestation) and ex ante (without SCA infestation) farm's profit levels. This change in profit because of the SCA outbreak can be represented by
 $$\begin{eqnarray}
\Delta {{\rm{\Pi }}_t} &=& \ \pi _t^1 - \ \pi _t^0 \nonumber\\
&=& {\rm{\ }}{p_t}\left( {Y_t^1 - Y_t^0} \right) - r_{it}^1x_{it}^1 - r_{jt}^1x_{jt}^1 - {a_t}n_t^1 - {h_t}\left( {Y_t^1 - Y_t^0} \right) - \left( {s_t^1 - s_t^0} \right) - m_t^1, \nonumber\\
\end{eqnarray}$$
$$\begin{eqnarray}
\Delta {{\rm{\Pi }}_t} &=& \ \pi _t^1 - \ \pi _t^0 \nonumber\\
&=& {\rm{\ }}{p_t}\left( {Y_t^1 - Y_t^0} \right) - r_{it}^1x_{it}^1 - r_{jt}^1x_{jt}^1 - {a_t}n_t^1 - {h_t}\left( {Y_t^1 - Y_t^0} \right) - \left( {s_t^1 - s_t^0} \right) - m_t^1, \nonumber\\
\end{eqnarray}$$
where superscripts 1 and 0 denote the ex post and ex ante levels, respectively; xi is the additional insecticide used to control the SCA, ri is the insecticide price, xj represents the extra surfactant used, rj is the surfactant price, n is the number of additional applications needed to spray xi and xj , and the additional cost for using tolerant hybrids is given by s 1 t − st 0.
The different sorghum and input prices used to estimate the economic impact of the SCA are presented in Table 1. Sorghum prices are the yearly prices reported by USDA-NASS (2015); insecticide, surfactant, and seed prices were provided by local agrochemical and seed suppliers; insecticide application costs were obtained from local commercial applicator enterprises; scouting fee was provided by regional crop consultants; and variable harvesting costs were based on Texas custom rate statistics (Klose, Reference Klose2013, Reference Klose2016). Additionally, the ex ante sorghum yield (or the potential yield in the absence of the SCA) was defined to be proportional to the ex post yield reported by farmers. Specifically, based on anecdotal evidence and field experiment trial results it was assumed that the presence of SCA reduced the amount of sorghum harvested (yield penalty) by 10% and 5% on fields that applied insecticide to control the pest (hereafter, sprayed field) in 2014 and 2015, respectively. In 2014, the observed yield from noninfected experimental locations across Texas was 21.5% greater than its counterpart from infected and sprayed field trials (Schnell et al., Reference Schnell, Pietsch, Horn, Moreno, Rooney and Peterson2014). Infected locations were identified based on the reported occurrence of the SCA (Bowling et al., Reference Bowling, Brewer, Kerns, Gordy, Seiter, Elliott and Buntin2016) and use of insecticides to control the pest (Schnell et al., Reference Schnell, Pietsch, Horn, Moreno, Rooney and Peterson2014). A lower yield penalty was defined to account for ecoregion and production differences. A similar analysis could not be performed in 2015 because the incidence of the SCA was reported in most locations, but yield loss was expected to be lower than the previous year.
Table 1. Sorghum and Input Prices by Year
On the other hand, the yield penalty on nonsprayed fields was set to be equal to the observed mean yield difference between sprayed and nonsprayed fields, plus the expected yield loss on sprayed fields. Namely, survey results indicate that, on average, the expected yield on nonsprayed fields was 39.6% and 17.8% lower than their counterpart sprayed fields in 2014 and 2015, respectively. Similar yield penalties were used for tolerant and nontolerant hybrids based on experimental trial results (Schnell et al., Reference Schnell, Pietsch, Horn, Moreno, Rooney and Peterson2014, Reference Schnell, Pietsch, Horn, Moreno, Rooney and Peterson2015) and personal observations. It has been argued that under proper pest management, higher yields could be obtained by planting nontolerant hybrids (Trostle, Reference Trostle2016). The lower yield penalties in 2015 are attributable to lower infestation rates (Figure 1) and better monitoring and control practices.
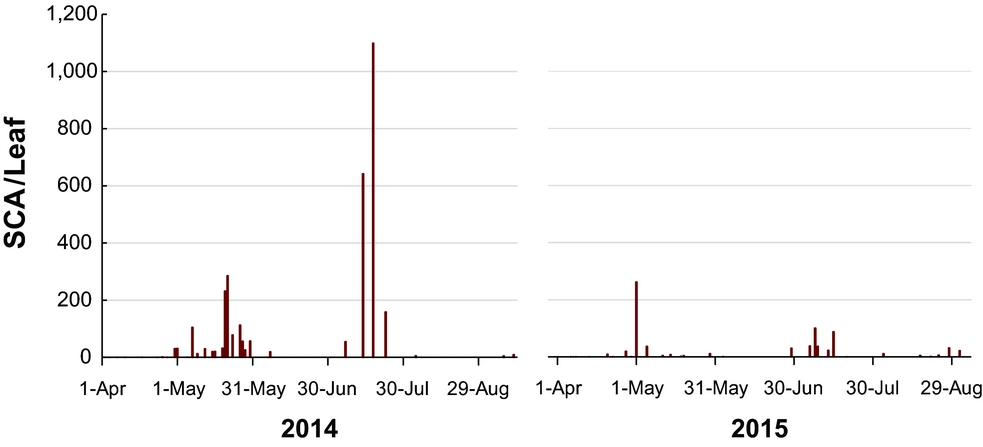
Figure 1. Mean Number of Sugarcane Aphids per Leaf in the Rio Grande Valley, 2014–2015 (source: adapted from Esparza-Diaz and Villanueva, Reference Esparza-Diaz and Villanueva2015)
The change in profits described in equation (2) can be redefined to estimate the prevented profit loss attributed to private and public control efforts, as well as farmers’ own efforts to mitigate the damage caused by the SCA. Specifically, the economic value of the prevented damage is given by
 $$\begin{eqnarray}
\Delta {\rm{\Pi }}_t^{'} &=& \ \pi _t^{1} - \ \pi _t^{'} \nonumber\\
&=& {p_t}\left( {Y_t^1 - Y_t^{'}} \right) - r_{it}^1x_{it}^1 - r_{jt}^1x_{jt}^1 - {a_t}n_t^1 - {h_t}\left( {Y_t^1 - Y_t^{'}} \right) - \left( {s_t^1 - s_t^{'}} \right) - m_t^1, \nonumber\\
\end{eqnarray}$$
$$\begin{eqnarray}
\Delta {\rm{\Pi }}_t^{'} &=& \ \pi _t^{1} - \ \pi _t^{'} \nonumber\\
&=& {p_t}\left( {Y_t^1 - Y_t^{'}} \right) - r_{it}^1x_{it}^1 - r_{jt}^1x_{jt}^1 - {a_t}n_t^1 - {h_t}\left( {Y_t^1 - Y_t^{'}} \right) - \left( {s_t^1 - s_t^{'}} \right) - m_t^1, \nonumber\\
\end{eqnarray}$$
where the no control scenario is represented by the superscripted prime symbol (′). Note that protected profit is equal to the monetary value of the prevented yield loss minus the additional pesticide application, harvesting, seed, and pest scouting costs because of the SCA infestation. In this part of the analysis, if no control measures were implemented, then the prevented profit loss was set to zero because Y 1 t = Yt ' and no additional control expenses were incurred. In contrast, the protected yield on sprayed fields was calculated based on the sample mean relative difference between sprayed nonsprayed fields.
3.3. Economic Impact of the Sugarcane Aphid on the Rio Grande Valley Economy
Direct profit change alone fails to capture the full economic impact of losses. Income losses to farmers, landlords, and shareholders included money that would have been spent in the economy under normal circumstances; additional losses occurred because this money did not circulate through the economy. Similarly, as a result of reduced spending on harvesting, harvesting operations spent less on business supplies and wages. At the same time, farmers spent more than expected on treated tolerant seeds, insecticides, surfactants, and pesticide application, and a portion of these expenses were paid to local suppliers. These businesses and their employees’ households in turn made purchases in the economy, stimulating additional economic activity. These changes resulted in tangible changes to the local economy; although farmers and harvesters did make money on their crops, they made less than they would have without the SCA infestation, so they spent less in the region. On the other hand, greater than usual sales of treated tolerant seeds, insecticides, surfactants, and pesticide application bolstered economic activity. The regional analysis considers the magnitude of those deviations from the expected or usual economic activity.
The multiplier effect recognizes that the total effect on output, value added, labor income, and employment in the region is greater than the initial dollar lost because of changes in indirect spending along backward-linked supply chains and induced spending by households employed by farms, agricultural suppliers, and suppliers’ suppliers. Furthermore, the economic impacts of income losses among farmers and custom harvesters were partially offset by increased sales by pesticide and seed retailers, custom applicators, and pest scouters.
The sorghum industry's economic loss estimates (i.e., actual and prevented losses) were used to assess the overall economic impacts of the SCA infestation in the RGV. Specifically, the IMPLAN economic modeling tool and data (IMPLAN Group, 2014) were used to develop multipliers for the effects of the SCA in the RGV economy, accounting for relationships between each of 536 industry sectors, as well as private households and governments. The model calculates multipliers based on the purchasing patterns of industries and institutions in the regional economy. Each industry and region combination has a unique spending pattern and a unique multiplier. The input-output analysis used assumes that input relationships between the different economic sectors are fixed, linear, and do not change significantly over time. Because prices and relationships between output and input requirements are fixed in the input-output model, the static model is more appropriate for short-term changes. In the longer term, input prices and production relationships would adjust, resulting in smaller estimated impacts. However, it is reasonable to think that prices in national and international markets are relatively fixed in the short run, and the static model provides a good estimate of the shock to the regional economy. As a result, all socioeconomic impacts presented in this study should be regarded as approximations.
Farm profit losses were modeled as changes to the income of households making $75,000–$100,000 annually. Farm losses consisted of revenue losses because of aphid damage plus additional pesticide, seed, and pest monitoring costs less savings from decreased harvest costs. Farmers’ decreased profits had a mixed effect at the regional level. Revenue losses removed money from both farmers and the overall economy. However, increased spending on treated tolerant seeds, insecticides, surfactants, and pesticide applications created additional activity in the regional economy, although these higher costs reduced farm profits. Conversely, lower farm profits were partially mitigated by decreased harvest costs, but this resulted in decreased harvest activity in the regional economy. The offsetting decreases in harvest costs and increases in pest monitoring and insecticide application costs were modeled as commodity changes affecting the agriculture support activities sector. Increased insecticide, surfactant, and treated tolerant seed costs were also modeled as commodity changes. Farmers purchase goods and services from business that sell those commodities. The pesticide and other agricultural chemicals manufacturing sector does not exist in the RGV, so the chemicals cannot be purchased from a local pesticide industry. Consequently, beyond sales commissions and taxes payed, most of the revenues generated by local sales of products used to control the SCA leave the region. Given the geographic scope of our analysis, expenses on chemical inputs have a minor impact on the RGV economy, but these purchases generated additional economic activity outside the RGV.
At the regional level, the reduction in farmers’ revenues and additional production expenditures caused by the SCA outbreak are defined as the direct effect of the infestation. These direct effects result in two types of multiplier effects: indirect effects from the purchase of inputs among local industries and induced effects from the expenditures of institutions such as households and governments benefitting from increased the activity among local businesses.
Four types of multiplier effects are reported in the impact analyses. Output or sales multipliers measure the effect of direct spending (or loss) on overall economic activity in the region. The value-added multiplier is a more appropriate measure of regional welfare. The value-added multiplier measures the event's contribution to regional gross domestic product (GDP). It is the value added to the regional economy or the return to resources used in the production of the event. The labor income or personal income multiplier measures the effect of the event on incomes of households in the region and is appropriate for discerning the benefit to residents. Labor income is a component of value added, which is part of output, so these figures cannot be summed. The employment multiplier measures the effect on full- and part-time employment in various economic sectors. Thus, this region-wide analysis allowed us to measure the overall economic impacts of both actual and prevented profit losses on the RGV economy caused by the SCA outbreak.
4. Results and Discussion
4.1. Survey Results
A complete description of survey responses regarding key farm characteristics and management practices to control the SCA infestation is presented in Table 2. The survey gathered information from a total of 82 sorghum farms, 41 farms by year. The reported average yield in 2014 was 4,544 lb./ac. and 4,729 lb./ac. in 2015. The average acreage of the considered farms was 1,136 acres in 2014 and 1,214 acres in 2015. Survey results also indicate that about 34% of growers farmed on dryland and 66% on irrigated farmland.Footnote 4 The proportion of irrigated to nonirrigated field remained the same between years. About 48% of the observations are from Cameron County; 34%, from Hidalgo County; 2%, from Starr County; and 16%, from Willacy County.
Table 2. Description and Summary Statistic of Survey Responses
Note: SCA, sugarcane aphid.
In terms of farming management practices to control the SCA outbreak, survey results indicate that farmers implemented targeted insecticide applications to treat only the infected areas of the fields. Specifically, in 2014 all growers sprayed for the SCA, but when they did it, on average, they sprayed 84% of the total area planted. That was not the case in 2015, as 27% of the farms were not sprayed at all, and those that sprayed to control the SCA did it in 80% of their planted acreage. The decrease in insecticide applications may be related to the fact that there was a reduced number of aphids because of the adoption of insecticide-treated, tolerant hybrids, in combination with lower climate temperatures and constant rain. Additionally, endemic natural enemies (e.g., ladybugs, syrphid larvae, and parasitoids) might have reduced populations of SCA when these were at low initial colonization numbers.
The insecticide option, total quantity, and application type used have a significant impact on both the economic losses caused by the SCA and the monetary value of the potential losses prevented. Particularly, insecticide applications to control the SCA increase the cost of production, but at the same time they avert larger reduction in yield. A trend was identified concerning the choice of insecticide to control the aphids. Namely, it was found that sulfoxaflor 50% WG was the only insecticide used by surveyed growers in both years. The heavy reliance of growers on a single active ingredient to control the SCA may increase the selection pressure of the insect toward pesticide resistance. Additionally, in 2014 and 2015, sulfoxaflor 50% WG was used as a Section 18 emergency exemption label in sorghum, and its continuity in the market has been under debate (U.S. Environmental Protection Agency, 2016, 2017).
Regarding the number of insecticide applications to control the pest, survey results indicate that in 2014, on average, 1.68 insecticide applications were made compared with 0.85 applications in 2015. The higher number of insecticide applications in 2014 can be directly related to higher populations of the SCA. The distribution of the number of insecticide applications also differs between years. Although in 2014 all fields were sprayed, in 2015 we observed a decrease in the number of insecticide applications—in particular, there were more growers who sprayed only once (61%) throughout the year. The fact that most growers only sprayed one time in 2015 for the SCA may be attributed to the occurrence of detrimental weather conditions for a rapid proliferation of the pest and better control efforts to keep the SCA population at manageable levels. Particularly, in 2015 growers were more attentive to treating infected fields before the SCA became too numerous, thus having greater success with a single application.
Survey results also suggest that the recommended insecticide application rate was followed by growers. On average, growers applied sulfoxaflor 50% WG at a rate of 1.02 oz./ac. compared with the recommended rate of 0.75–1.5 oz./ac. (Knutson et al., Reference Knutson, Bowling, Porter, Bynum, Villanueva, Allen and Biles2015). Over the two years, ground application seemed to be most popular among growers with 66% of total applications being ground applications and 34% aerial applications. Based on conversations with growers, most of them decided to spray by air because their fields were too wet to get into by ground, and they feared losing the crop because of high infestations of SCA; hence aerial application was the only alternative. Furthermore, ground application of insecticide was preferred because of its lower cost and better coverage by use of higher amount of water per acre. In fact, when spraying by ground, surveyed growers used between 10 and 30 gallons of water per acre with most of them staying in the lower range of about 10 gallons per acre, and when spraying by air, growers used between 3 and 5 gallons of water per acre. On average, growers used 11.77 gallons and 9.65 gallons of water per acre on each insecticide application in 2014 and 2015, respectively.
Surfactant was used on 92% of the insecticide applications when spraying for the SCA; only three farms in 2014 and 2015 did not include surfactant in their spray application. The individual quantities of surfactant used were calculated to be equal to 0.25% of the reported amount of water used on each application. Typically, the surfactant rate ranges between 0.25% volume-to-volume ratio (v/v) and 1.0% v/v depending on the product used.
Lastly, some growers opted to plant treated tolerant hybrids to help reduce the risk associated with potential SCA outbreaks. In 2014, 24% of the fields were planted with at least one tolerant hybrid. After the severe damages experienced in 2014, the number of grain sorghum fields planted with tolerant hybrids increased to 29% in 2015. Tolerant hybrids are seen as an economically viable option to prevent substantial losses. However, initial commercial and experimental evaluations suggested that higher yields and profit margins could be achieved by using high-yielding, nontolerant hybrids together with effective monitoring and control practices (Schnell et al., Reference Schnell, Pietsch, Horn, Moreno, Rooney and Peterson2014, Reference Schnell, Pietsch, Horn, Moreno, Rooney and Peterson2015; Trostle, Reference Trostle2016).
4.2. Economic Impact of the Sugarcane Aphid on the Sorghum Industry
The economic loss associated with the SCA in equation (2) and the prevented profit loss attributed to control efforts described in equation (3) were estimated for each farmer based on reported yields and farming management practices. Individual valuations were then aggregated to calculate representative mean estimates. In order to consider differences in unobserved farm characteristics among respondents, the average profit loss because of the SCA and prevented loss were estimated as weighted means of the individual estimates with weights proportional to the stated acreage.
The estimated yearly economic losses caused by the SCA along with the mean profit reduction are shown in Table 3. On average, the mean economic loss was calculated at $64.53/ac. The major share of the loss is because of the yield penalty, which reduced revenues by $49.56/ac. The additional expenses incurred to control the SCA were estimated at $20.78/ac., including $6.49/ac. for insecticide, $2.11/ac. for surfactant, $5.00/ac. for spraying the pesticides, $1.53/ac. for planting treated tolerant hybrids, and $5.66/ac. to scout for SCA. Additionally, the yield penalty caused by the SCA infestation reduced the variable harvesting cost by $5.80/ac. Comparable economic impacts have been reported in other infected states. Specifically, Kerns et al. (Reference Kerns, Brown, Beuzelin and Guidry2015) calculated that in 2013 the SCA caused a profit loss of $66.56/ac. in Louisiana. Similar losses are expected among SCA-affected states because of analogous production practices, available control options, and observed pest behavior (Bowling et al., Reference Bowling, Brewer, Kerns, Gordy, Seiter, Elliott and Buntin2016; Brown, Kerns, and Beuzelin, Reference Brown, Kerns and Beuzelin2015; Seiter et al., Reference Seiter, Lorenz, Studebaker and Kelley2015; Villanueva et al., Reference Villanueva, Brewer, Way, Biles, Sekula, Bynum and Swart2014).
Table 3. Sugarcane Aphid Estimated and Prevented Economic Impacts
Notes: Each value represents the estimated mean over sprayed and nonsprayed fields. RGV, Rio Grande Valley.
In terms of annual losses, it was estimated that the SCA reduced profit by $73.56/ac. in 2014 and by $56.08/ac. in 2015. The main difference between years is because of the fact that a lower infestation rate was observed in 2015, which resulted in a higher proportion of untreated fields and fewer insecticide applications on those fields that sprayed to control the SCA. For illustration purposes, the results from a random sampling of 13 and 15 commercial sorghum fields in 2014 and 2015 in the RGV, respectively, are shown in Figure 1. Higher aphid populations during the months of June and July were observed in 2014. Also, the SCA scouting results summarized in Figure 1 support the fact that most growers sprayed two times to control the pest in 2014 given the recommended application threshold of 100 aphids per leaf during that time. Currently, lower thresholds have been proposed to prevent the SCA from reaching irrepressible levels (Knutson et al., Reference Knutson, Bowling, Brewer, Bynum and Porter2016). It is believed that the higher temperatures and rain-free weather during the production season of 2014 might have created the optimal conditions for faster and more aggressive aphid population growth compared with 2015 (National Oceanic and Atmospheric Administration, 2014, 2015). Besides weather variations, the damage caused by the SCA is expected to decrease over time because of a better understanding of the pest and subsequent development of more effective and diverse control strategies. Consequently, the revenue losses associated with yield damages are likely to decrease in the future. Also, implementation of cost-effective control strategies will further reduce the costs to manage subsequent SCA infestations.
Sensitivity analysis was conducted to evaluate the effect of the hypothesized yield penalties on the economic loss estimates. The magnitude of the yield penalty between years and between sprayed and nonsprayed fields was varied to estimate annual loss response surfaces. Yield penalty bounds were based on survey responses in combination with field observations and conversations with local growers. The effect of yield penalty on the estimated economic loss caused by the SCA is shown in Figure 2. In 2014, the reduction in profits because of the SCA outbreak ranged from $44.28/ac. (i.e., assuming that the SCA caused no yield reduction in sprayed fields and the observed yield penalty of 40% in nonsprayed fields) to $103.17/ac. (i.e., with yield penalties of 20% and 60% for sprayed and nonsprayed fields, respectively). Likewise, in 2015 the economic loss attributed to the SCA varied from $37.76/ac. (i.e., when yield penalties are set to 0% for sprayed fields and 15% for nonsprayed fields) to $79.88/ac. (i.e., with yield penalties of 15% and 30% for sprayed and nonsprayed fields, respectively).
Figure 2. SCA Annual Economic Loss by Yield Penalty (YP) in Sprayed and Nonsprayed Fields (note: the dot on the loss response surface denotes the reference scenario)
The sample-based estimated losses caused by the SCA were used to infer the total economic loss of the SCA in the RGV's sorghum industry. According to USDA-NASS (2015), 317,200 and 314,100 acres of sorghum were planted in the region in 2014 and 2015, respectively. Aggregated impacts were calculated by multiplying the estimated annual loss by the corresponding annual sorghum acreage. It is estimated that in 2014 the SCA caused a total economic loss to farmers in the RGV of about $23.33 million. In 2015, the economic loss was calculated to be equal to $17.62 million. Therefore, after its appearance in 2013,Footnote 5 the overall reduction in profits because of the SCA infestation in the RGV was estimated at $40.95 million. The aggregated economic loss represented about 19% of the total value of sorghum production in the RGV during the 2014 and 2015 growing seasons (Salinas and Robinson, Reference Salinas and Robison2015).
Empirical results also indicate that farmers’ control efforts reduced the economic loss caused by the SCA outbreak. Particularly, it is estimated that those growers who sprayed to control the pest, on average, were able to protect $103.08/ac. in revenues at a cost of $28.11/ac. Thus, for every dollar expended controlling the pest, farmers were able to save $3.67. Regarding prevented profit losses on sprayed fields, it was estimated that control efforts aimed at mitigating the damage caused by the SCA lessened profit losses by $86.59/ac. and $22.80/ac. in 2014 and 2015, respectively. When considering both sprayed and nonsprayed fields, prevented profit losses were estimated at $72.48/ac. in 2014 and $7.94/ac. in 2015 (Table 3). Finally, at the aggregate level, the total prevented loss attributed to control efforts in the RGV was equal to $22.99 million and $2.49 million in 2014 and 2015, respectively.
4.3. Region-wide Economic Impacts
Induced agricultural income losses outweighed the positive impacts of additional spending on aphid control. Overall losses in the RGV economy were greater in 2014, totaling $38.78 million in output, $31.70 million in value added, and $27.08 million in labor income, as well as 103 full- and part-time jobs (Table 4). Again, labor income is a component of value added, which is a component of output, so those figures cannot be summed. The $23.33 million in 2014 farm profit loss (Table 3) resulted from lost revenue mitigated by lower harvest costs as well as increased pesticide costs because of aphid damage. In this case, lost profits constituted lost output in the region and lost household income. Overall, the lost farm profits resulted in $29.19 million in lost labor income and $43.34 million in lost output throughout the RGV economy. Additional expenditures for treated tolerant seed, scouting, and insect control resulted in an additional $7.31 million in output and 142 full- and part-time jobs across the regional economy. However, reduced harvest spending resulted in a loss of $2.75 million in output and 57 jobs across the regional economy.
Table 4. Observed Economic Impacts of Sugarcane Aphid Outbreak in South Texas
In 2015, economy-wide losses in Cameron, Hidalgo, Starr, and Willacy counties totaled $31.21 million in output, $25.21 million in value added, $21.43 million in labor income, and 116 jobs (Table 4). Farm profit losses were reduced relative to 2014 because of mostly lower pesticide costs along with smaller aphid-related losses. Farmers took their losses at harvest, with savings on harvest costs greater than spending on pesticides. In fact, 2015 harvest spending was reduced relative to even 2014 levels. Employment losses were more severe in 2015 because of decreased spending on pesticide- and harvest-related costs relative to 2014. On average in 2014 and 2015, regional losses totaled $34.99 million in output, $28.45 million in value added, $24.26 million in labor income, and 110 jobs.
Observed losses in the RGV economy were substantial. However, they would have been greater had farmers not taken measures to control the SCA. Without control efforts, the regional economy would have faced an additional $35.27 million in direct losses and $64.62 million in output, $50.40 million in value added, $42.56 million in labor income, and 376 jobs across the entire RGV economy in 2014 (Table 5). Most prevented losses were because of preserving farm-level sorghum revenue, but aphid control also limited crop abandonment and prevented additional harvest losses in the agriculture support sector. Farm revenue losses are the largest component of the regional economic impacts. As with farm-level revenue, the regional losses are likely to decrease in the future as farmers adopt more cost-effective pest management strategies.
Table 5. Economic Impacts of Prevented Losses in South Texas
Aphid control efforts protected $15.00 million in output, $11.64 million in GDP contribution, $9.82 million in labor income, and 93 jobs in 2015. On average, control measures preserved $39.81 million in output, $31.02 million in value added, $26.19 million labor income, and 235 full- and part-time jobs. Farmer's efforts to control aphids mitigated more economic losses than were incurred in 2014 (i.e., prevented losses were greater than observed losses for both farmers and the overall economy). A favorable climate in 2015 limited aphids so farmers and the economy experienced both lower actual and prevented losses, although they experienced fewer losses than expected with no control efforts. Still, on average the losses farmers prevented were greater than realized losses.
5. Summary and Conclusions
The SCA has become the most damaging pest in U.S. sorghum production since its detection in 2013. Despite its demonstrated crop devastation capability, little work has been conducted to assess and better understand the economic implications of the SCA outbreak. This study provided some empirical evidence of the economic damage occasioned by the SCA infestation. This study presented a comprehensive assessment of the economic impact caused by the SCA in the RGV, Texas, where about 11.5% of the state sorghum production is located. With this aim, local producers were surveyed resulting in a representative sample of 46,578 acres in 2014 and 49,761 acres in 2015. The questionnaire gathered detailed information about yearly crop yields, crop acreage, insecticide application decisions, and management and production practices. Collected data were used to estimate the reduction in growers’ profit associated with the SCA infestation, as well as the economic value of the prevented loss attributed to control efforts. Aggregated farm-level economic loss estimates were then used to assess the total economic impact of the SCA outbreak in the RGV economy.
SCA infestation affects farmers’ profits by increasing the production cost because of the additional cost to monitor and control the pest, and by reducing revenues because of lower yields. Estimation results suggest that on average the SCA caused a loss of $64.53/ac. between 2014 and 2015. The major share of the loss was attributable to the decrease in yields, which reduced revenues by $49.56/ac. The total cost to control the aphids was estimated at $20.78/ac., including insecticide, surfactant, application, treated tolerant hybrids, and pest scouting costs. The SCA also caused a reduction in the variable harvesting cost of $5.80/ac. In terms of annual losses, it was estimated that the SCA reduced profit by $73.56/ac. in 2014 and by $56.08/ac. in 2015. The difference in losses between years is attributed to a higher infestation rate in 2014, caused by optimal weather conditions that favored the rapid growth and spread of the aphids. Results also suggest that after it appearance in 2013, the SCA has caused a total economic loss to farmers in the RGV of about $40.95 million. Namely, farmers’ profits were reduced by $23.33 million and $17.62 million in 2014 and 2015, respectively. The aggregated economic loss represented about 19% of the total value of sorghum production in the RGV.
Control efforts aimed at mitigating the negative effects of the pest contributed significantly to reducing the economic impact caused by the SCA infestation. Empirical results suggest that for every dollar expended controlling the SCA, farmers protected $3.67. Results also indicate that the profit loss in treated fields was reduced by $86.59/ac. and $22.80/ac. in 2014 and 2015, respectively. Overall, RGV's sorghum producers were able to protect $22.99 million in 2014 and $2.49 million in 2015.
Farmers’ profit losses were magnified in the regional economy. Additional local spending on insect control was dwarfed by losses in farm revenues (output) and reduced harvest expenditures. Regional value added (GDP) was decreased by $31.70 million in 2014 with severe aphid infestations and $25.21 million in 2015 with a moderate SCA population (average of $28.45 million). Job losses were more severe in 2015 with reduced pesticide application and harvest expenditures (116 full- and part-time jobs in 2015 as compared with 103 in 2014, for an average of 110). Regional losses would likely have been worse in 2015 if farmers had not planted fewer sorghum acres.
In 2014 and on average, farmers prevented greater losses to themselves and the economy they experienced. Despite control efforts, aphids inflicted $38.78 million in lost output, $31.70 million in lost value added, $27.08 million in lost labor income, and 103 lost jobs in 2014. However, farmers’ control efforts prevented additional losses of $64.62 million in output, $50.40 million in value added, $42.56 million in labor income, and 376 jobs. On average, the RGV economy experienced aphid-related losses of $28.45 million in value added and 110 jobs, but farmers prevented additional losses of $31.02 million in GDP and 235 jobs.
It is important to mention that the loss calculations presented in this study are short term in nature and do not consider the impacts of farmers switching from sorghum production to other crops or of new aphid-tolerant varieties or new aphid control measures becoming available. Any resulting changes in crop prices associated with reduced sorghum supply or crop mix adjustments because of the SCA outbreak are not considered in the analysis. Additionally, further studies are needed to develop a dynamic intertemporal model that takes into consideration the interactions between SCA population growth, control method effectiveness, and weather conditions. Such models could assist scientists in identifying the optimal control mechanics. This study also exposed the need to develop more diverse control strategies that combine a broad range of cultural methods, novel varieties, and chemical and biological control alternatives.
Finally, given the wide dispersion of the SCA across the United States, this study can serve as a reference for future economic studies dealing with a larger and disparate geographic scope. Particularly, subsequent research efforts will include expanding this economic valuation study statewide.


 Open access