


Introduction
The situation of child undernutrition in developing countries in general and India in particular has been a matter of concern for the last few decades and continues to be so even today (Swaminathan et al., Reference Swaminathan, Hemalatha, Pandey, Kassebaum, Laxmaiah, Longvah and Lodha2019; Development Initiatives, 2020). Within India, studies have found that there are huge variations in the prevalence of and rate of reduction in child malnutrition not only at the state level but also at the district level in India (Khan and Mohanty, Reference Khan and Mohanty2018; Swaminathan et al., Reference Swaminathan, Hemalatha, Pandey, Kassebaum, Laxmaiah, Longvah and Lodha2019; Singh et al., Reference Singh, Srivastava and Upadhyay2019; Hemalatha et al., Reference Hemalatha, Pandey, Kinyoki, Ramji, Lodha, Kumar and Kassebaum2020). However, there is a general lack of scholarship on child undernutrition at the sub-district level. A recent study (Swaminathan et al., Reference Swaminathan, Hemalatha, Pandey, Kassebaum, Laxmaiah, Longvah and Lodha2019) on the burden of child malnutrition across the parliamentary constituencies (PCs) of India brings in a different dimension to this debate. Unlike districts, which are administrative units, PC boundaries are political in nature. Each constituency elects a member of parliament who can play a key role in the development of their constituencies, including improvements in child health, and can also be held accountable by the electorate. In line with this rationale, this paper takes Indian PCs as the unit of analysis.
Swaminathan et al. (Reference Swaminathan, Hemalatha, Pandey, Kassebaum, Laxmaiah, Longvah and Lodha2019) derived child malnutrition estimates for all the 543 PCs in India by developing two geographic information system (GIS) methodologies. They used the individual level data from the fourth National Family Health Survey conducted in 2015–16. This present paper uses data from the Parliamentary Constituency Factsheet for Indicators of Nutrition, Health and Development in India to examine spatial heterogeneity in undernutrition across the 543 PCs (Kim et al., Reference Kim, Swaminathan, Swaminathan, Kumar, Rajpal, Blossom and Joe2019). In India, PCs are a critical geopolitical unit where elected parliamentarians and/or their parent political parties may make election promises and implement programmes to improve the socio-economic condition of their electorate. Hence, a focus on undernutrition among children at the PC level will be of greater policy and political significance.
Lack of food is not the sole reason for undernutrition among children. The nutrition status of children is determined by various factors like biological factors, socio-economic and behavioural factors, and environmental factors, and in addition to these government policies and political commitment of the elected representatives play a very significant role. Biological causes like exposure to diseases also increase the risks posed to health by undernutrition. Many studies have established the significant relationship between diseases, such as malaria, bacterial infections, poorer protein and micronutrient status, and immune dysfunction, and undernutrition among children (Gaiha et al., Reference Gaiha, Raghbendra and Vani2014; Arthur et al., Reference Arthur, Nyide, Soura, Kahn, Weston and Sankoh2015; Bourke et al., Reference Bourke, Berkley and Prendergast2016). This implies the need for better policies and programmes related to increasing sanitisation and hygiene facilities both at a community level and public health facilities and implementation of vitamin-supplementation programmes at community level, which should be some of the priorities of the political representatives in order to uplift the status of their respective constituencies. Hence, it is necessary to understand these parameters in a political context.
The fourth National Family Health Survey has reported very high levels of stunting, underweight, and wasting among children under-5 years of age in India (International Institute for Population Sciences (IIPS) and ICF, 2017). The studies among children in low- and middle-income countries have shown that the key correlates of undernutrition include mother’s body mass index (BMI), socio-economic status of the household, household sanitation, women’s education, and child immunisation (Kumar et al., Reference Kumar, Goel, Mittal and Misra2006; Panigrahi and Das, Reference Panigrahi and Das2014; Singh et al., Reference Singh, Chaudhary, Joshi, Upadhyay, Singh and Katyal2016; Sultana et al., Reference Sultana, Rahman and Akter2019). In addition, the inadequate antenatal care services and delivery assistance from health professionals also tend to have poor nutritional outcomes (Ghosh-Jerath et al., Reference Ghosh-Jerath, Devasenapathy, Singh, Shankar and Zodpey2015; Rode, Reference Rode2018).
These studies used data from the National Family Health Surveys and provided spatial patterns and variations in child malnutrition at district or regional level, not at the PC level. This paper extends this research by focusing on PCs and by employing spatial techniques. GIS in conjunction with spatial analytical approaches provides insights that are not possible with conventional non-spatial statistical techniques. They help uncover the clustering of the low and high values of a parameter across an area or, technically, the degree of spatial autocorrelation in an area (Parson and Frost, Reference Parsons and Frost2000). They also help understand the associations between geography and child undernutrition and its various socio-economic determinants (Kim et al., Reference Kim, Mejia-Guevara, Corsi, Aguayo and Subramanian2017; Ghosh, Reference Ghosh2020).
Data and methods
Data
The PC-level estimates used in this current study were obtained from the Parliamentary Constituency Factsheet for Indicators of Nutrition, Health and Development in India developed by Kim and colleagues (Reference Kim, Swaminathan, Swaminathan, Kumar, Rajpal, Blossom and Joe2019). They developed two GIS methodologies to derive the PC level estimates of Nutrition Health and Development by building a crosswalk between districts and PCs in India. They combined data from two key sources: National Family Health Survey IV (NFHS-4, 2015-16) District Factsheets and National Sample Survey, 2010–11, 2011–12, and 2014. The methodologies used to calculate the estimates for PCs are provided in Swaminathan et al. (Reference Swaminathan, Hemalatha, Pandey, Kassebaum, Laxmaiah, Longvah and Lodha2019) and Blossom et al. (Reference Blossom, Swaminathan, Joe, Kim and Subramanian2019). The India 543 PC boundary shapefile was downloaded from Github (https://github.com/datameet/maps/tree/master/parliamentary-constituencies).
Outcome variable
The three indicators of undernutrition among children under 5 considered were stunting, underweight, and wasting. In line with WHO definition, a child was considered stunted – if their height for age was less than minus 2 standard deviations of the WHO Child growth standards median; wasted – if their weight for height was less than minus 2 standard deviations of the median; and underweight – if their weight for age was less than minus 2 standard deviations of median.
Predictor variables
A set of indicators were selected from the factsheet provided by Kim et al. (Reference Kim, Swaminathan, Swaminathan, Kumar, Rajpal, Blossom and Joe2019) in their study. Household characteristics included poverty head count ratio and the use of sanitation facility. The maternal characteristics included: percentage of women with 10 or more years of schooling, percentage of 20–24-year-olds married before the age of 18, percentage of mothers who had at least four antenatal care visits, and percentage of women with BMI below 18.5 kg/m2. Delivery care was measured in terms of the percentage of institutional births, and the child health variables included percentage of children aged 12–23 months who received adequate diet and percentage of children aged 6–59 months who were anaemic.
Methods
Spatial statistical techniques were applied to explore the spatial distribution and autocorrelation of the child undernutrition indicators and its predictors across PCs.
The local indicator of spatial association (LISA) was used to identify the presence and absence of statistically significant spatial clusters and outliers for each region. The spatial weight matrix was computed using the queen contiguity, which is based on sharing the polygon’s vertices; neighbours were given a weight of 1 and non-neighbours a zero value. Spatial autocorrelation was measured using the Local Moran’s I, index ranging from -1 to +1. A positive Local Moran’s I denotes spatial clustering, indicating the presence of clusters with similar values surrounding one another, whereas a negative Moran’s I denotes spatial outliers, that is, observations with dissimilar values surrounding each other (regions with high values surrounding regions with low values and vice-versa). And a Moran’s I value of zero signifies a lack of spatial autocorrelation, that is, the parameter’s values are randomly distributed across space.
Univariate and bivariate LISA statistics, used in the study, measure the magnitude of spatial non-stationery and clustering to its neighbourhood values. A local Moran’s I statistic for an observation $i$
is defined as (Anselin, Reference Anselin1995):
$i$
is defined as (Anselin, Reference Anselin1995):
 $${I_i} = {Z_i}\mathop \sum \nolimits_j {w_{ij}}\;{z_j}$$
where observations ${z_i},{z_j}{\rm{\;are\;in\;deviations\;from\;the\;mean\;from\;}}{i^{th}}\ {\rm{location\;to\;}}{j^{th}}{\rm{\;location}},$
and the summation over j such that only neighbouring values j ε neighbourhood Ji are includedand wij is a spatial weight measuring the nearness of subareas i and j:
${z_i},{z_j}{\rm{\;are\;in\;deviations\;from\;the\;mean\;from\;}}{i^{th}}\ {\rm{location\;to\;}}{j^{th}}{\rm{\;location}},$
and the summation over j such that only neighbouring values j ε neighbourhood Ji are includedand wij is a spatial weight measuring the nearness of subareas i and j:
The LISA significance map, in shades of green levels of significance, presents the regions with statistically significant local Moran’s I values. And these significant locations colour-coded by the categories of spatial autocorrelation are illustrated through the LISA cluster map. The bivariate LISA gave the functionality of two different parameters, one for the location and another for the weighted average of its neighbours. Y-variable is the one with the spatial lag, that is, the weighted average of the neighbours.
Spatial regression models were used to examine the spatial relationships between levels of undernutrition among children and socio-economic predictors at the level of PC.
The degree of spatial autocorrelation in the error term and the conforming Moran’s I statistic was calculated through ordinary least square (OLS) regressions for children stunted, underweight, and wasted. The OLS models established spatial dependence in its error term for all the three dependent variables; hereafter, two spatial regression models were employed: spatial lag model (SLM) and spatial error model (SEM). The SLM assumes that the dependent variable’s observations are affected in the neighbourhood areas and, on the other hand, the SEM accounts for missing variable’s influence on the outcome variable and captures the spatial dependence in the error term (Anselin et al., Reference Anselin, Syabri and Kho2006; Khan and Mohanty, Reference Khan and Mohanty2018)
The multiple linear regression model is specified as:
 $$Yi = \alpha \; + \;{\beta _1}{A_i} + \;{\beta _2}{B_i}\; + {\beta _3}{C_i}\; + \;{\beta _4}{D_i} + \;{\beta _5}{E_i}\; + {\beta _6}\;{F_i} + \;{\beta _7}{G_i} + {\beta _8}{H_i}\; + \;{\beta _9}{I_i}$$
Here, Yi = % children undernourished (stunted/underweight/wasted) in the ith PC; i (1, 2, … , 543) = the number of PCs; Ai = % poverty head count ratio in the ith PC; ${B_i} = \;\% {\rm{\;households\;using\;improved\;sanitation\;facility\;in\;the}}\;{i^{{\rm{th}}}}\;{\rm{PC}};\;$ ${C_i} = \;\% {\rm{\;women\;with\;10\;or\;more\;years\;of\;schooling\;in\;the\;}}{i^{{\rm{th}}}}{\rm{\;PC}};\;$ ${D_i} = \;\% \;{\rm{institutional\;births\;in\;the\;}}{i^{{\rm{th}}}}{\rm{\;PC\;}};\;$ ${E_i} = \;\% {\rm{\;women\;who\;have\;had\;atleast\;four\;ANC\;visits\;in\;the\;}}{i^{{\rm{th}}}}{\rm{\;PC}};\;$ ${F_i} = \;\% {\rm{\;women\;whose\;BMI\;was\;below\;18}}{\rm{.5\;kg/}}{{\rm{m}}^{\rm{2}}}{\rm{\;in\;the\;}}{i^{{\rm{th}}}}{\rm{\;PC}};\;$ ${G_i} = \;\% \;{\rm{women\;aged\;20 - 24\;years\;married\;before\;age\;18\;years\;in\;the\;}}{i^{{\rm{th}}}}{\rm{\;PC}};\;$ ${H_i} = \;\% {\rm{\;children\;aged\;6 - 59\;months\;who\;were\;anaemic\;in\;the\;}}{i^{{\rm{th}}}}{\rm{\;PC}};$ $\;{I_i} = {\rm{\;\% \;children\;aged\;6 - 23\;months\;who\;received\;an\;adequate\;diet\;in\;the\;}}{i^{{\rm{th}}}}{\rm{\;PC}}\;$
.
$\;{I_i} = {\rm{\;\% \;children\;aged\;6 - 23\;months\;who\;received\;an\;adequate\;diet\;in\;the\;}}{i^{{\rm{th}}}}{\rm{\;PC}}\;$
.
The SLM is based on the assumption that the outcome variable in one region is influenced by the outcome variable in the neighbouring region. This can be expressed as follows:
 $$Yi = \;\delta \;\mathop \sum \nolimits_{j \ne i} Wij\;Yj + \beta Xj\; + \;\varepsilon j\;$$
Here, $\ {Y_i} = \;\% {\rm{\;children\;undernourished\;}}\left( {{\rm{stunted}}/{\rm{underweight}}/{\rm{wasted}}} \right){\rm{\;in\;the\;}}{i^{th}}{\rm{\;PC}};{\rm{\;}}$ $\delta = {\rm{spatial\;autoregressive\;coefficient}};\;\,{W_{ij}} = \;{\rm{spatial\;weight\;of\;proximity\;between\;PC}}\;i\;{\rm{and}}\;j;\;$ ${Y_j} = \% {\rm{\;children\;undernourished\;}}\left( {{\rm{stunted}}/{\rm{underweight}}/{\rm{wasted}}} \right){\rm{\;in\;the\;}}{j^{th}}{\rm{\;PC}};$ ${\beta _j} = {\rm{coefficient}};\;{X_j} = {\rm{predictor\;variable,\;and}}\;{\varepsilon _j} = {\rm{residual}}{\rm{.}}$
The spatial error model is stated as follows:
 $$Yi = \;\beta Xj\; + \;\lambda \mathop \sum \nolimits_{j \ne i} Wij\;Yj + \beta Xj\varepsilon j\; + \;\varepsilon i\;$$
Here, $\ {Y_i} = \;\% {\rm{\;children\;undernourished\;}}\left( {{\rm{stunted}}/{\rm{underweight}}/{\rm{wasted}}} \right){\rm{\;in\;the\;}}{i^{th}}{\rm{\;PC}};{\rm{\;}}$ $\lambda = {\rm{spatial\;autoregressive\;coefficient}};\;{W_{ij}} = \;{\rm{spatial\;weight\;of\;proximity\;between\;PC\;}}i\;{\rm{and}}\;j;\;$ ${Y_j} = \;\% {\rm{\;children\;undernourished\;}}\left( {{\rm{stunted}}/{\rm{underweight}}/{\rm{wasted}}} \right){\rm{\;in\;the\;}}{j^{th}}{\rm{\;PC}};$ ${\beta _j} = {\rm{coefficient;}}\;{X_j} = {\rm{predictor\;variable,\;and}}\;{\varepsilon _j} = {\rm{residual}}.$
Across all 543 PCs, the localised geographically weighted regression models were used to explore the spatially diverse associations among child nutritional indicators and their related factors. The presence of spatial heterogeneousness within the model and understanding how location influenced non-uniform relationships was studied, allowing for a more nuanced understanding of unseen probable local causes of undernutrition across the examined constituencies.
In this model, the coefficients of each of the correlates are calculated separately for each of the geographic region within the i th constituency. The assumption is that data points in closer proximity to the i th constituency carry more weight during coefficient calibration than the ones located farther away (Fotheringham et al., Reference Fotheringham, Brunsdon and Charlton2003).
The geographically weighted regression (GWR) model is based on the below formula:
 $${Y_i} = \;{\beta _0}\left( {{u_i},{v_i}} \right)\; + \mathop \sum \nolimits_{j = 1}^k \;{\beta _j}\left( {{u_i},{v_i}} \right){X_{ij}} + \;{\varepsilon _i}$$
Here, ${Y_i}$
= prevalence of children undernourished at the
${Y_i}$
= prevalence of children undernourished at the ${i^{th}}$
constituency;
${i^{th}}$
constituency; $\;{\beta _0}$
= local intercept;
$\;{\beta _0}$
= local intercept; ${u_i},{v_i}$
= geographical coordinates of the centroid;
${u_i},{v_i}$
= geographical coordinates of the centroid; $k$
= number of correlates;
$k$
= number of correlates; $\;{\beta _j}$
= locally estimated regression coefficient of the
$\;{\beta _j}$
= locally estimated regression coefficient of the ${j^{th}}$
correlate;
${j^{th}}$
correlate; ${X_{ij}}$
= value of the
${X_{ij}}$
= value of the ${j^{th}}$
correlate, and εi = error term. (Biswas, Reference Biswas2022).
${j^{th}}$
correlate, and εi = error term. (Biswas, Reference Biswas2022).
The software packages GeoDa and Arc GIS Pro were used to conduct the spatial analyses.
Results
Univariate Local Moran’s I results
The prevalence maps for the three indicators of children undernourished – stunting, underweight, and wasting – are presented in Figures 1–3. Figures 1–3 indicate that a much greater proportion of children were stunted and underweight than wasted. In 20% of PCs, about two out of five children under-five years of age were stunted or underweight, and one in five children were wasted. These high prevalence constituencies were located predominantly in northern states, with the exception of Karnataka in the south. Intra-state variation in the prevalence of undernourishment was also more evident in Maharashtra, Odisha, and Karnataka than in other states.
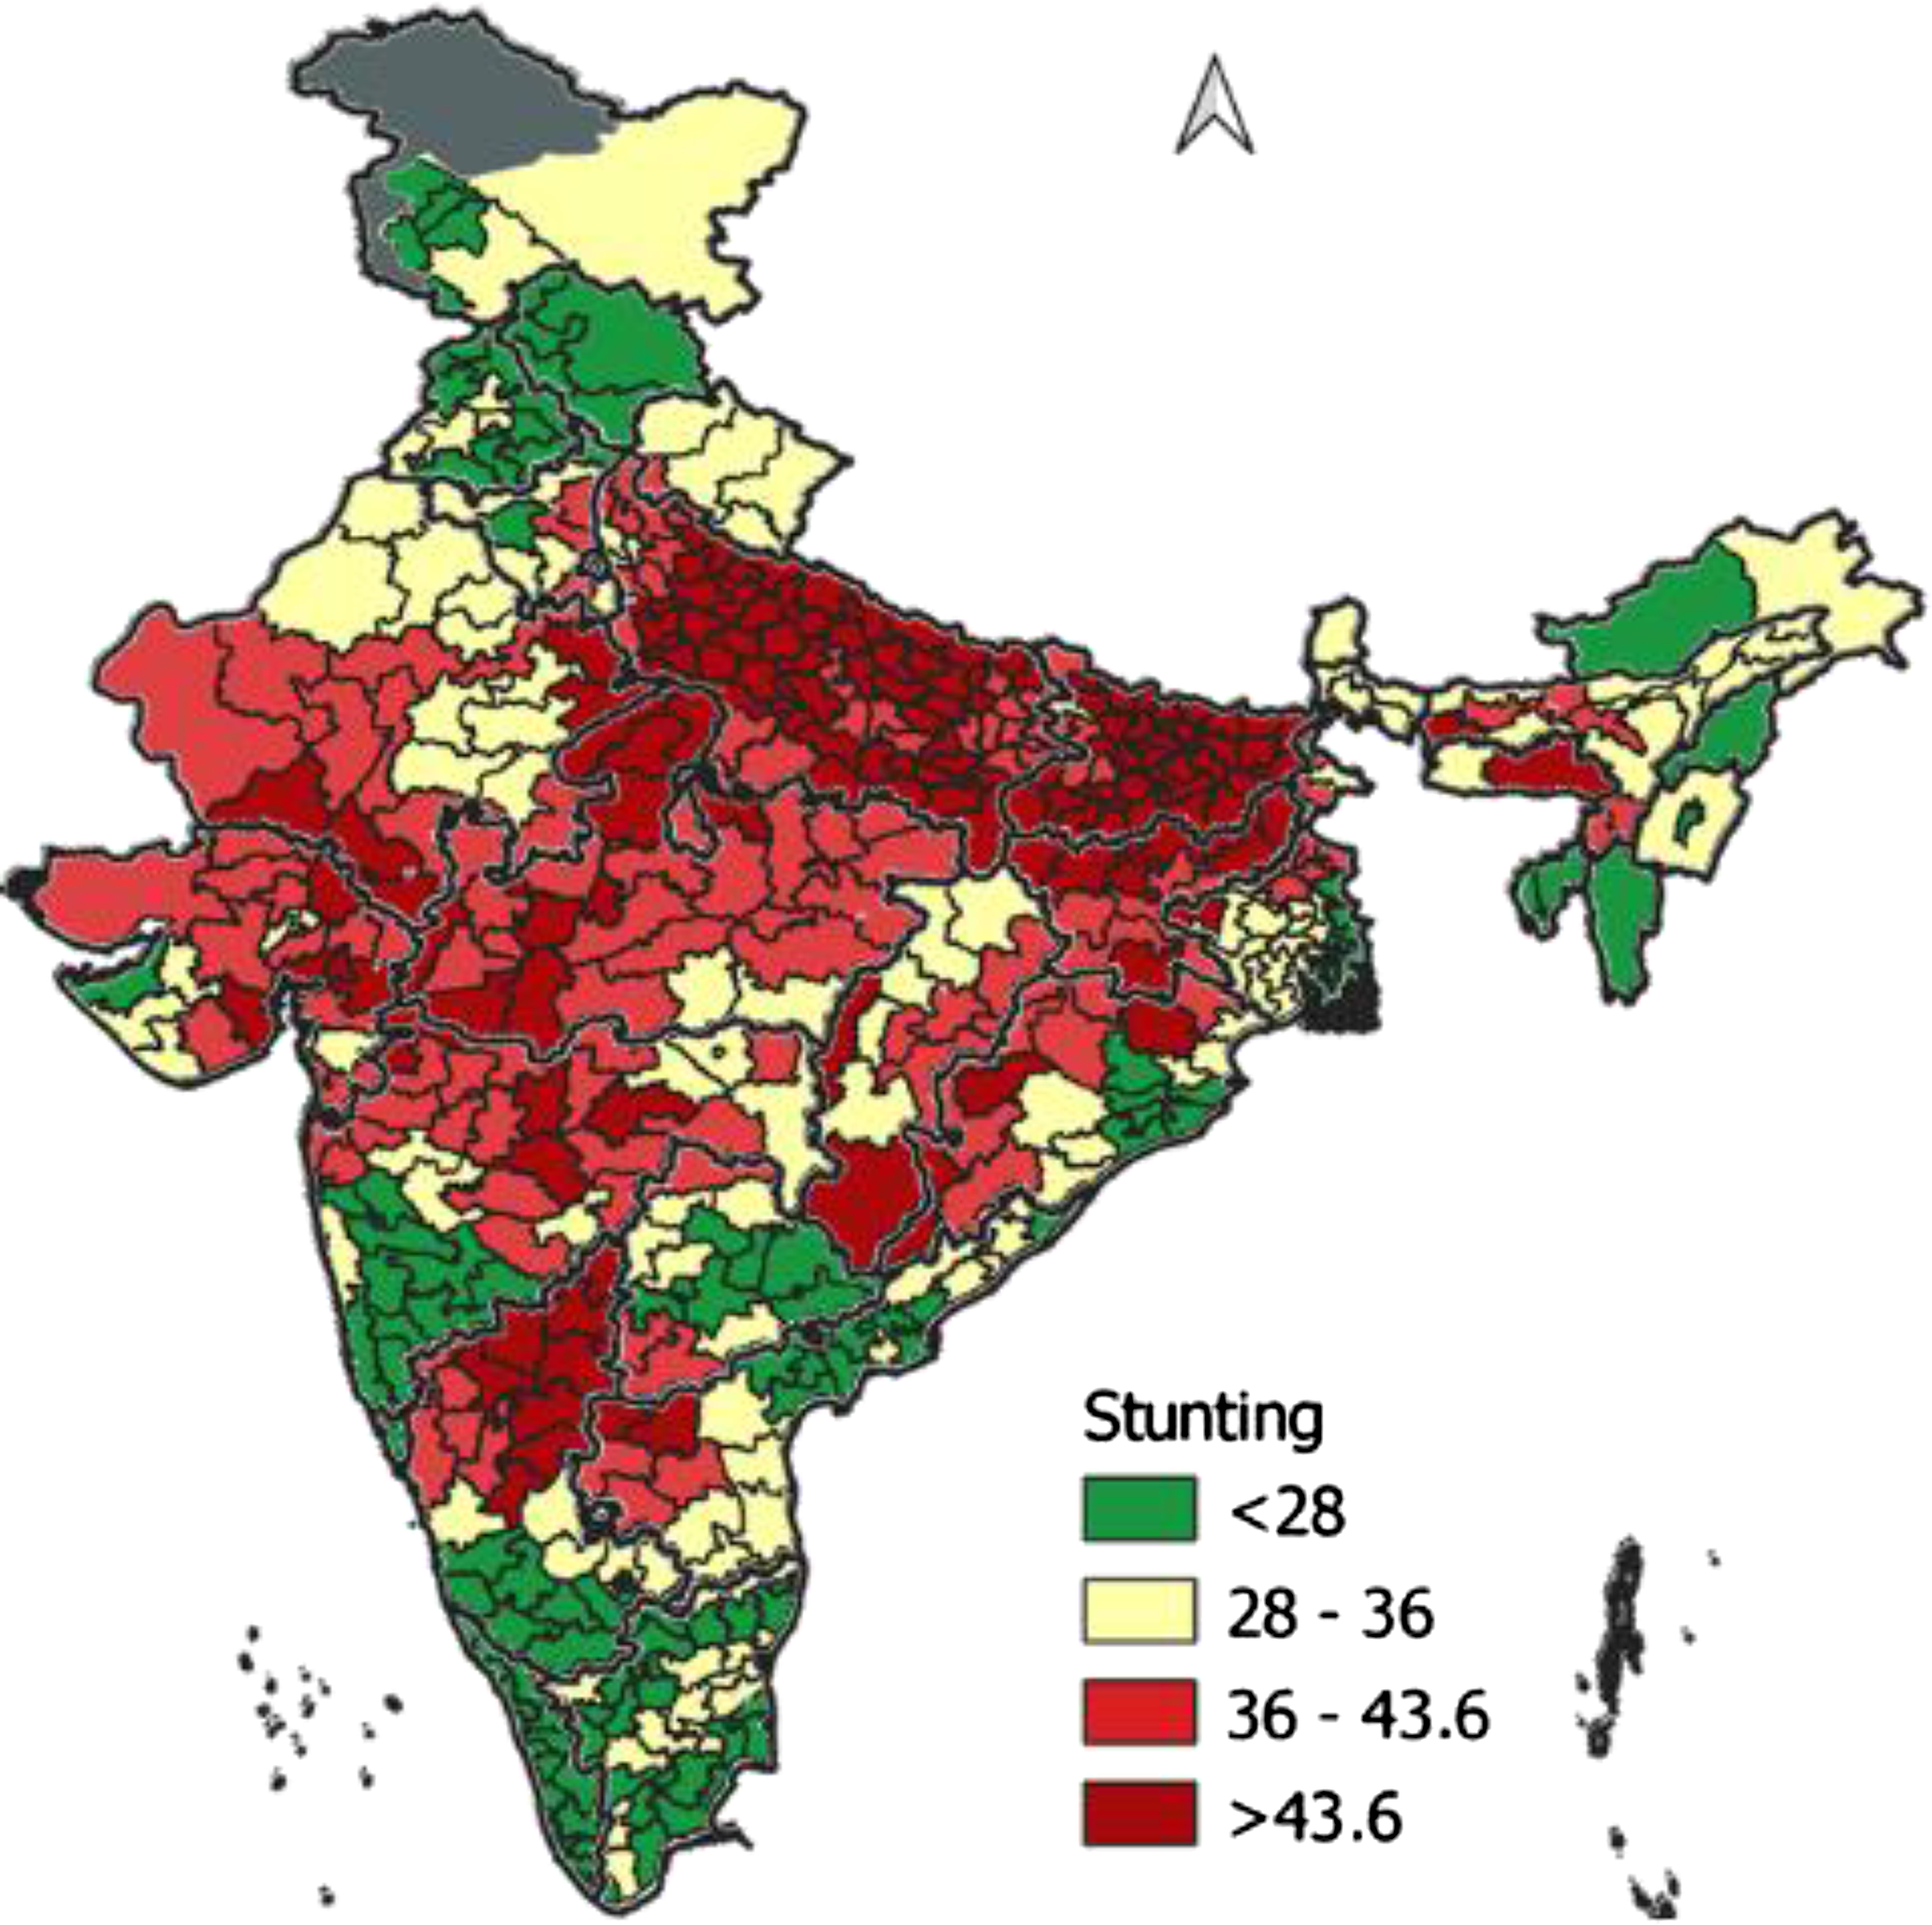
Figure 1. Percentage of children stunted across parliamentary constituencies, India, 2015–16.
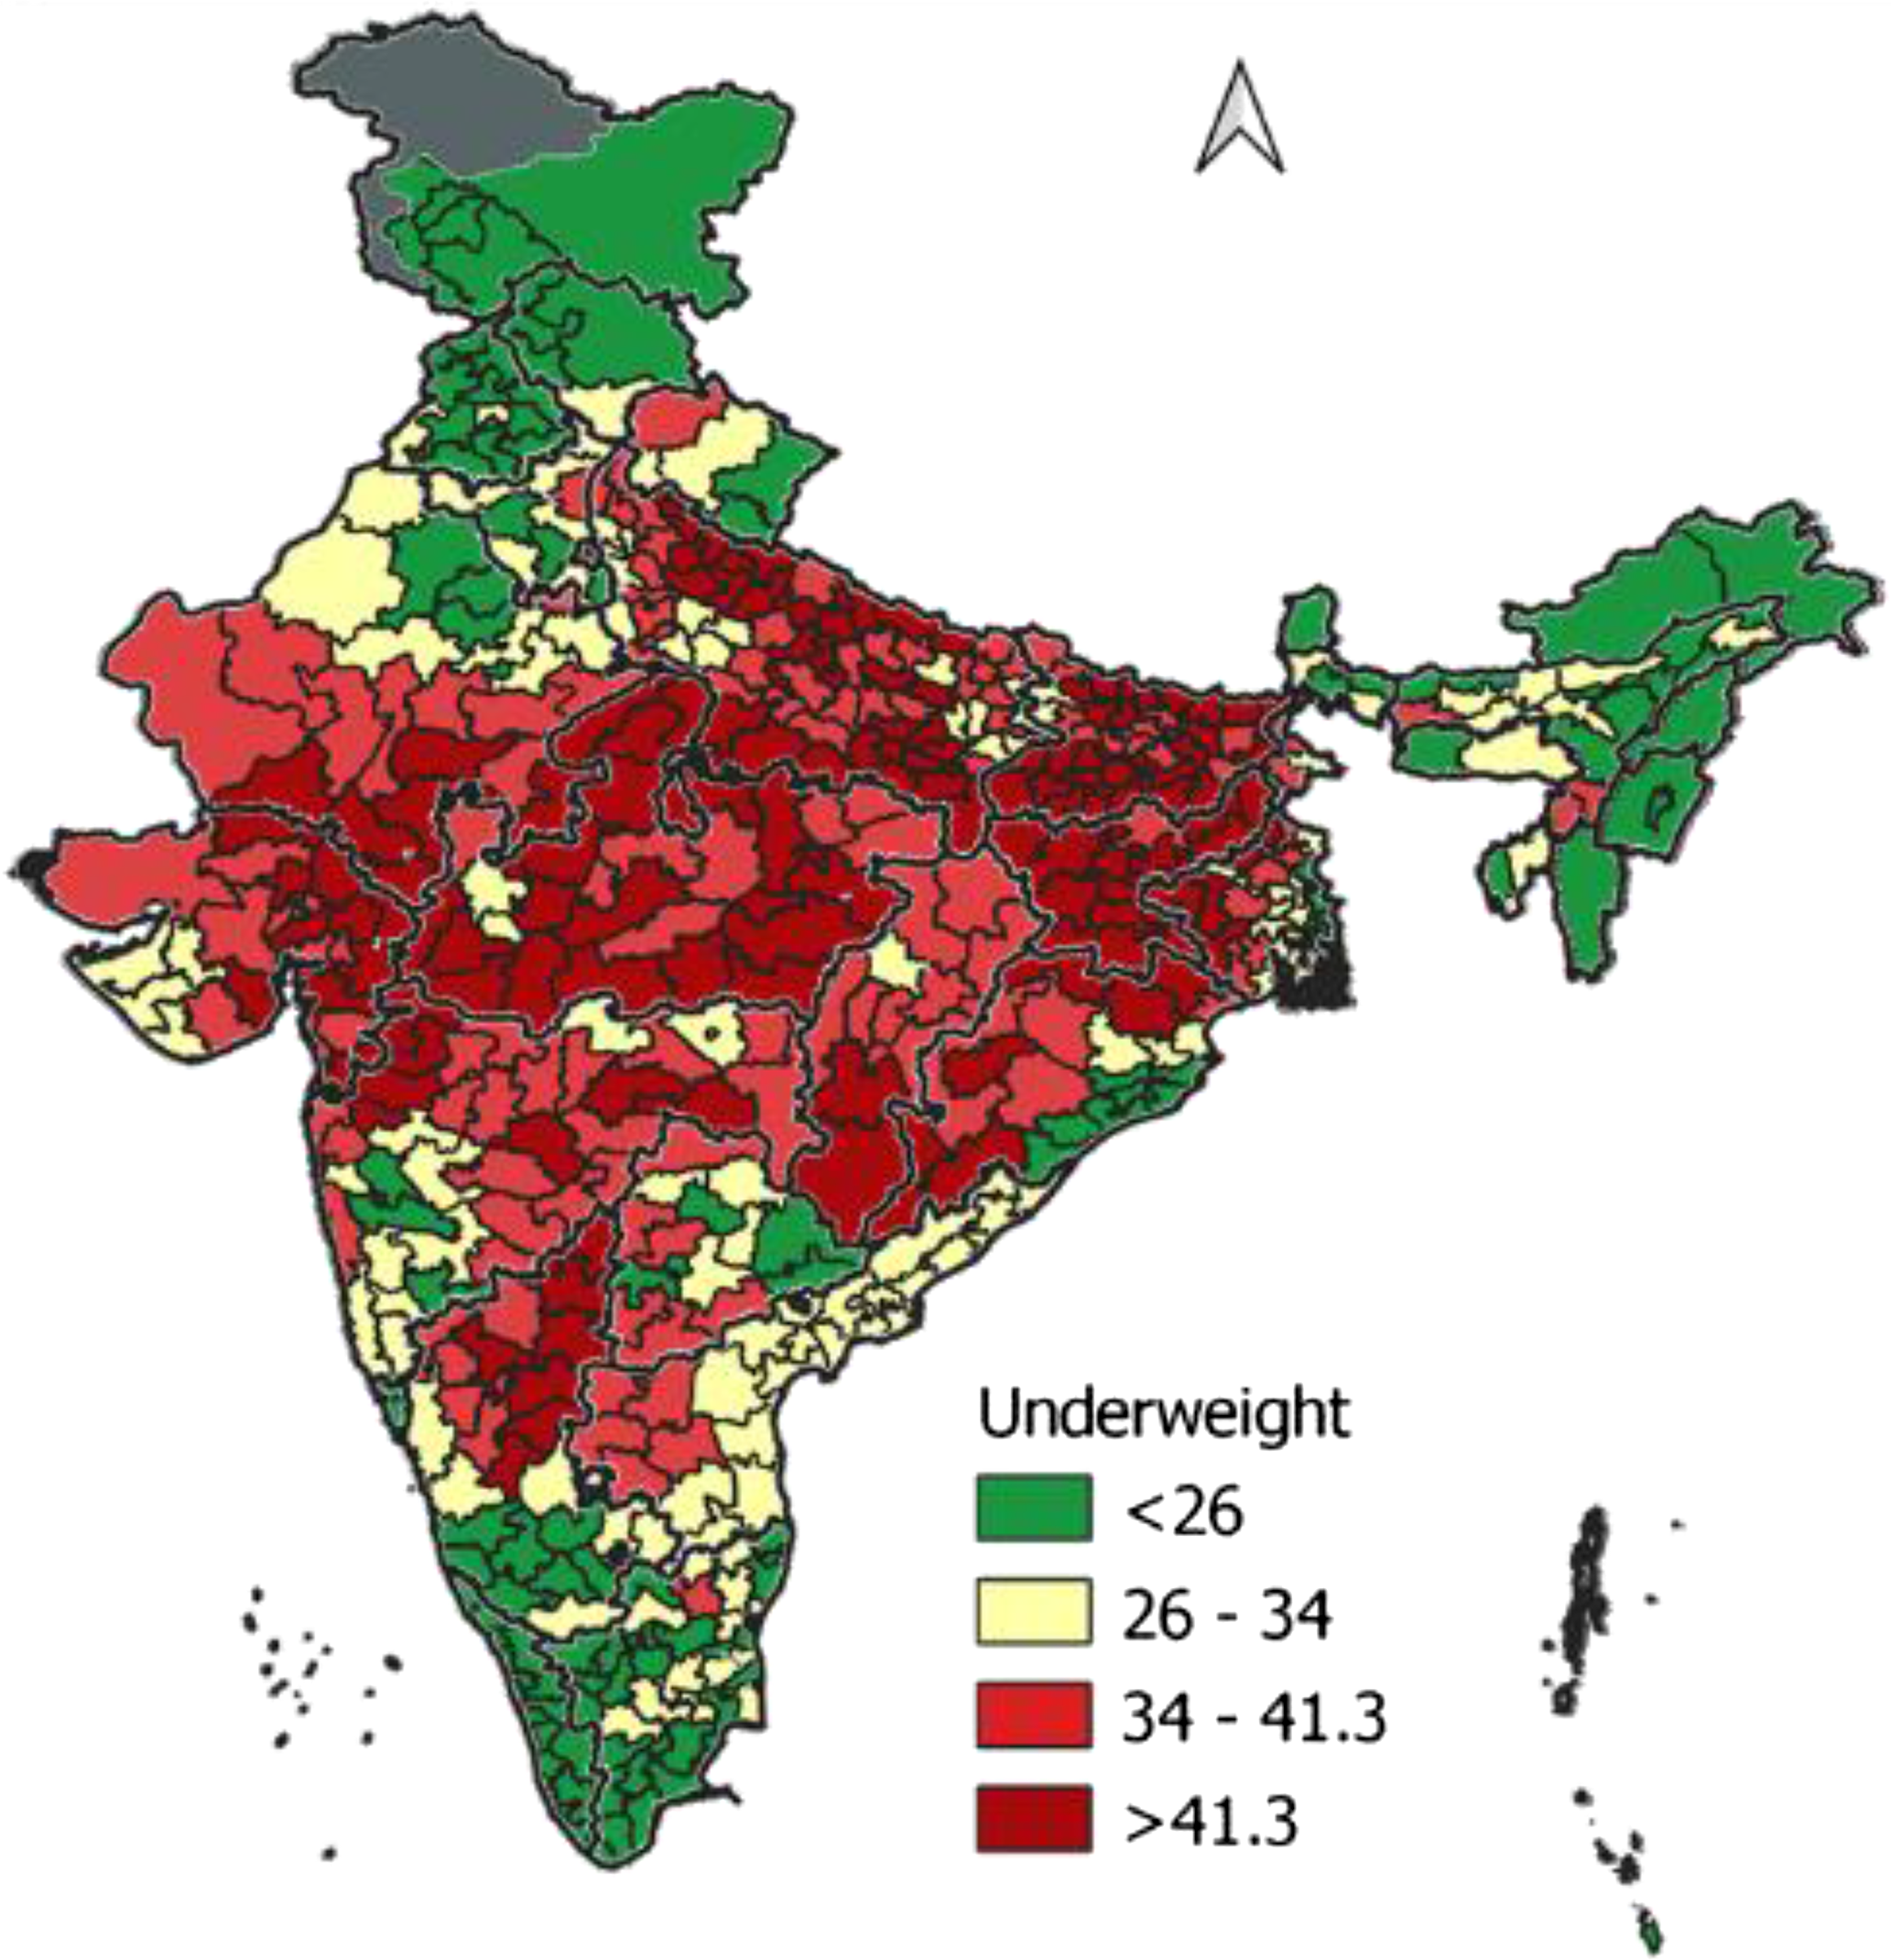
Figure 2. Percentage of children underweight across parliamentary constituencies, India, 2015–16.
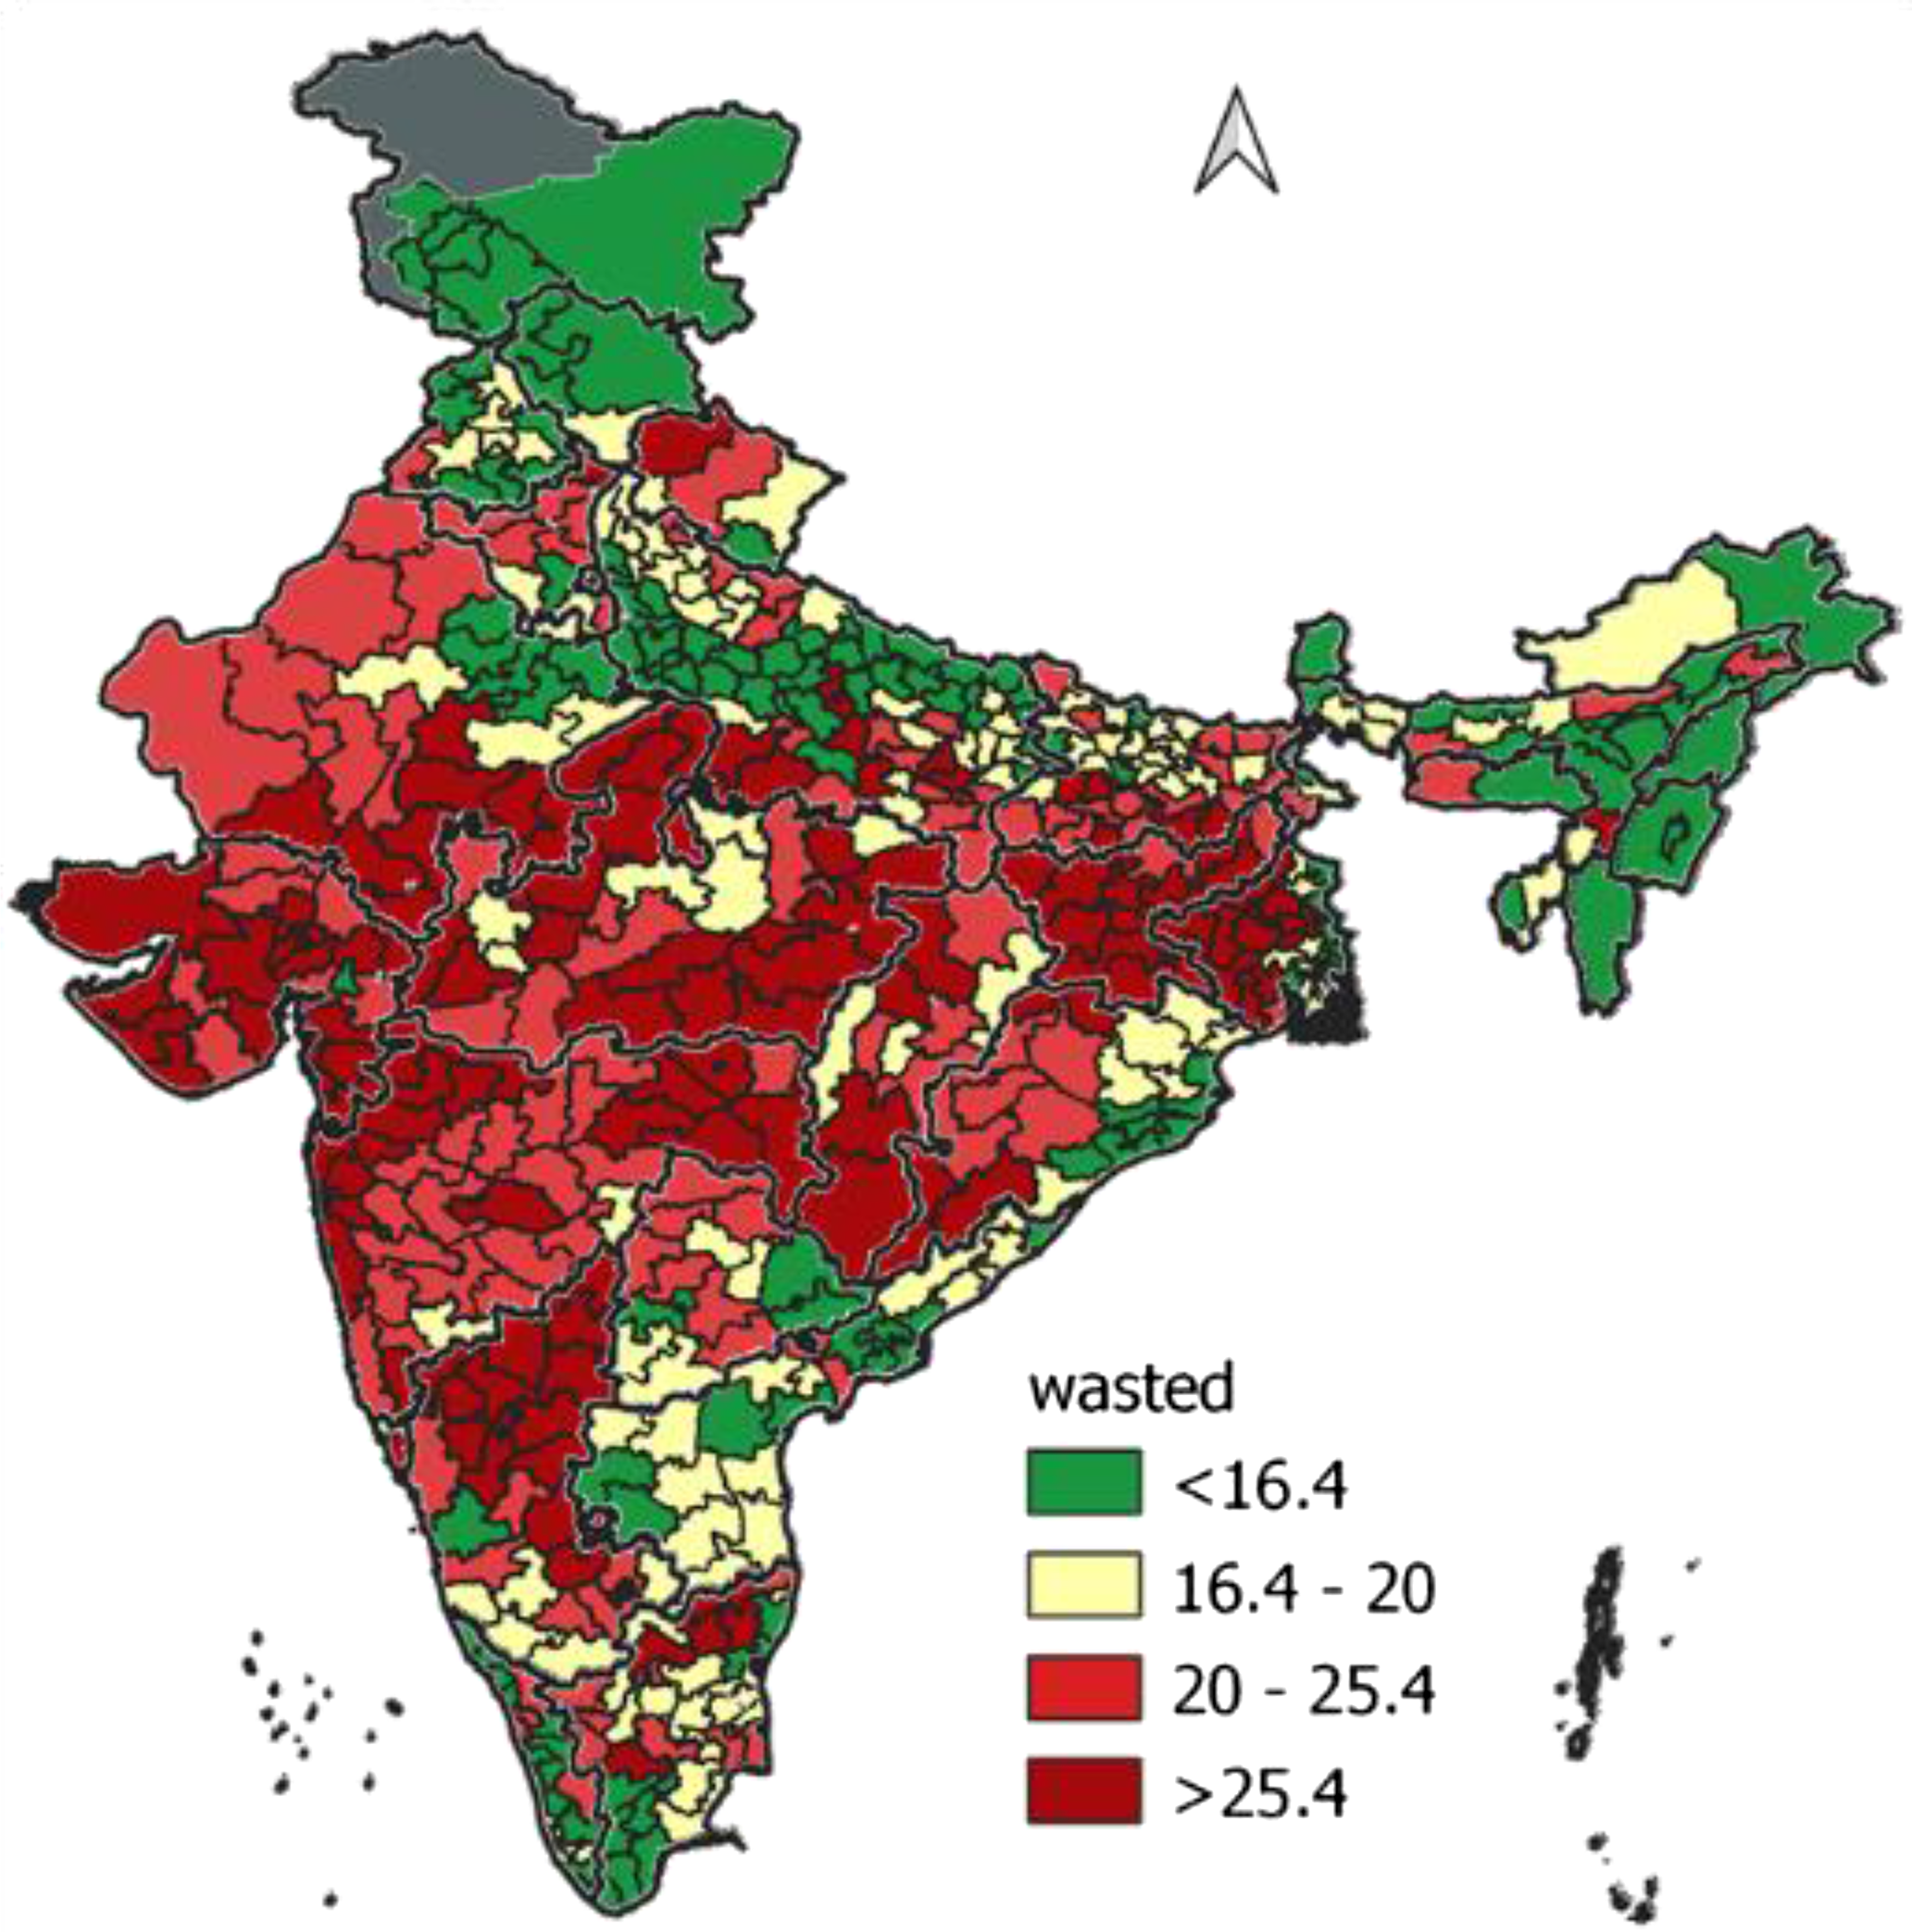
Figure 3. Percentage of children wasted across parliamentary constituencies, India, 2015–16.
The LISA statistics (see Figures 4–8 and Table 1) show significant spatial clustering. Areas that exhibit statistically significant clustering are colour-marked, and the regions with no colour (blank) show that spatial clustering was insignificant. These spatial variations primarily reflect three statistical meanings: (i) non-randomness; (ii) statistically significant; and (iii) impact of neighbourhood interactions (Cheng et al., Reference Cheng, Chen, Liu and Kao Yang2011).
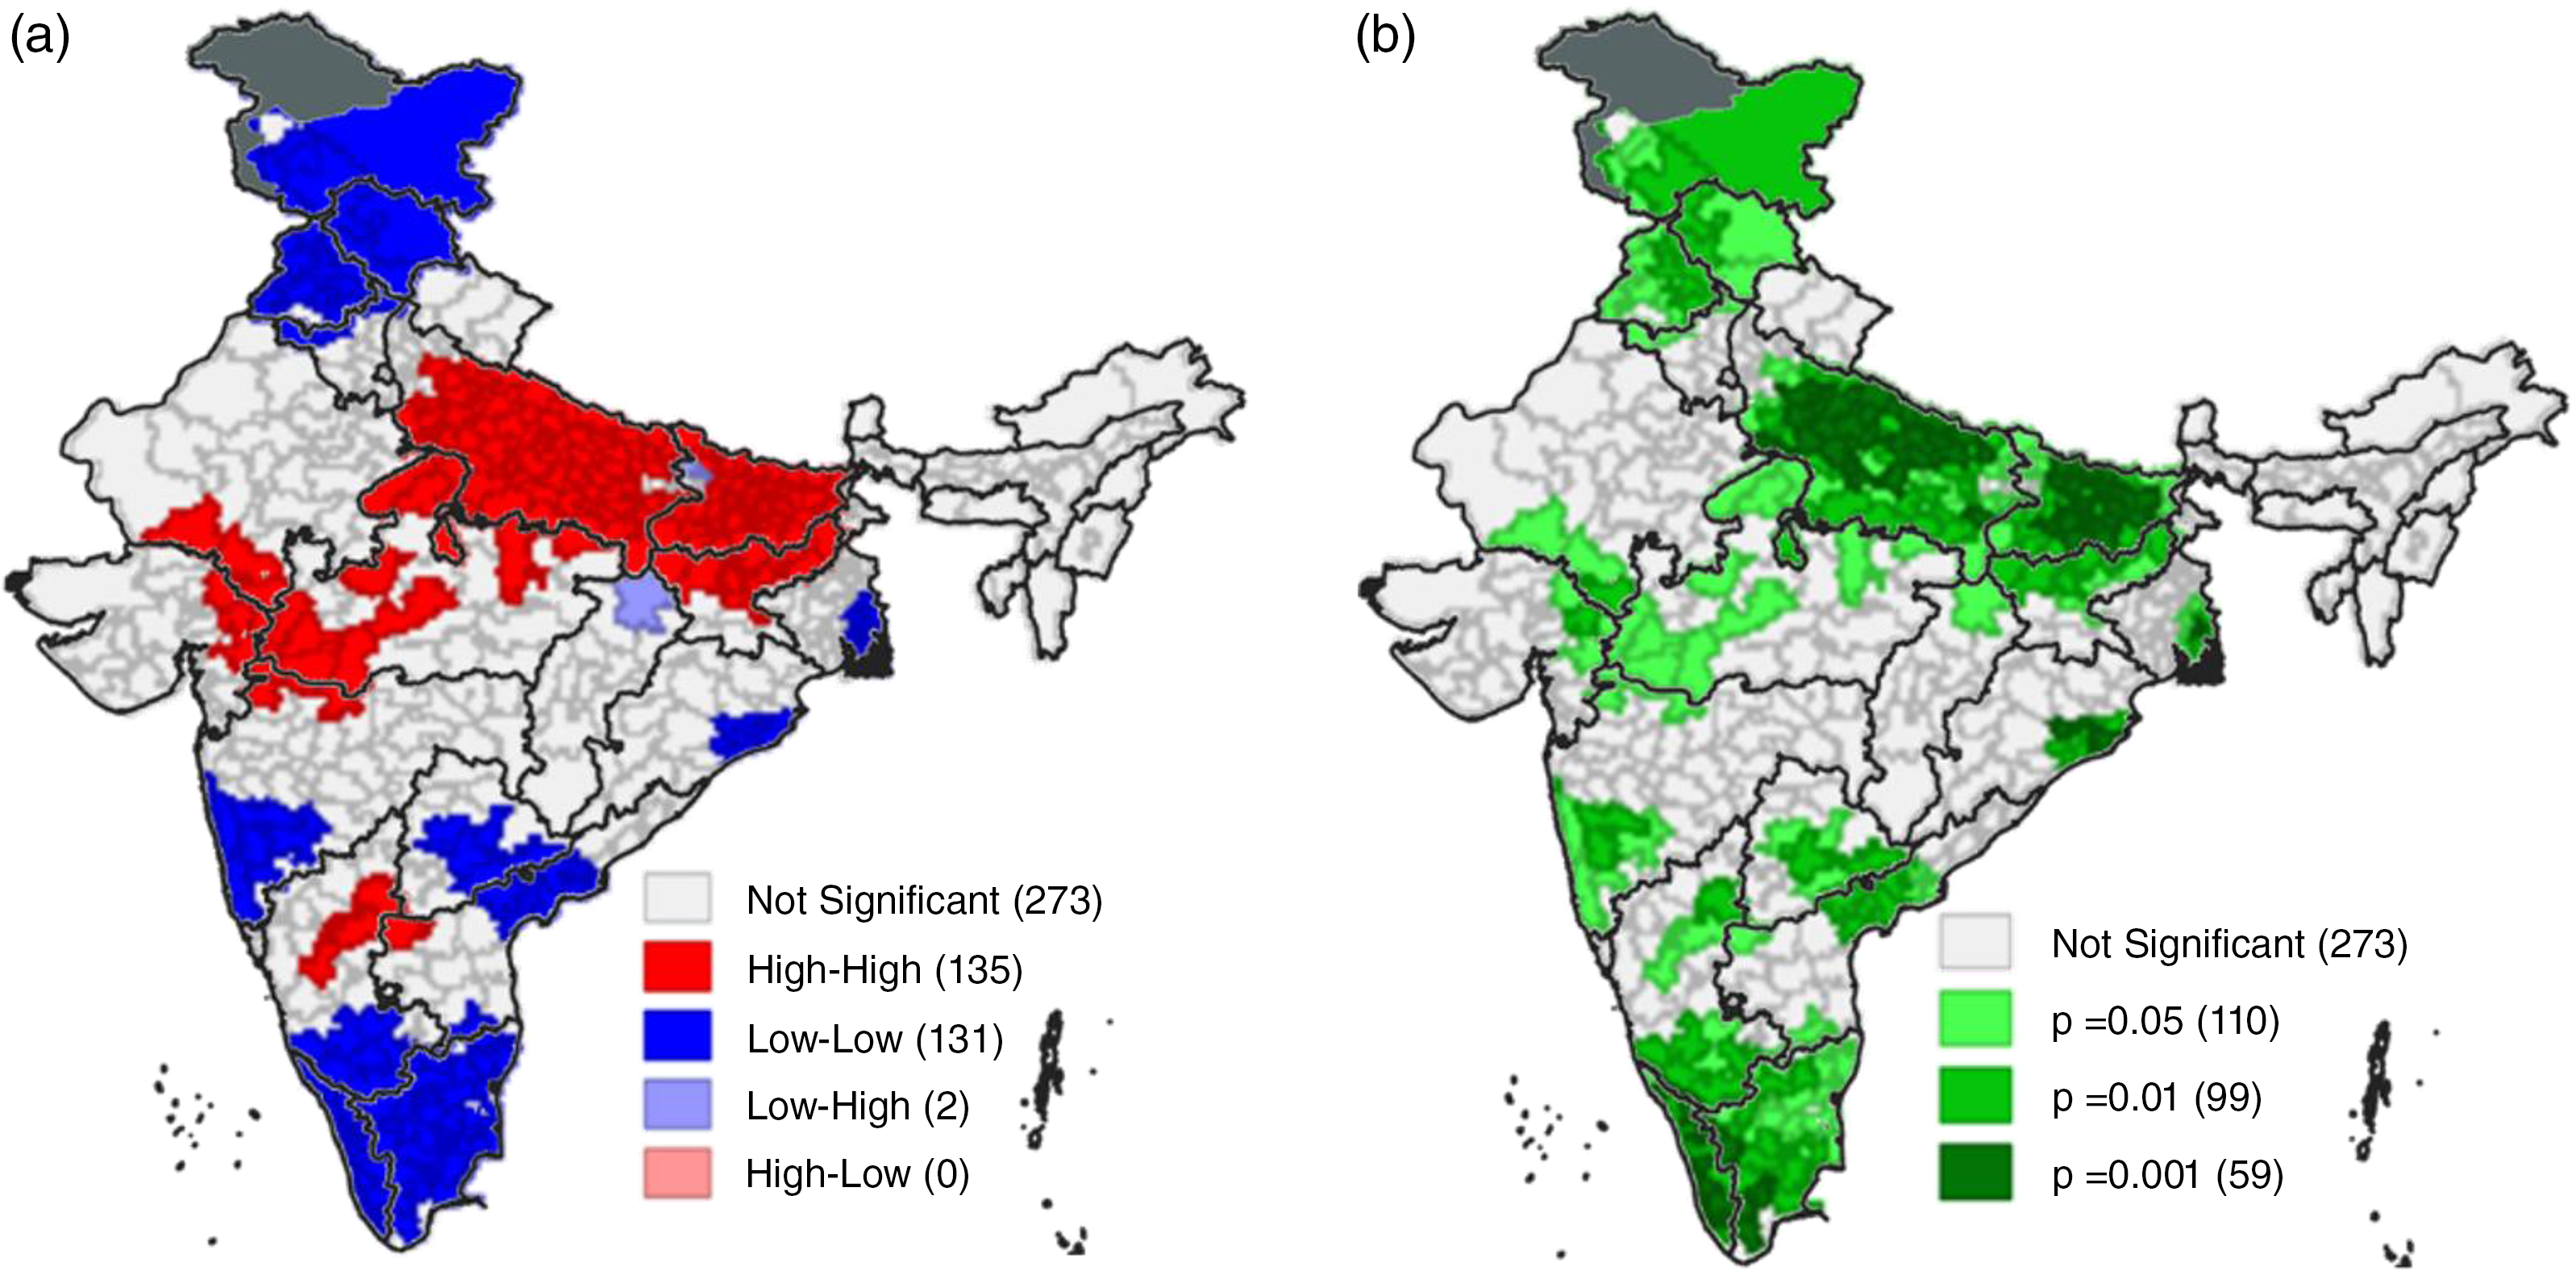
Figure 4. (a) Univariate LISA cluster map for children stunted across parliamentary constituencies, India, 2015–16. (b) Univariate LISA significance map for children stunted across parliamentary constituencies, India, 2015–16.

Figure 5. (a) Univariate LISA cluster map for children underweight across parliamentary constituencies, India, 2015–16. (b) Univariate LISA significance map for children underweight across parliamentary constituencies, India, 2015–16.
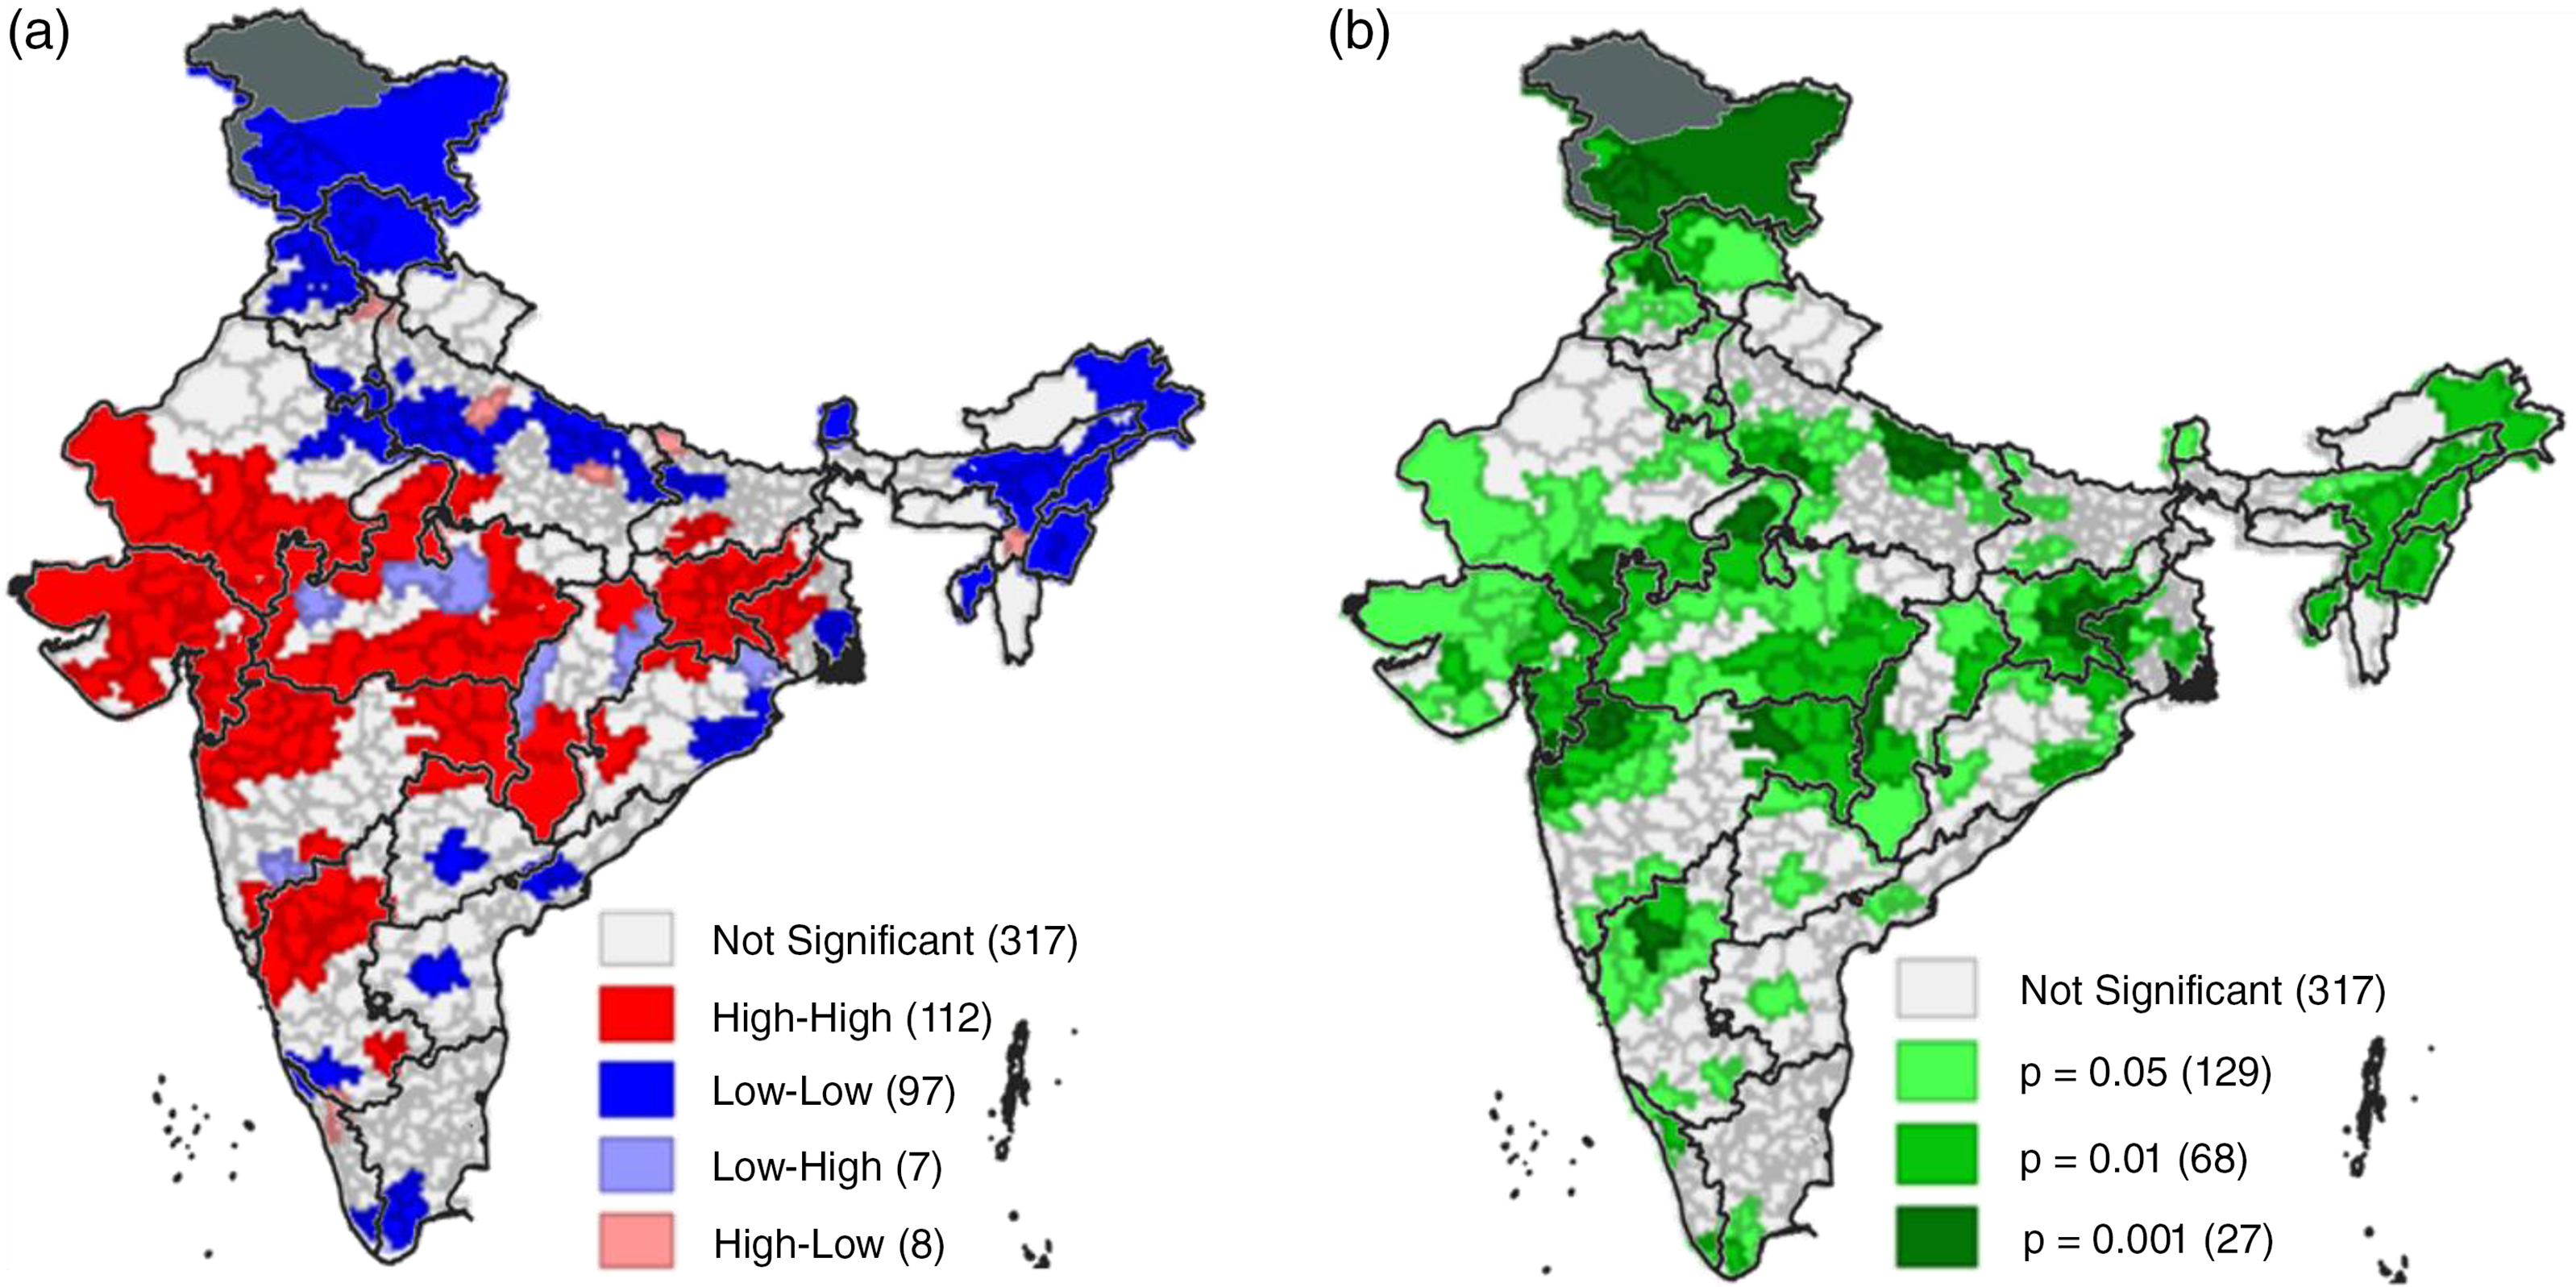
Figure 6. (a) Univariate LISA cluster map for children wasted across parliamentary constituencies, India, 2015–16. (b) Univariate LISA significance map for children wasted across parliamentary constituencies, India, 2015–16.
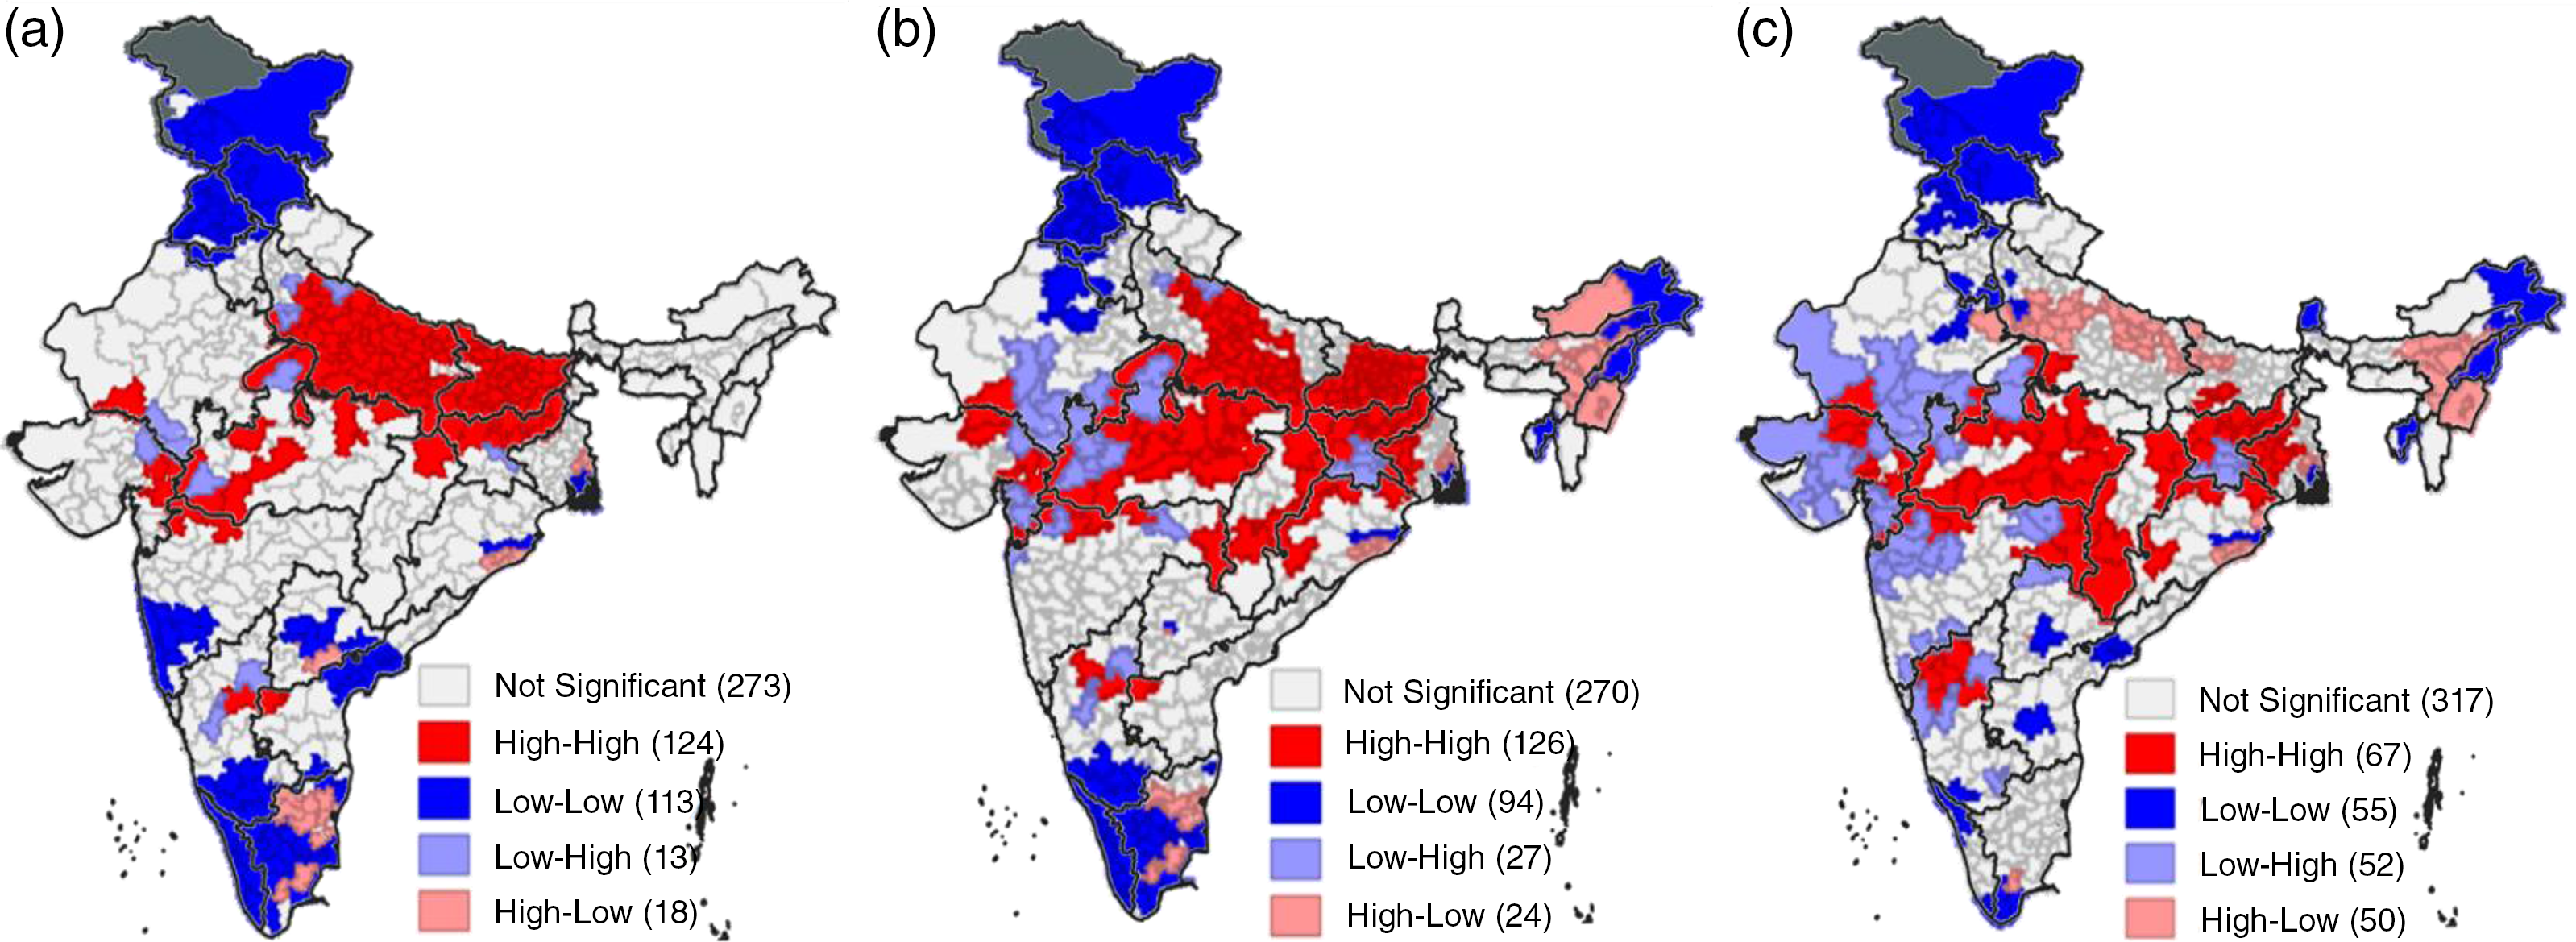
Figure 7. Bivariate LISA cluster of poverty vs children (a) stunted, (b) underweight, and (c) wasted, across parliamentary constituencies of India, 2015–16.
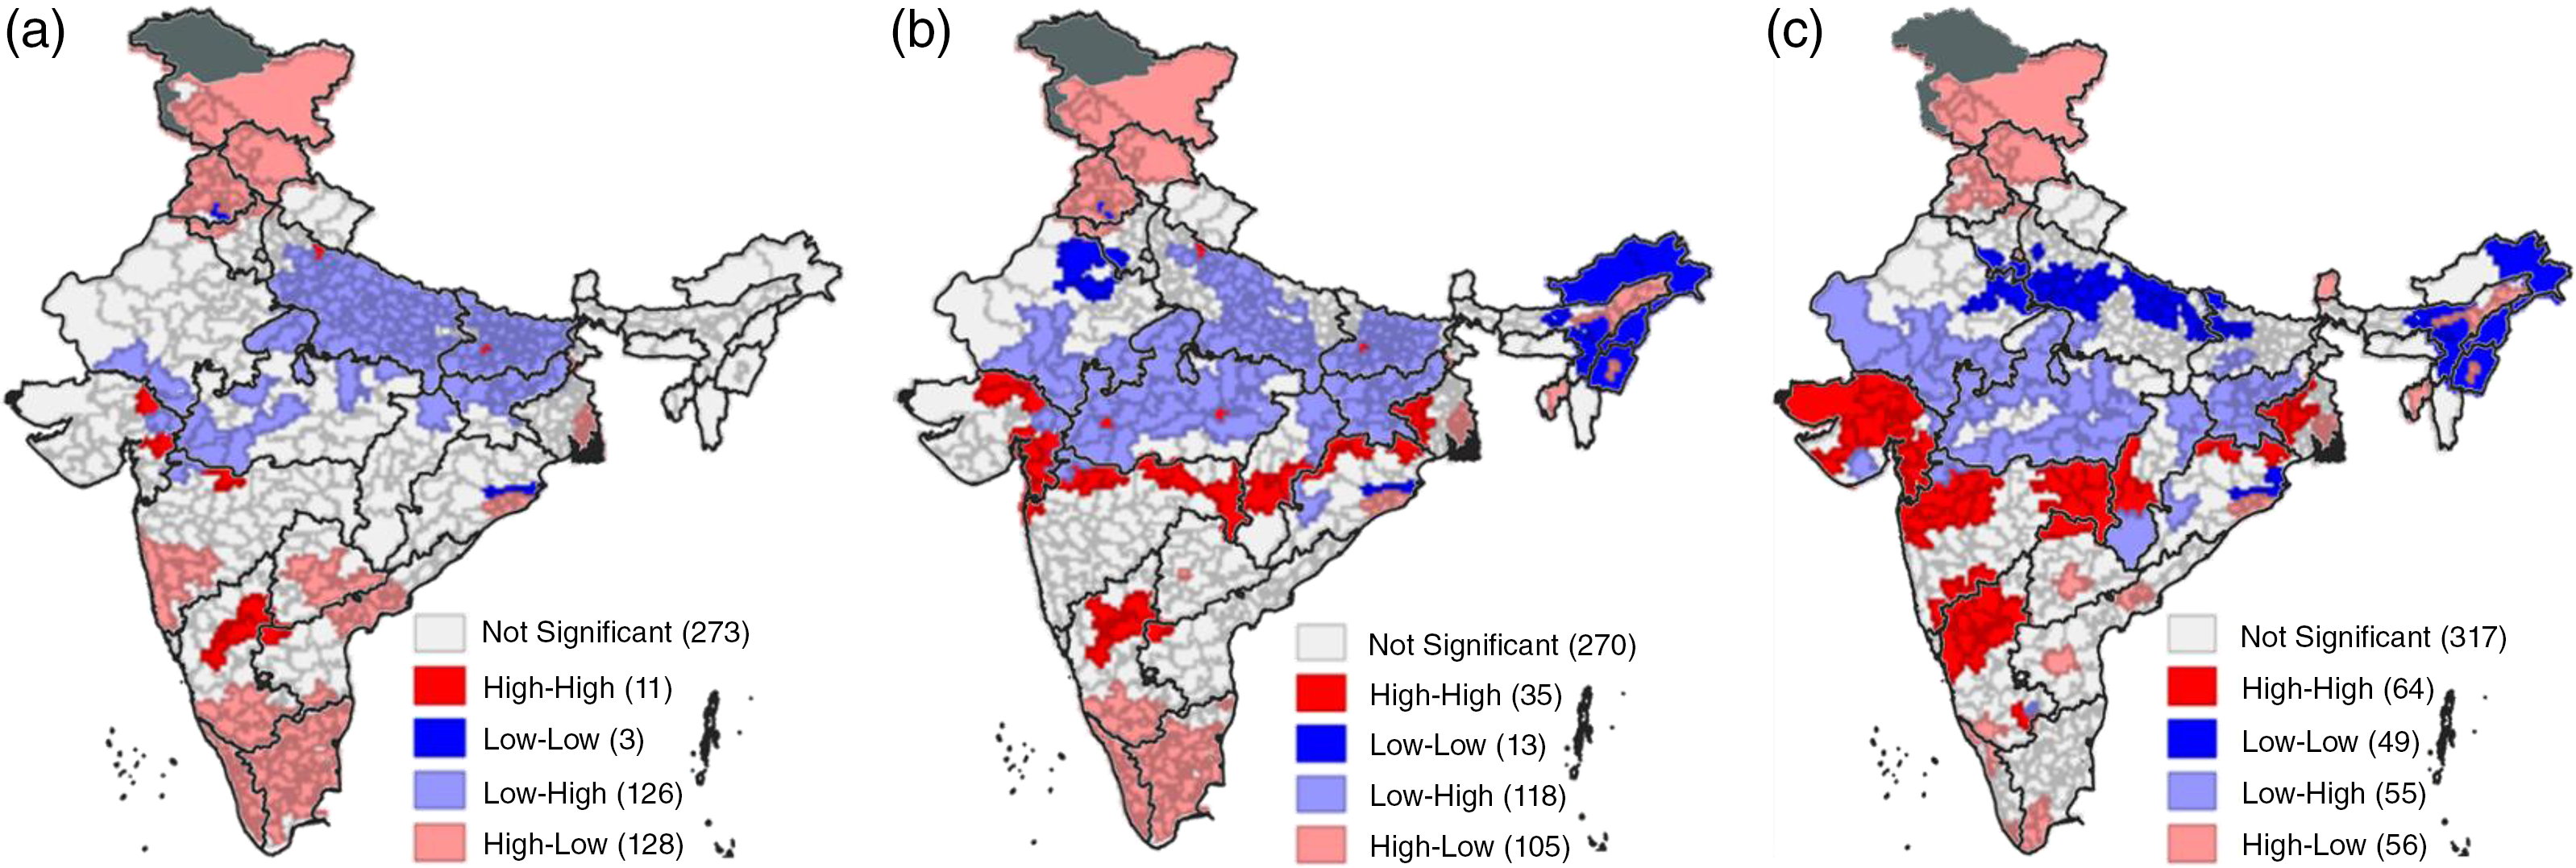
Figure 8. Bivariate LISA cluster of antenatal care vs children (a) stunted, (b) underweight, and (c) wasted across parliamentary constituencies of India, 2015–16.
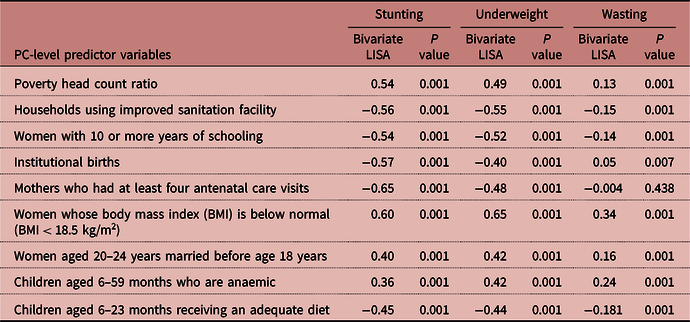
Table 1. Bivariate LISA Moran’s I Statistics Showing the Spatial Dependency (at Parliamentary Constituency Level) of the Prevalence of Undernutrition Against the Predictor Variables, India, 2015–16
The univariate LISA cluster and significance maps (Figure 4) identified significant clusters of high–high spatial association of children stunted in 135 PCs, that is, 135 constituencies had a higher-than-average prevalence of stunting, whereas 131 constituencies showed significant low–low spatial association, that is, having lower prevalence than the average of its neighbours. Significant hotspots (high–high) were seen for children underweight in 148 PCs (Figure 5), while 117 constituencies were identified as the coldspots (low–low). For wasting (Figure 6), high–high spatial association was seen in 112 PCs and low–low spatial association in 97 constituencies. Contiguous belt of low–low clusters for children stunted and underweight were for PCs in the southern states of Kerala and Tamil Nadu, Ladakh, Jammu and Kashmir, Himachal Pradesh, and Punjab in northern India, and in the north-eastern states. In contrast, contiguous belt of high–high association clusters was prominent in Rajasthan, Madhya Pradesh, Uttar Pradesh, Bihar, Jharkhand, Chhattisgarh, West Bengal, and Odisha. There were also some constituencies where the level of stunting and underweight was relatively low but wasting was high.
The univariate Moran’s I results presented in Table 1 of Supplementary File 1 confirm a strong and statistically significant clustering of children undernourished in PCs and their selected predictors. The spatial autocorrelation (indicating the correlation of a variable with itself in space) was much stronger for children underweight and stunting (univariate Moran’s I = 0.78 and 0.76, respectively) and then for wasting (univariate Moran’s I = 0.56) for the PCs of India. It is not surprising that the univariate Moran’s I value is relatively lower for children wasted, indicating low levels of clustering, which could possibly be because of the seasonal nature of this parameter. It is worth noting that PC-level spatial autocorrelation was higher than what was found in a district-level analysis (Khan et al., Reference Khan and Mohanty2018).
Spatial clustering was also strong and significant for all predictor variables. Antenatal care (univariate Moran’s I = 0.82) and sanitation facilities (univariate Moran’s I = 0.77) in particular had the strongest spatial autocorrelation.
Bivariate Local Moran’s I results
The bivariate LISA helps understand the spatial relationship between a predictor and outcome variables across the PCs of India. The bivariate Moran’s I (indicating the association between a given predicator and an indicator of undernourishment) values in Table 1 show that a number of predictors had a strong and positive spatial autocorrelation with underweight and stunting. These include level of poverty, mothers whose BMI was below normal (Moran’s I = 0.65, for stunting), women who married early, and children who were anaemic. In contrast, as expected, use of sanitation facilities (Moran’s I = o.55 for stunting and underweight), women with 10 or more years of schooling, use of healthcare facility for delivery, and use of antenatal care (Moran’s I = −0.65 for stunting) had a strong and negative autocorrelation. The maternal health variable – women’s BMI – showed the highest and positive spatial autocorrelation with all three indicators of undernutrition.
The bivariate Moran statistics presented in Table 1 show that all the relationships between the indicators of undernutrition and predictor variables were in the expected direction and statistically significant. However, the magnitude of the statistics for wasting was very low with all predictor variables. This is in line with the low univariate Moran’s I value for wasting in Table 1 (Supplementary File 1) relative to the univariate Moran’s values for stunting and underweight. To illustrate the nature of bivariate spatial clustering, the results below focus on only two predictors, poverty and antenatal care. Supplementary File 1 provides the remaining bivariate LISA results.
The bivariate LISA cluster map (Figure 7a) indicates that 22% of all the PCs (124 of 543) had high level of stunting and poverty (hotspots). These constituencies were mostly from the northern states of Bihar, Jharkhand, Madhya Pradesh, and Uttar Pradesh. Twenty percent of constituencies, classified as coldspots, with low level of stunting and poverty were mainly in the southern state of Kerala and the northern states of Punjab, Himachal Pradesh, and Jammu and Kashmir. The bivariate relationship between poverty and the other two indicators of undernutrition (i.e., underweight and wasting) was broadly similar to that for poverty and stunting (see Figure 7b and c). High underweight and high poverty were found in a cluster of 126 constituencies (23%) and these were primarily from the states of Bihar, Jharkhand, Madhya Pradesh, and Uttar Pradesh from the northern part of India, Chhattisgarh, Odisha, and West Bengal from the eastern part, and a few from Karnataka in the south. Seventeen percent of constituencies had low levels of both underweight and poverty (coldspots), and these were mostly from the southern states of Karnataka, Kerala, and Tamil Nadu, and the north-eastern states of Arunachal Pradesh, Nagaland, and Tripura, and northern parts of Rajasthan, Punjab, Himachal Pradesh, and Jammu and Kashmir. With respect to wasting, 12% constituencies can be classified as hotspots, having high rates of wasting along with high level of poverty, and only 10% constituencies showed low levels of wasting and poverty. PCs having low level of poverty but high-level undernutrition were predominantly in the northern states of Rajasthan, Uttar Pradesh, Madhya Pradesh, and Jharkhand, and Gujarat in the west.
The antenatal and undernutrition LISA clusters (Figure 8) confirmed that low rates of antenatal care were associated with high rates of stunting in 23% of the constituencies (126 out of 543 constituencies), high underweight in 22% of constituencies (118 constituencies), and high wasting in 10% of constituencies (55 constituencies). These clusters were found in the states of Bihar, Madhya Pradesh, Uttar Pradesh, Rajasthan, Gujarat, Odisha, and Chhattisgarh. High rates of antenatal care were associated with low levels of stunting in more than 23% of constituencies (128 out of 543 constituencies), with low levels of underweight in 19% of constituencies (105 constituencies) and low levels of wasting in 10% of constituencies (56 constituencies), and these cluster of constituencies were majorly from the states of Karnataka, Kerala, and Tamil Nadu from the south, Jammu and Kashmir, Punjab, and Himachal Pradesh from the north, Odisha and West Bengal from the east, and Assam, Tripura, and Manipur from the north-east.
Bivariate clusters also show that, despite experiencing a relatively high level of poverty, a number of constituencies had below average level of underweight (24 constituencies), stunting (18 constituencies), and wasting (50 constituencies). Constituencies having a higher-than-average level of poverty but low level of undernutrition, with respect to stunting and underweight, were in the eastern states of West Bengal and Odisha and southern states of Tamil Nadu and Telangana. Constituencies from the north-eastern states of Arunachal Pradesh, Assam, and Manipur also show clusters having higher-than-average level of poverty but low level of underweight and wasting. Similarly, above average use of antenatal care was not associated with below average underweight (35 constituencies), stunting (11), and wasting (64 constituencies).
Spatial regression results
Spatial regression models help explore the factors underlying the spatial patterns. Table 1 in Supplementary File 2 presents the results of OLS estimation for children stunted, underweight, and wasted. The OLS model estimated the association between the parliamentary level outcome (stunting, underweight and wasting) and predictor variables without taking into account the spatial structure of the data. The results confirmed the importance of poverty, delivery at healthcare facilities, women’s BMI, and anaemia in children for the prevalence of undernutrition across PCs. Sanitation facilities and children receiving adequate diets were also significant predictors of stunting and underweight. Antenatal care mattered in particular for stunting and wasting.
The residuals in all three OLS models were spatially autocorrelated (Moran’s I = 0.40 for stunting, 0.38 for underweight and wasting each; p < 0001 for all). The tests of the lag (Lagrange multiplier – lag) and error (Lagrange multiplier – error) were significant, reflecting the occurrence of spatial dependence. In other words, these statistics suggest that the prevalence of children stunted, underweight, and wasted was not distributed evenly across the PCs of India, rather arose in specific clusters. This confirms the occurrence of positive spatial autocorrelation in the prevalence of children stunting, underweight, and wasting. Thus, considering this spatial autocorrelation, spatial regression models that take into account the spatial structure of data were estimated.
Spatial effect can be estimated through SLM or SEM. These models use the maximum likelihood approach for parameter estimation while adjusting the spatial dependence.
In the SLM, the spatial dependence inherent in the data is represented by Rho – the coefficient parameter, which assesses the average influence of the neighbouring observations. The spatial autoregressive coefficient from the SEM (LAMBA) reflects the impact of the parameters that are not included in the model but have an impact on the dependent variable. The estimates from both spatial lag and SEMs showed that anaemia in children and women’s BMI were the strongest predictors of undernutrition at parliamentary level (see Table 2 Supplementary File 2). However, the estimates from the SEMs were preferred as they had higher R-squared and log-likelihood values, and a reduced Akaike Information Criterion (AIC).
The SEM provided the final spatial endogeneity-adjusted estimates for the predictors of parliamentary-level indicators of child undernutrition in India (Table 2). With regard to children underweight, the major statistically significant coefficient was for women’s BMI level (β = 0.5) followed by anaemia in children (β = 0.17), and with respect to stunting in children, women’s BMI level was the strongest statistically significant coefficient (β = 0.27), followed by delivery at healthcare facilities (β = -0.14). In other words, the estimates show that a ten-point rise in the percentage of women having below normal BMI across the PCs was associated with a five-point increase in the proportion of children underweight and a three-point increase in the proportion of children stunted. Similarly, a ten-point increase in the proportion of anaemia in children was associated with a 0.8-point increase in the proportion of children stunted and a 1.7-point increase in the proportion of children underweight. In contrast, a ten-point increase in the use of sanitation facilities would bring down the underweight and stunting prevalence by 0.5 points each, and a ten-point increase in delivery at healthcare facilities was associated with a 1.4-point decrease in the prevalence of stunting and a 0.9-point reduction in underweight prevalence.
Table 2. Spatial Regression Model Results: Spatial Error Models for Children Stunted, Underweight, and Wasted, Against its Predictors Across the Parliamentary Constituencies of India, 2015–16
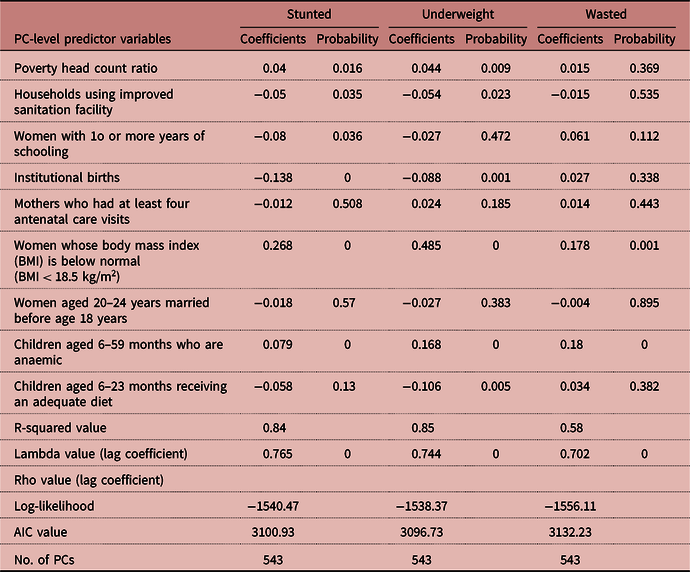
The spatially correlated error (LAMBDA) was 0.76, 0.74, and 0.70 for stunting, underweight, and wasting, respectively (Tables 2). The error term for each PC indicates the magnitude of the effect on the indicator variable that was due to variables not included in the model. The Lambda estimates indicate that a one-point variation in the error in the neighbouring PCs would generate around 0.7-unit variation in the proportion of children stunted/underweight/wasted. In other words, any change in the variables omitted in the model but may have influenced the prevalence of children undernourished was highly likely to result in a change in the prevalence of children stunted, underweight, and wasted in the neighbouring constituencies (Kelejian, Reference Kelejian2014; Golgher and Voss, Reference Golgher and Voss2016).
GWR Results
The SEM results highlighted the associations between undernutrition and the predictor variables, and the GWR model further helped focus on this issue from a global to a local perspective (Biswas, Reference Biswas2022). With the GWR model, the study examined the spatially variant relationships between undernutrition parameters and their driving correlates over space at the local level. The local estimated coefficients of the GWR models for each of the significant correlates were mapped in quintile scale. Figure 9–11 presents the results of the spatial distribution of the significant local coefficients as derived from the GWR model, for all three indicators of undernutrition. Using the results of the SEM, the local coefficients for constituencies have been interpreted for those predictors, which came statistically significant. Results clearly show how these correlates differ with respect to geographical regions.
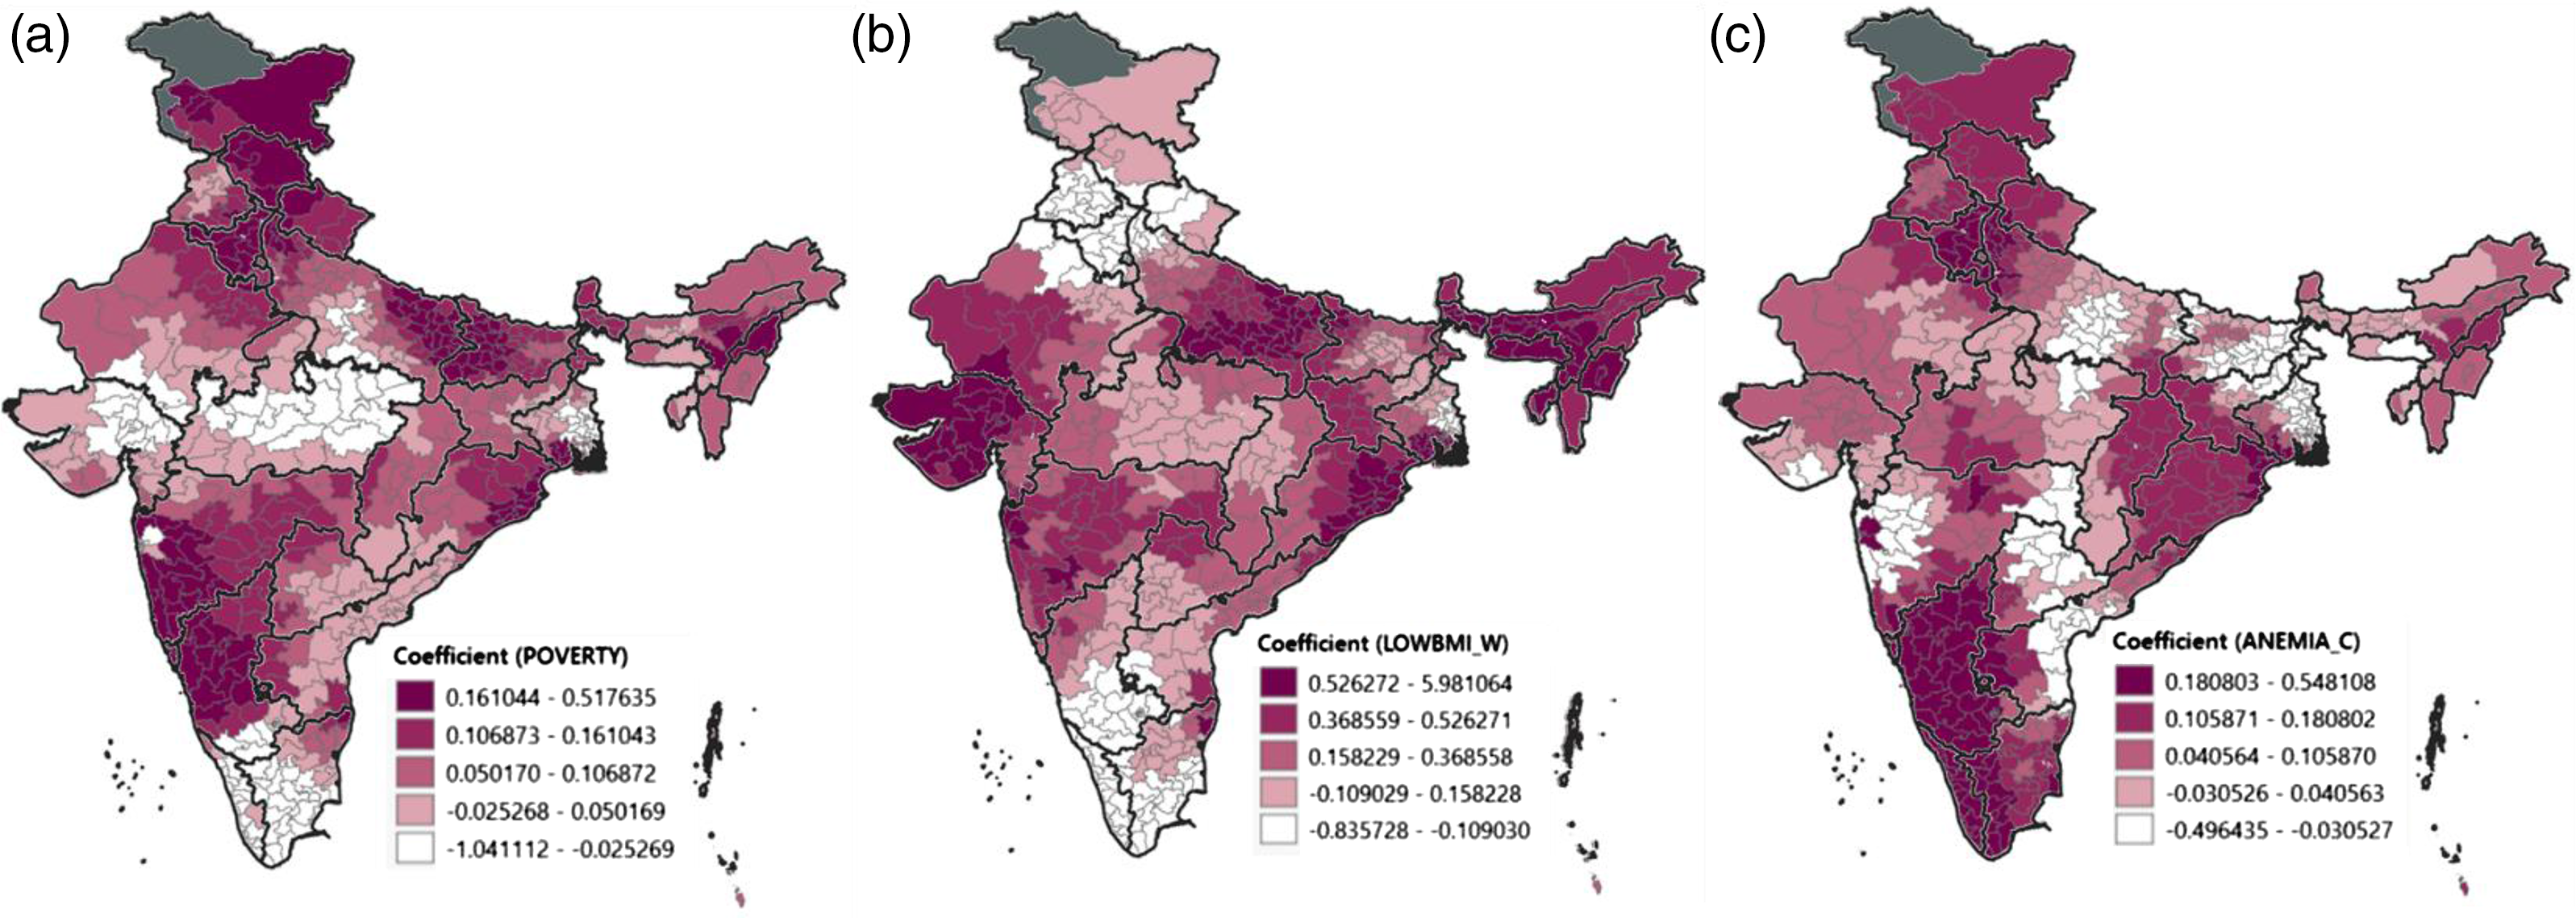
Figure 9. Spatial distribution of the geographically weighted regression model local coefficients of significant predictors with children stunted with (a) poverty, (b) mother’s having low BMI, and (c) anaemia among children, across parliamentary constituencies, India 2015–16.
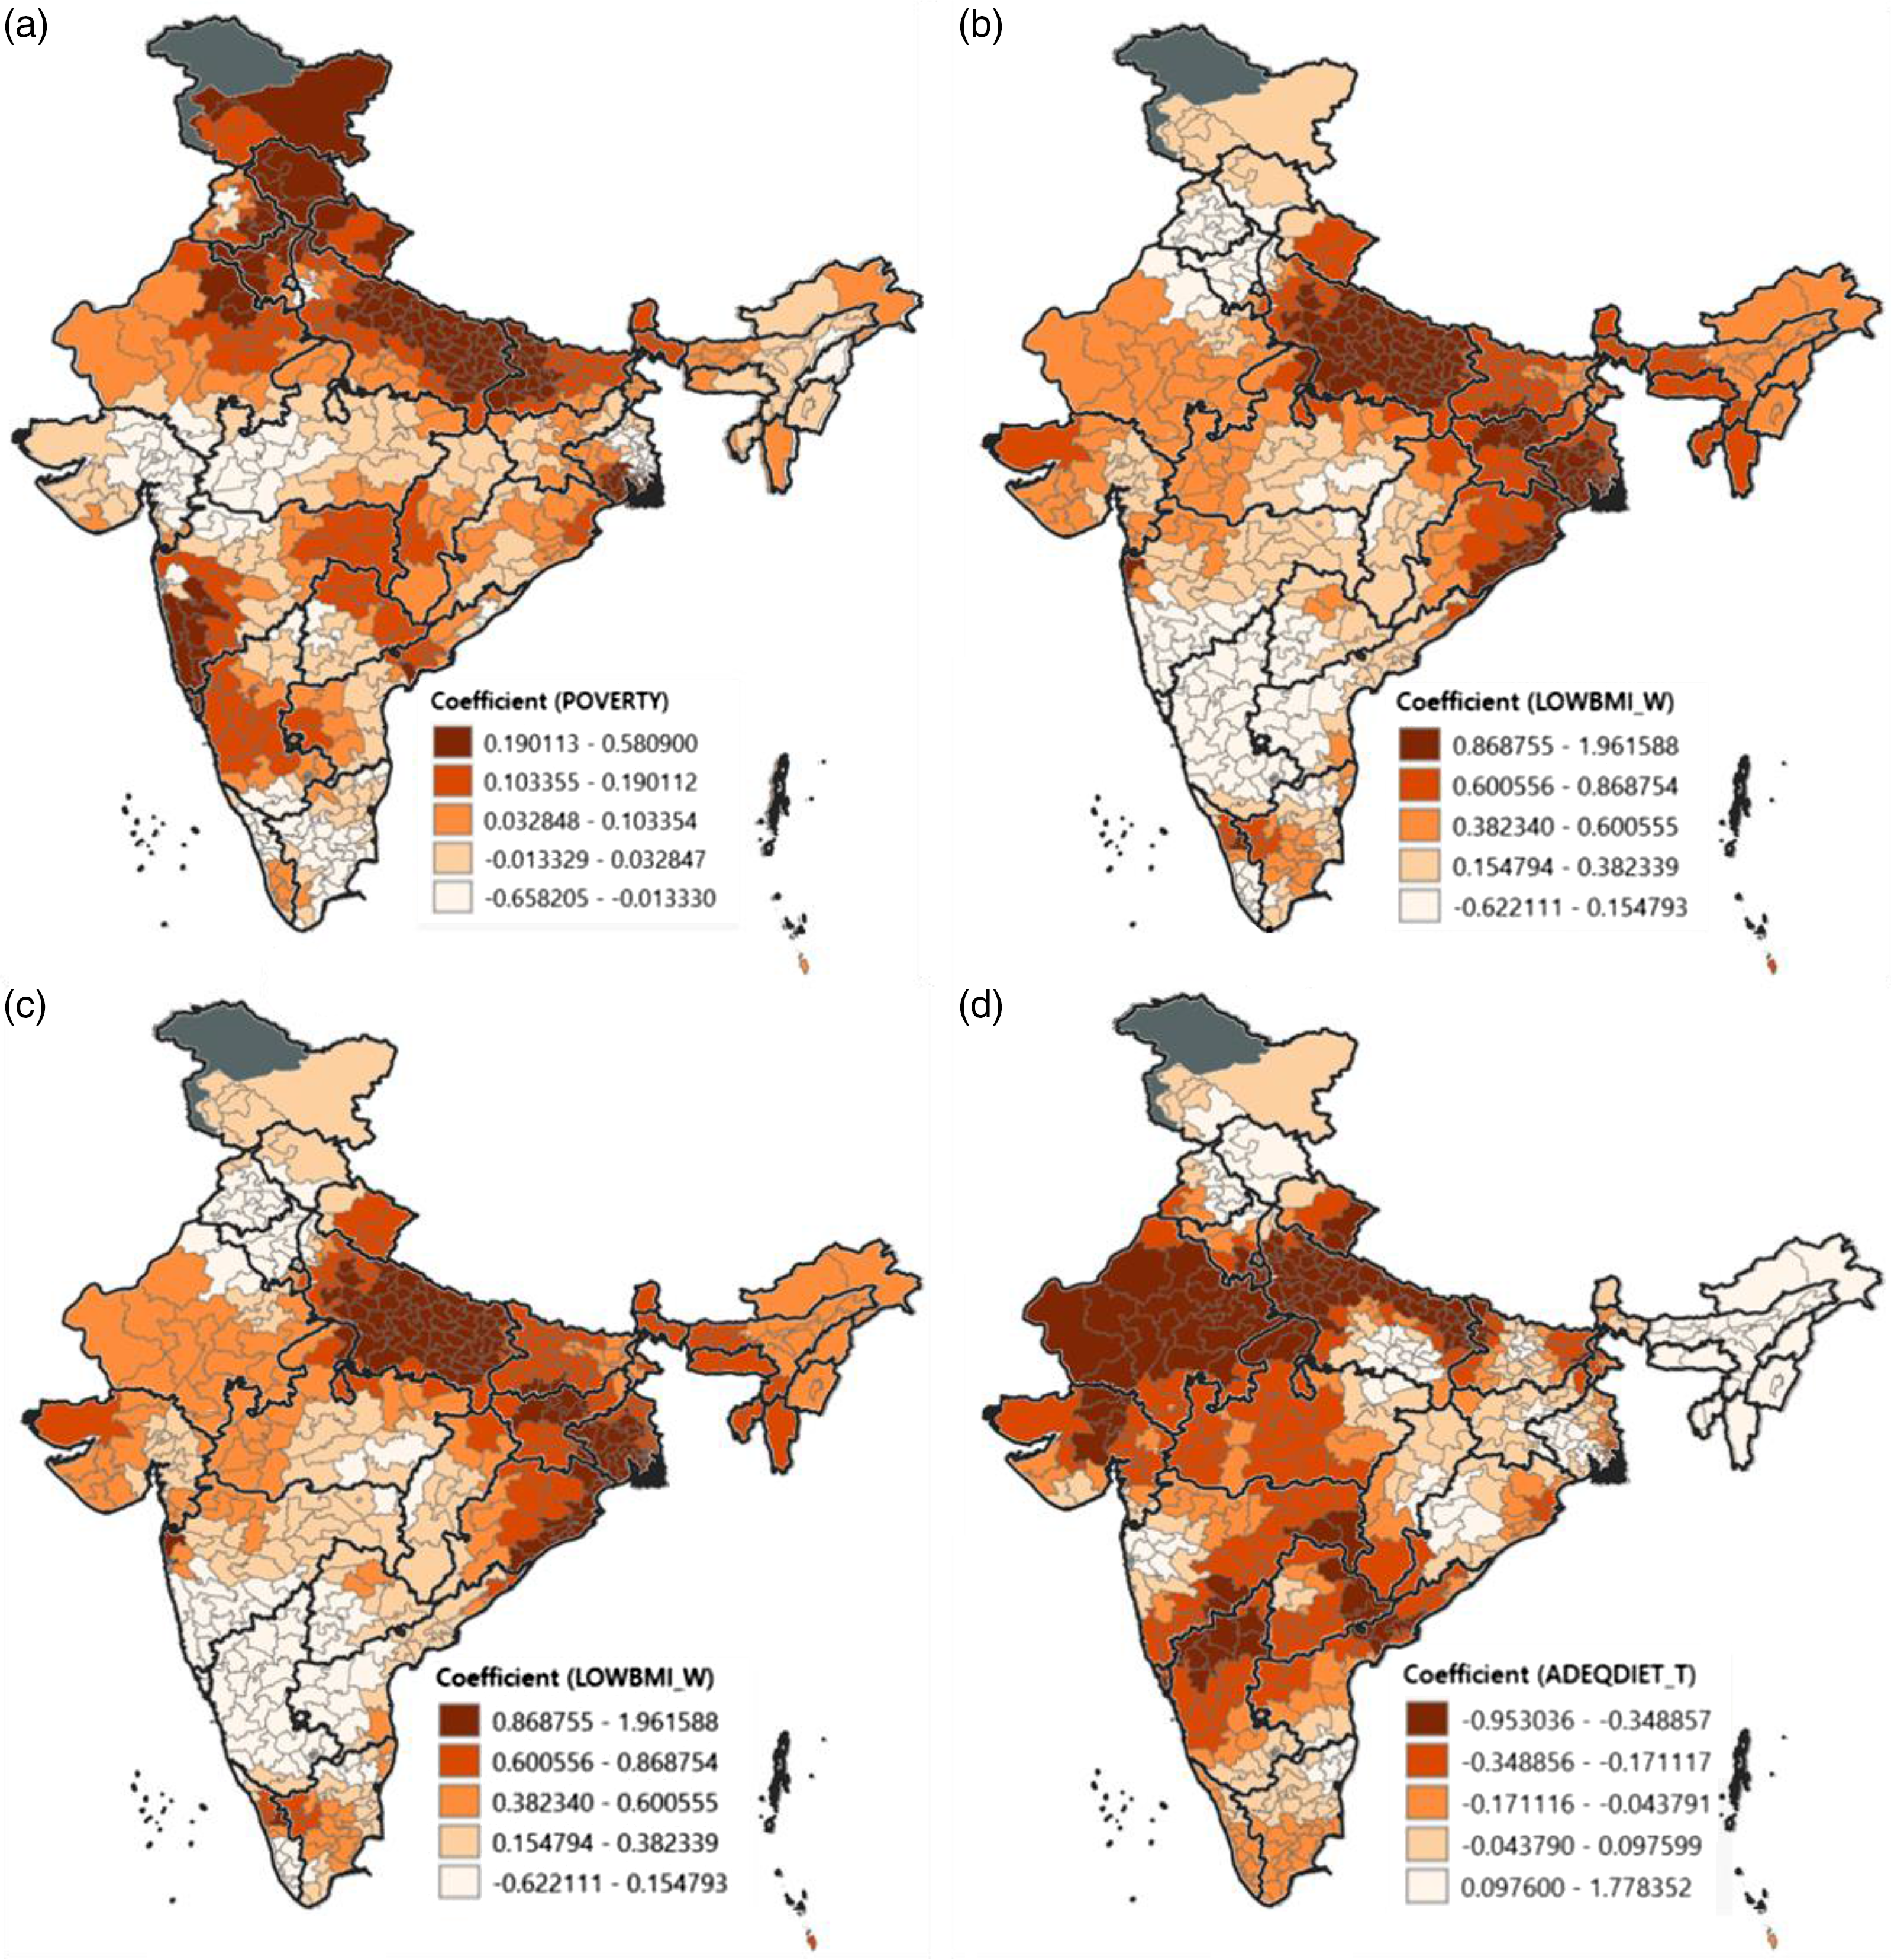
Figure 10. Spatial distribution of the geographically weighted regression model local coefficients of significant predictors with children underweight with (a) poverty, (b) mother’s having low BMI, (c) anaemia among children, and (d) children having adequate diet, across parliamentary constituencies, India 2015–16.
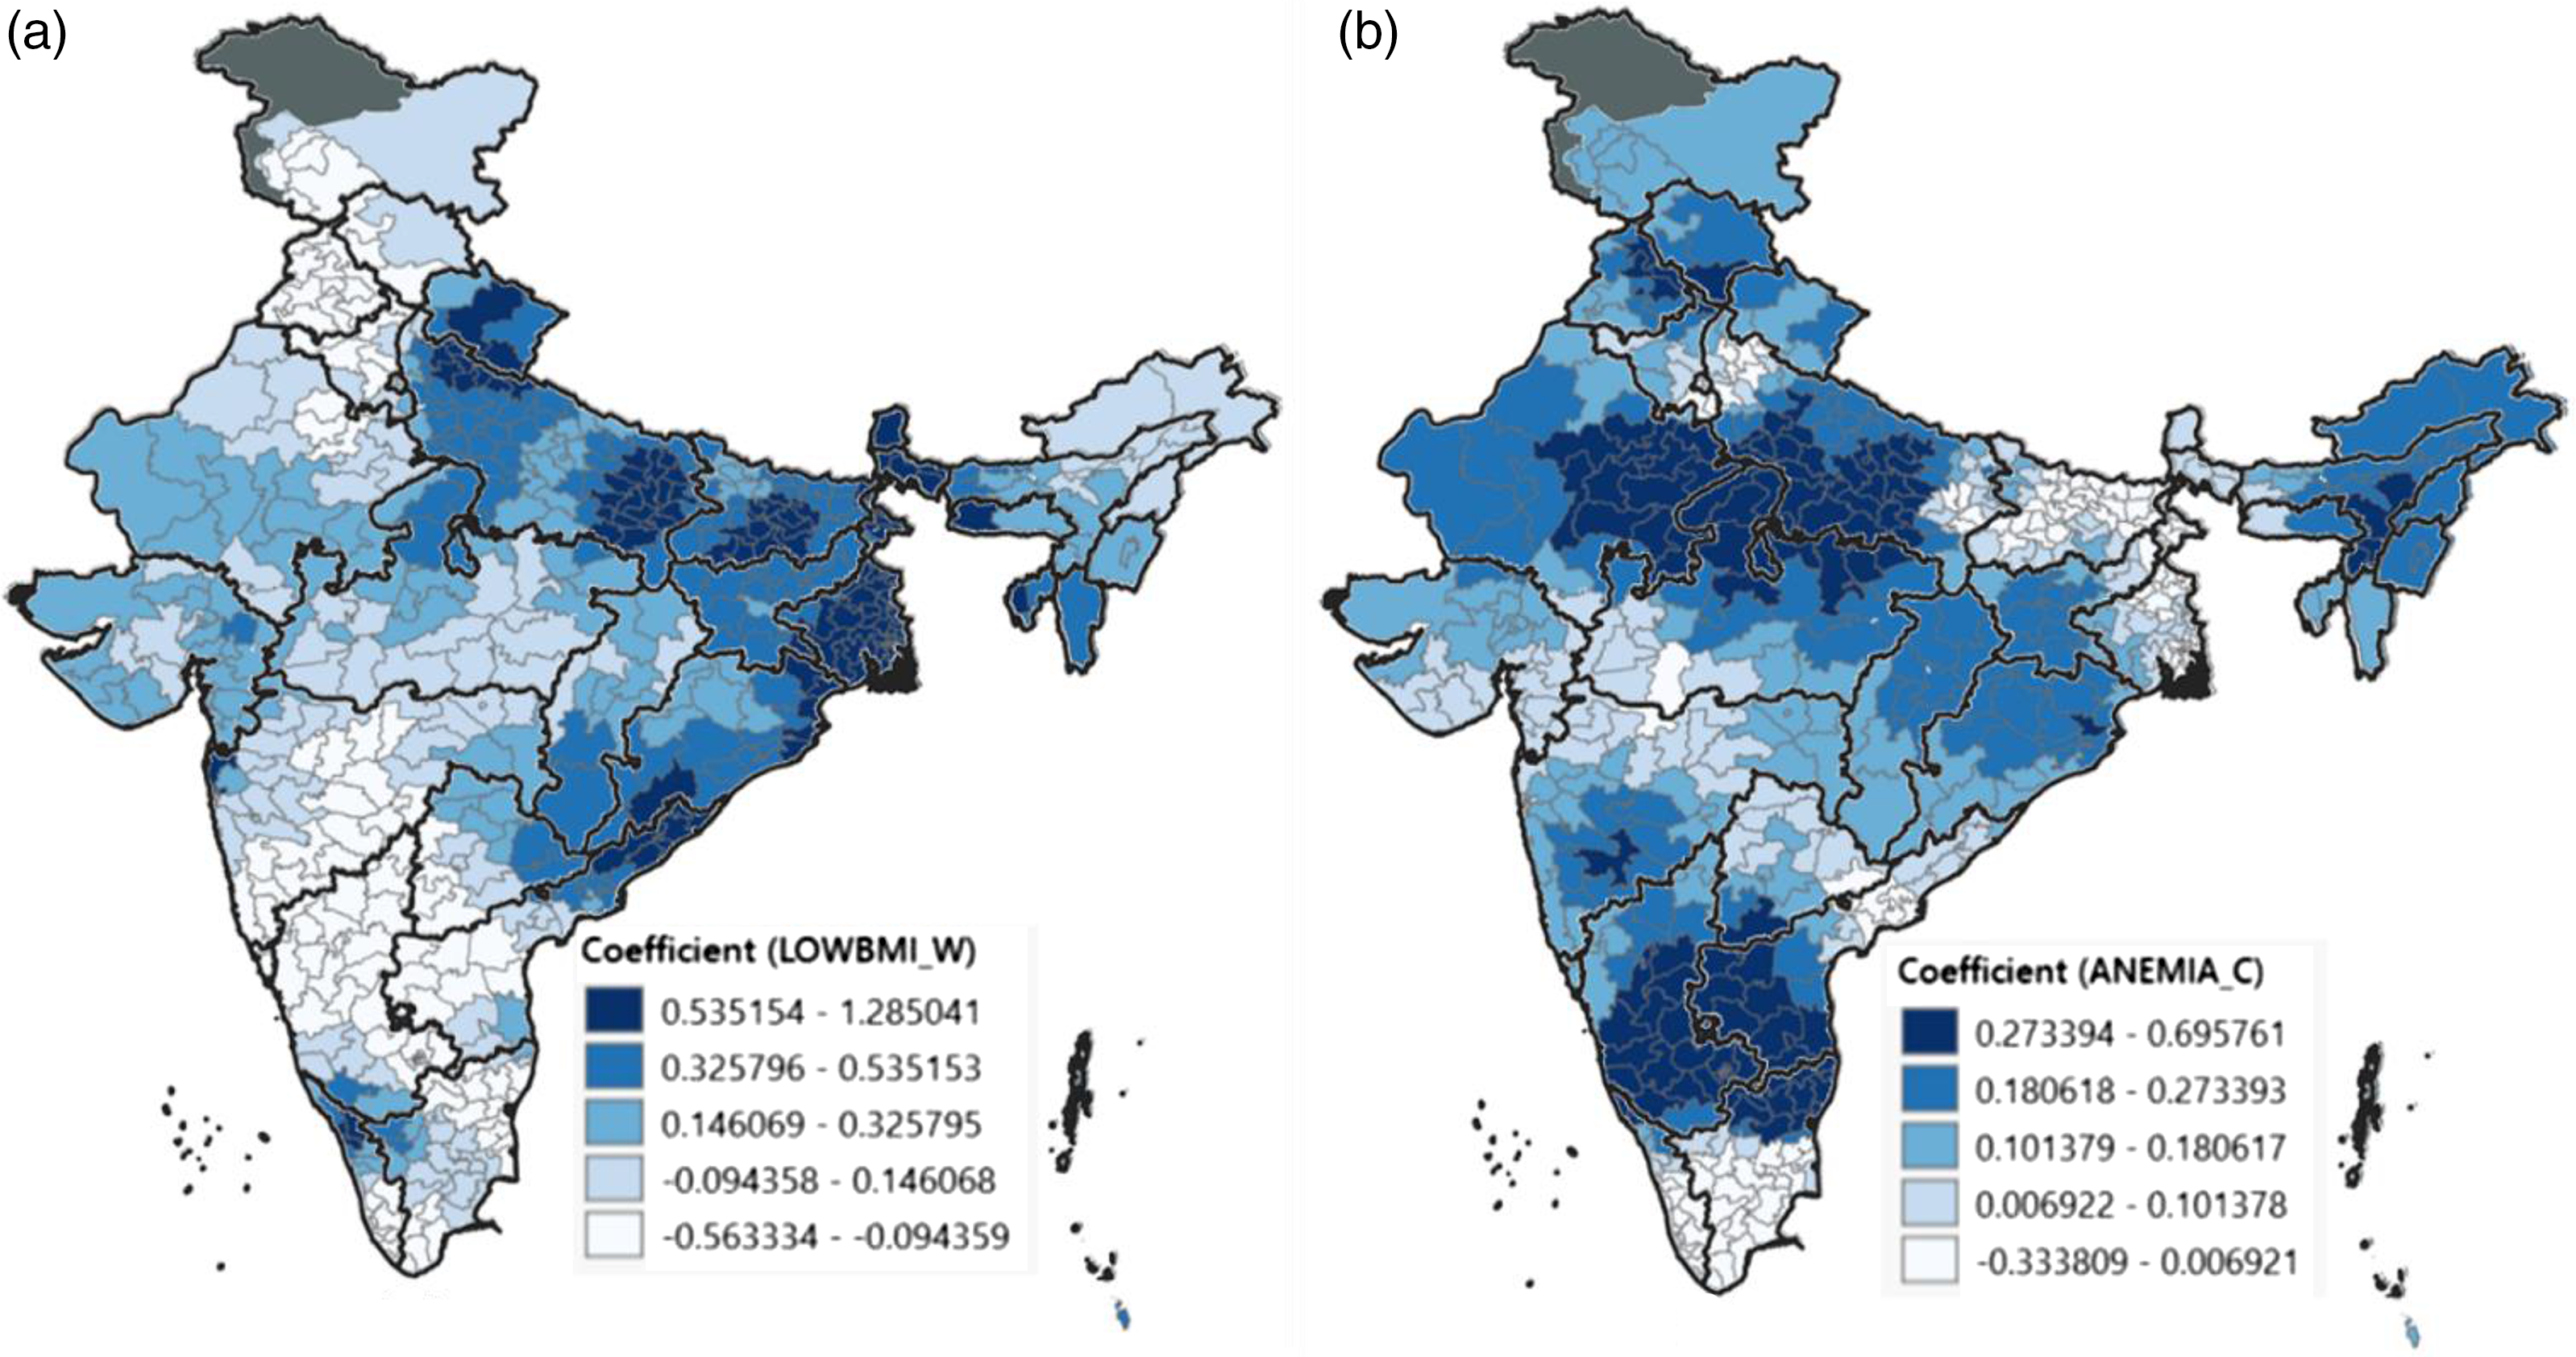
Figure 11. Spatial distribution of the geographically weighted regression model local coefficients of significant predictors with children wasted with (a) mother’s having low BMI and (b) anaemia among children, across parliamentary constituencies, India 2015–16.
Strong positive association between poor maternal status, in terms of low BMI of the mother’s, and children stunted was highly prevalent across the constituencies from Gujarat, Odisha, Uttar Pradesh, and the north-eastern states. Similarly, with respect to underweight, Uttar Pradesh and the belt from Jharkhand, West Bengal to Odisha showed strong positive association. The association between poor maternal health and children wasted also showed a similar pattern. Thus, in these regions, with improvement in maternal health, an improvement in all three indicators of undernutrition is possible.
Interestingly, when children suffering from anaemia with children being stunting are observed, the northern states of Jammu, Ladakh, Himachal Pradesh, Uttarakhand, Punjab, Haryana, and the southern states namely Karnataka, Kerala, and the bordering constituencies of Tamil Nadu and Telangana showed high and positive association. High positive associations were also observed with respect to children stunted and underweight with poverty. This can be seen in the constituencies of Himachal Pradesh, bordering ones of Haryana, Punjab, and Uttarakhand, and Uttar Pradesh and Bihar. A comparable trend was observed in Goa, Maharashtra, and Karnataka. That is, in these constituencies, with poor economic conditions, the prevalence of stunting is also high.
A case study of the Maharashtra state is presented in Supplementary File 3. Maharashtra is located in the western peninsular region of the country, which suffers from high rates of undernutrition among children, performing poorly in terms of all three indicators of undernutrition. Considerable intra-state variations were evident through the LISA results presented above and also in line with the Swaminathan et al. (Reference Swaminathan, Hemalatha, Pandey, Kassebaum, Laxmaiah, Longvah and Lodha2019) study. This emphasised the need for further understanding of the local context when developing health interventions (Swaminathan et al., Reference Swaminathan, Hemalatha, Pandey, Kassebaum, Laxmaiah, Longvah and Lodha2019). Hence, this state-specific spatial analysis explored the undernutrition variation across PCs specific to the state of Maharashtra, by applying the same methodology. When analysing one state as against the nation, the parameter’s average across the constituencies of one state is considered in the algorithm, which further helps highlight more clusters and the intra-state variations. This Maharashtra case study illustrates that even if the average with respect to the level of aggregation is changed, the broader picture remains the same. And the results of this case study indicated that the cluster of PCs with extremely high level of child undernutrition was also disadvantaged in terms of socio-economic characteristics and maternal and child health indicators.
Discussion
Spatial analysis of child undernutrition has tended to focus on district-level administrative units. This paper complements this line of research by using Indian PCs as units of analysis. PC boundaries have the significance of connecting elected parliamentarians and their political parties to constituency-specific development, including maternal and child health. To our knowledge, Kim et al. (Reference Kim, Swaminathan, Swaminathan, Kumar, Rajpal, Blossom and Joe2019) provided the first set of PC-level estimates of stunting, underweight, and wasting among children aged under 5 years. They used the data from the 2015–16 National Family Health Survey to generate these estimates. Swaminathan et al.’s (Reference Swaminathan, Hemalatha, Pandey, Kassebaum, Laxmaiah, Longvah and Lodha2019) work emphasised the need for more data and analyses at the PC level so as to strengthen effective policy discourse that brings in elected representative to the centre of discussion. Another related study by Striessnig and Bora (Reference Striessnig and Bora2020) explored the geographical patterns of children undernourished by conducting a hierarchical clustering analysis; however, their focus was at the level of districts, unlike the present study which took PCs as the unit of analysis. As established earlier, though districts are the administrative unit of the country, PCs are the political boundaries and analysis at this level is of more significance as it would help track the efficacy of programme implementations and governance by the elected members of parliament. Another key difference is that the current study investigated the clusters taking into account the dependence of neighbours and also controlling for the spatial dependence and spatial autocorrelation in the model. The present study also serves as a demonstration of how the use of geospatial techniques and LISA statistics enables highlighting the various clusters and patterns of child undernutrition along with its predictor variables across the PCs of India for the first time.
Using the PC-level estimates of undernutrition and its key predictors, this paper investigated the spatial heterogeneity of undernutrition among children across the 543 constituencies in India. Geospatial techniques univariate and bivariate LISA and spatial regression models helped identify more precisely the spatial patterns and clusters, highlighted the high–low burden areas in terms of local hotspots in a more visual way, and also identified the potential spatial risk factors of undernutrition among children across PCs. In particular, these techniques enabled identifying constituencies with above average prevalence of undernutrition surrounded by similar areas, known as high–high or hotspots, and constituencies with below average undernutrition surrounded by neighbours of similar values, that is, low–low or coldspots. Spatial regression models provided more robust estimates for key predictors of undernutrition by accounting for the spatial dependence structure in data.
The analysis suggests that the prevalence of stunting, underweight, and wasting was highly variable across PCs (spatial heterogeneity). Moreover, this variation, in particular the hotspots and coldspots, was clearly identifiable through univariate and bivariate LISA cluster maps. The spatial analyses result also established a statistically significant association of undernutrition with poverty, household sanitation facilities, women’s BMI, anaemia in children, and institutional births. Most of the constituencies that performed poorly in both child nutrition and socio-economic indicators were located in the northern, western, and eastern parts of India.
The PCs mainly in the northern states of Bihar, Uttar Pradesh, Gujarat, Madhya Pradesh, Jharkhand, and Chhattisgarh had very high levels of stunting, underweight, and wasting. This is consistent with other studies that identified these states as poorly performing in terms of child health (Cavatorta et al., Reference Cavatorta, Shankar and Flores-Martinez2015). Intra-state variation was also evident, particularly in the states of Maharashtra, Odisha, and Karnataka.
The univariate and bivariate LISA results confirmed a strong and statistically significant clustering of PCs for children malnourished (stunted, underweight, and wasted). The spatial pattern established that the PC-level variations were non-random, statistically significant, and showed the effects of interactions with neighbouring constituencies (Cheng et al., Reference Cheng, Chen, Liu and Kao Yang2011). The results also confirm higher spatial autocorrelation across the PCs than at the district level (Khan and Mohanty, Reference Khan and Mohanty2018).
PC-level poverty, BMI of mother, early marriage, and anaemia in children had a large and positive spatial autocorrelation with stunting and underweight. As would be expected, sanitation facilities, women’s education, institutional births, antenatal care, and children receiving adequate diet had strong negative effect on constituency-level undernutrition. These findings are coherent with the findings from earlier studies highlighting the association between these variables and nutritional outcomes in children under 5 years of age (Felisbino-Mendes, Reference Felisbino-Mendes, Villamor and Velasquez-Melendez2014; Ali et al., Reference Ali, Saaka, Adams, Kamwininaang and Abizari2017; Tigga and Sen, Reference Tigga and Sen2016). While child nutrition in India is on government’s development agenda, special focus is arguably required on the poorly performing PCs, with particular attention to maternal health care needs, sanitation facilities, women’s education, and the provision of and access to antenatal care.
The bivariate LISA cluster maps indicated that one in five PCs had very high levels of stunting and poverty, and one in four had very high levels of underweight and poverty. Again, these constituencies were mainly in the northern states of Uttar Pradesh, Bihar, Jharkhand, and Madhya Pradesh. This is consistent with the argument that poverty is a significant contributor to child undernutrition (Varadharajan et al., Reference Varadharajan, Thomas and Kurpad2013; Vollmer et al., Reference Vollmer, Harttgen, Subramanyam, Finlay, Klasen and Subramanian2014; Panda et al., Reference Panda, Mohanty, Nayak, Shastri and Subramanian2020; Striessnig et al., Reference Striessnig and Bora2020).
Spatial regression models showed that women’s BMI, anaemia in children, and delivery at healthcare facilities were key predictors of stunting and underweight. This implies that maternal health and maternal nutrition are at the root of poor nutrition status of children. Hence, the findings reinforce the need to break the cycle of undernutrition in mothers and children, by initiating appropriate interventions at PC level. The parliamentarians may be expected to play a key role in initiating, implementing, and monitoring relevant policy and programme interventions.
PCs with sound sanitation facilities showed below average level of undernutrition, while those with poor sanitation showed a higher prevalence of undernutrition. Studies have shown that poor sanitation and hygiene contribute to diarrhoea-associated infections, and about 50% of undernutrition among under-5 children globally was due to poor sanitation (Dobe, Reference Dobe2015; Chase and Ngure, Reference Chase and Ngure2016; Mshida, Reference Mshida, Kassim, Mpolya and Kimanya2018). In addition, the spatial patterns identified in this study show significant clusters of PCs where greater proportion of women had at least 10 years of schooling and low prevalence of child stunting, underweight, and wasting. Earlier studies also established similar relationship between women’s education and child malnutrition (Mishra and Retherford, Reference Mishra and Retherford2000; Brennan et al., Reference Brennan, McDonald and Shlomowitz2004; Kumar et al., Reference Kumar, Goel, Mittal and Misra2006; Makoka and Masibo, Reference Makoka and Masibo2015; Scherbaum and Srour, Reference Scherbaum and Srour2016).
In sum, the findings overall show striking variations in child undernutrition across PCs in major states of India. It appears that the variation and clustering at the PC level were greater than what was found at the district level. This not only implies the differential impact of the underlying political and institutional factors but also an opportunity for elected parliamentarians to directly engage in advocating for policy and programme inventions to help expedite improvements in child health in their respective constituencies. More precise parliamentary-level development measures have the potential to empower voters so that they can cast their vote based on the performance of their elected parliamentarians, in particular with respect to the health of the children in that area (Harriss and Kohli, Reference Harriss and Kohli2009).
It may be noted that the PC-level estimates used in the present study were calculated using survey data (NFHS4) and hence could have some measurement and methodological errors. Important correlates of undernutrition among children, namely age and sex of the child, household conditions, birth interval, spatial parameters like climatic conditions, and agricultural settings, could not be studied due to the non-availability of data at the PC level. Incorporating these parameters in subsequent studies has the potential to yield more nuanced insights, which could further enable more targeted and effective interventions.
Conclusion
The PC-level estimates and spatial patterns of child undernutrition reflect the need to focus and build new interventions around the identified areas and determinants – biological, socio-economic, and environmental – to address child undernutrition in a better and streamlined way. These findings can be used to sensitise the members of parliament in prioritising their agenda and their focus on the development of their constituencies. These findings may also be used to justify the utilisation of the funds allocated to each member of parliament for their constituency development more appropriately and also monitor the utilisation of the funds earmarked for the maternal and child health schemes. The elected parliamentarians may focus on the implementation of welfare schemes and campaigns like POSHAN Abhiyaan and Swachh Bharat Abhiyan, which have a direct impact on health and are crucial to addressing child malnutrition. The findings could also inform public health development, addressing and targeting the various underlying determinants associated with child nutrition in the country. The study also points to the need to collect disaggregated data that are representative at the level of Assembly constituencies in future large-scale national surveys. This could help bring awareness among the people’s representatives about maternal and child health, the nutritional status of children, and the need for allocating resources from the Member’s Local Area Development Scheme (MPLADS) fund to support health and developmental initiatives. Additionally, it may enhance accountability towards their constituents. The spatial variability and pattern of undernutrition indicators and their correlates indicate that priority setting in research may also be greatly influenced by the neighbourhood association, and these will be much helpful in developing and implementing evidence-based public health strategies.
Supplementary material
To view supplementary material for this article, please visit https://doi.org/10.1017/S0021932023000251
Data availability statement
The datasets used and analysed during the current study are available in the ‘Parliamentary Constituency Factsheet for Indicators of Nutrition, Health and Development in India’ repository [https://www.hsph.harvard.edu/population-development/indiapcfactsheets/](Kim et al., Reference Kim, Swaminathan, Swaminathan, Kumar, Rajpal, Blossom and Joe2019).
Acknowledgements
An earlier version of this manuscript was presented at the International Population Conference, IUSSP (December, 2021). All the comments of the participants helped in the strengthening of this manuscript.
Author contributions
AN conceptualised the study, led the data analysis, interpretation of the results, prepared the primary draft, and led the revisions. AS, DA, and SBA provided overall supervision, reviewed the manuscript for important intellectual content, and critically revised the manuscript.
Funding statement
No specific funding was received for conducting this study.
Competing interests
The authors declare that they have no competing interests.
Ethical standard
Not applicable. This study compiled and extracted data information from the Parliamentary Constituency Factsheet for Indicators of Nutrition, Health and Development in India, which is publicly available at https://www.hsph.harvard.edu/population-development/indiapcfactsheets/ and with no access to personal identifiers. Hence, no need of ethical approval for conducting this study.
Consent for publication
Not applicable.


 Open access