The historical evolution of national wealth addresses aspects central to the growth of welfare and economic development over the long run. A recent study by Thomas Piketty and Gabriel Zucman Reference Piketty2014) presented new evidence on the long-run trends in national and private wealth-income ratios for the four largest and richest Western economies: France, Germany, the United Kingdom, and the United States.Footnote 1 The key finding was that the importance of aggregate wealth has fluctuated grossly over time, being very high up to WWI and then falling until the 1970s after which it has started to increase. They also found that these fluctuations are mainly attributable to accumulated savings rather than to relative asset price gains.
Although these findings offer important insights, it is not clear whether they are also relevant for countries of different size, level of development, or political institutional setting. For example, in standard trade models, e.g., Stolper-Samuelsson, the value of capital may respond differently to a technological shock, such as industrialization, depending on a country's size: In large economies the demand shock makes existing capital more valuable through a relative-price effect but in small economies, where prices cannot change, the demand for new capital must instead be met by new savings or cross-border capital flows. If the level of development is key for wealth accumulation, then we should expect large differences at any point in time between the early industrializers studied by Piketty and Zucman and other countries later to industrialize. The role of institutions for wealth accumulation represents another, still largely unexplored, source of variation; for example, countries with generous provision of public welfare services fosters less need for private wealth accumulation, which affects both the level and structure of national wealth.
This article presents the first comparative analysis that contrasts the recent evidence of Piketty and Zucman with data on national wealth-income ratios for Sweden. Sweden offers a particularly promising case for a comparative analysis with the previously studied large countries. It is the archetypical small, open economy. It industrialized late and was predominantly agrarian several decades into the twentieth century. Furthermore, Sweden's twentieth century experience differs, both by not taking active part in any of the two World Wars and through the extension of one of the world's most egalitarian welfare states in the postwar era.Footnote 2 Making a full account of the determinants of wealth-income ratios would naturally require a larger country sample, but adding the case of Sweden can hopefully provide useful insights into some of the important patterns observed in the historical data.
The foundation of the analysis is a new historical database on Swedish aggregate national and private wealth and savings. This database covers the private sector, households, and corporations over the period 1810–2014 and the public sector, with both central and local government balance sheets from 1870–2014; describing the entire Swedish national wealth over the period 1870–2014. The private sector wealth database, which essentially consists of household balance sheets, includes subseries for non-financial and financial assets and liabilities, and subcomponents within each of these categories. The database also contains estimated pension assets in funded and unfunded private and public pension schemes, the stock of consumer durables and informal financial claims and debts within the (unconsolidated) private sector.
The findings reveal several new patterns in the evolution of Western aggregate wealth-income ratios. First, Sweden's ratio in the nineteenth century was only about half of those in Britain, France, and Germany, but almost exactly at par with the United States. The main explanation for the low Swedish level is that saving rates were very low in agrarian and industrializing Sweden, which prevented the accumulation of new wealth. The low U.S. wealth-income ratio, by contrast, was due to high savings being dominated by even higher levels of income growth. For the financing of Sweden's industrialization, Swedes instead appear to have turned abroad; the study documents substantial capital imports from the middle of the nineteenth century.
A second main finding is that government wealth has always been important in Sweden. While this is partly attributable to Sweden not having participated in wars since the early nineteenth century, and particularly staying out of the two World Wars in the twentieth century, another reason is the extension of postwar welfare-state institutions. In particular, a generous public pension system created a need for government assets to back its promises about future pension payments. Sweden thus differed from the large European economies in the nineteenth century, unable to save because of low incomes and therefore unable to accumulate domestic wealth, and in the twentieth century, mainly because of the expansion of political institutions linked to the universalistic welfare-state system.
Sweden: the economic historical context
Sweden in the nineteenth century was a poor and agrarian economy, located in the North of Europe. Its gross domestic product (GDP) per capita in 1850 was lower than what most countries on the European continent had, and towards the end of the century almost one million impoverished Swedes emigrated to North America to seek a better life. Sweden's industrialization started sometime after 1850, bringing a rapid expansion of a national railway system, technological advancements in both industry and agriculture, liberalization of business and financial modernization. Sweden has been described as a typical case of “upstream” industrialization (e.g., Cameron Reference Cameron1993), relying initially on the exports of raw materials such as timber and iron-ore exports and later developing a manufacturing industry where these materials were used to process finished goods. However, Lennart Schön (Reference Schön2012) has argued that this stylized characterization misses that Sweden indeed had its own early industrialization during the first half of the nineteenth century, with rising farming incomes following the agricultural revolution generating a demand for domestically produced industrial products.
Sweden joined the gold standard in 1873 and remained until its breakdown in 1914, returned to gold in the interwar era, and participated in the postwar Bretton Woods collaboration. Per capita economic growth rates increased during this long transition from an agrarian to an industrial society, going from less than 1/2 percent per year in the first half of the nineteenth century to between 1.5 and 3 percent per year between 1850 and the 1970s.Footnote 3
During the twentieth century, Sweden developed, as did most Western European countries during the interwar period, a parliamentary democracy, an educational sector, and entered international collaborations and trade agreements. But Sweden also experienced specific developments. Most notably, the country stayed out of both World Wars which contributed to the high economic growth performance during the postwar decades.
One of the most important political developments in twentieth century Sweden was the long and almost unbroken rule by Social Democratic governments between the 1930s and the 2000s, with brief gaps in the 1970s and 1990s. This long era of social-democratic rule paved the way for the emergence of one of the world's most extensive welfare states, encompassing a broad scheme of universal social insurance, centralized wage-setting, and far-reaching redistribution via the tax bill (Lindbeck Reference Lindbeck1997).
In the early 1990s, Sweden was hit by its gravest economic and financial crisis since the 1930s. Some have argued that this was the effect of structural economic problems from the 1970s and 1980s when the postwar policies of taxation and regulation clashed with technological development and globalization pressures. After some turbulent years in the 1990s with failing commercial banks, plummeting asset prices, soaring unemployment, and large fiscal deficits, Sweden initiated a thorough reform process, with liberalization of private markets and introducing rules for public policy, aimed at making both private and public sectors more efficient while keeping high egalitarian ambitions of the welfare state policies intact.Footnote 4
Concepts and measurement
The study builds on a new database, the Swedish National Wealth Database (SNWD), which contains annual national and private wealth and savings for Sweden over the period 1810–2014.Footnote 5 Definitions of all variables in SNWD follow the international standards of the System of National Accounts, SNA 2008 (United Nations 2009), and the European System of Accounts, ESA 2010 (Eurostat 2013).Footnote 6 The analytical and definitional framework is adopted from Piketty and Zucman (Reference Piketty and Zucman2014), and the Swedish database is structured in a fashion similar to their cross-country dataset. Although most of the series in the SNWD are newly collected, the database uses previous estimates of national wealth by scholars and statistical agencies and also the long-standing efforts by economic historians to build consistent historical national accounts for Sweden.Footnote 7
Private sector wealth, WPt , is estimated yearly since 1810 as the sum of the end-of-year market value of household net wealth (including non-profit institutions serving households) and the corporate sector net wealth. Household wealth, WHt , includes the total value of household-owned equity of non-financial and financial corporations, which means that the rest of privately owned corporate wealth is reflected in the “residual” between firms' market value and the replacement value of their net assets, WCt .Footnote 8 Public sector wealth, WGt , contains net assets of the central government (the state) and the local governments (counties and municipalities). National wealth, WNt , is the sum of private and government wealth. Note that national wealth in an open economy encompasses not only domestic capital, Kt , but also the net of assets and liabilities vis-à-vis foreigners, i.e., net foreign assets, NFAt , which means that we can also write national wealth as WNt = Kt + NFAt .
The main variable of interest in this study is the aggregate wealth-income ratio, βt = Wt /Yt , which shows how many annual national incomes Yt that are needed to earn the current stock of wealth. National income is the gross domestic product less capital depreciation, δ K, plus net foreign income, NFI. There are different β s for the different sectors in society, with βPt , βGt , and βNt denoting the wealth-income ratios of private, government, and national wealth.
Data on the historical wealth aggregates come from a variety of sources. In the interest of space, this section only makes a brief description but an Online Appendix presents details of all sources and calculations as well as several robustness checks.
Non-financial assets consist of produced assets, mainly dwellings, and non-produced assets such as urban and agricultural land and timber tracts. The main sources for these series are tax assessments of agricultural and non-agricultural property (both buildings and land), available annually over the full period. One important adjustment of these series is to convert tax-assessed values to market values, and this done using a range of published ratios of tax and market values in historical statistical publications and modern economic history research.
Financial assets reflect deposits and currency, shares, bonds, informal claims as well as life insurance savings and funded pension assets. Financial liabilities include loans from banks and other financial sector agents, state loans either to housing or to college studies, and public sector debt. Data come from annual reports of the banking and financial sector (saving banks, commercial banks, mortgage associations, insurance companies) and from government publications of balance sheets. Valuation is difficult especially for two of these items: non-listed corporate equity and government assets. For non-listed corporate equity, the main approach is to simply report used book values in relation to the incorporation of these firms, but for some of the earlier categories (e.g., manufactures) I have used earnings information and computed capital stocks from assumed capital-income ratios. Similarly, government assets for which there are no clear market prices (e.g., utilities, infrastructure) I have followed the valuation principles of contemporary accounting standards as reflected in published balance sheets.
Data on saving rates gross and net of depreciation, ![]() and
and ![]() , are calculated for each year since 1810.Footnote
9
Private saving rate is the sum of the personal and corporate saving rates (sPt
= sHt
+ sCt
) and the national saving rate is simply the sum of private and public saving (sNt
= sPt
+ sGt
). Data on savings are scarce before 1950, when Sweden introduced its official national accounts.Footnote
10
Between 1810 and 1950, therefore, savings are computed from the historical national accounts of Rodney Edvinsson Reference Edvinsson2005, 2014) as the sum of investments, gross or net of depreciation, and the sum of the current account (defined as the difference between exports and import of goods and services) and capital accounts (defined as the net foreign income). The sectoral decomposition of saving before 1950 is based on applying approximate and uncertain shares of national saving reported in Lars Lindberger (Reference Lindberger1956) and Lars Lundberg (Reference Lundberg1969).Footnote
11
After 1950, I use the numbers for household, corporate, government, and national saving reported in the official national accounts.
, are calculated for each year since 1810.Footnote
9
Private saving rate is the sum of the personal and corporate saving rates (sPt
= sHt
+ sCt
) and the national saving rate is simply the sum of private and public saving (sNt
= sPt
+ sGt
). Data on savings are scarce before 1950, when Sweden introduced its official national accounts.Footnote
10
Between 1810 and 1950, therefore, savings are computed from the historical national accounts of Rodney Edvinsson Reference Edvinsson2005, 2014) as the sum of investments, gross or net of depreciation, and the sum of the current account (defined as the difference between exports and import of goods and services) and capital accounts (defined as the net foreign income). The sectoral decomposition of saving before 1950 is based on applying approximate and uncertain shares of national saving reported in Lars Lindberger (Reference Lindberger1956) and Lars Lundberg (Reference Lundberg1969).Footnote
11
After 1950, I use the numbers for household, corporate, government, and national saving reported in the official national accounts.
In order to analyze some of the basic driving forces of national wealth accumulation, I adapt the theoretical framework of Piketty and Zucman (Reference Piketty and Zucman2014), also elaborated in Piketty (Reference Piketty2014). This builds on a simple model of wealth accumulation expressing new wealth as being generated by either new savings or capital gains, i.e., that ![]() . While savings and capital gains are themselves determined by numerous economic and institutional factors, this analytical framework allows me to decompose wealth accumulation into a saving-induced component (a volume effect) and a capital gains-induced component (a relative price effect).Footnote
12
. While savings and capital gains are themselves determined by numerous economic and institutional factors, this analytical framework allows me to decompose wealth accumulation into a saving-induced component (a volume effect) and a capital gains-induced component (a relative price effect).Footnote
12
Main trends: Sweden vs. Europe and North America
One of the central questions asked in this study is: Are differences in country size, economic development, or geopolitical events visible in the trends and levels of β? I approach this question by comparing the evolution of the Swedish wealth-income ratios with those of other industrialized economies.
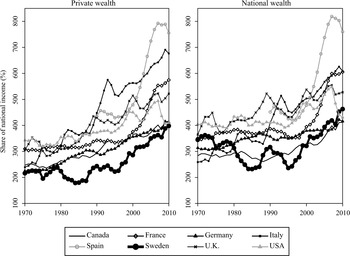
In Figure 1, private and national wealth-income ratios for ten industrialized countries from 1970 to 2010 are displayed. The two panels are relatively similar in level, which reflects a general pattern found across countries and time, namely that private wealth accounts for most of national wealth whereas government net assets are small or at times even negative (Sweden deviates from this pattern in some periods, as will be shown later). A full comparative account would, of course, bring in numerous country-specific factors, but if one restricts attention to how Sweden compares with the rest, two immediate results stand out. First, Sweden's wealth-income ratios are low. When only considering private sector wealth (left panel), the Swedish βP in the 1980s and 1990s hovers around approximately 200 percent (or two years of national income) against 200–400 percent in the other countries. In the 2000s, Sweden's ratio has increased to approximately 300 percent but the other countries are now at 400–600 percent. When considering national wealth (right panel), Sweden is more similar but always at the lower end. The two countries that appear to resemble Sweden the most in both cases are Canada and Germany. A second result is that Sweden appears to follow a similar trend of an increasing β, but the rise in Sweden occurs later, in the late 1990s, than in most other countries.

Figure 1 Wealth-Income Ratios in Europe and North America, 1970–2010
Turning now to the historical perspective, Figure 2 displays βP from 1810 in the countries for which such long-run evidence currently exists: France, Germany, the United Kingdom, the United States, and Sweden. In the nineteenth century, Sweden has a much smaller wealth-income ratio than the other European countries, roughly one-third to one-half of their levels. At the same time, Sweden is almost exactly on par with the level of the United States, which begins low at approximately 300 percent and then slowly increases to between 400 and 500 percent over the course of the century.Footnote 13 Looking at the twentieth century, all five countries' wealth-income ratios converge, caused mainly by falling ratios during WWI of the great European powers and then all countries experience further decreases until the 1980s, when all of them exhibit increases.

Figure 2 Evolution Of Private Wealth-Income Ratios, Five Countries, 1810–2010
Figure 3 presents the long-run development in national wealth-income ratios, βN . Although the time span is somewhat shorter, the patterns are almost the same as when private wealth was used. Before WWI, Sweden has the lower ratio than the rest of Europe but similar to the United States. In the twentieth century, the countries are all similar. It is interesting to note that low Swedish national wealth-income ratio discussed in relation to Figure 1 is actually a modern phenomenon, and does not materialize until the 1970s.

Figure 3 National Wealth-Income Ratios, Five Countries, 1870–2010
Decomposing wealth accumulation: Savings vs. capital gains
The analysis by Piketty and Zucman (Reference Piketty and Zucman2014) showed that almost all new wealth creation in the long run emanates from savings; capital gains matter primarily over shorter time periods (when capital stocks are more or less fixed). A priori one would not expect Sweden to fit this pattern. Sweden was poorer in the nineteenth century, and even if capital demand rose following the technological breakthroughs, domestic investment may not have sufficed to fulfill this need if people were too poor to save and invest. Furthermore, the small, open economy model predicts that domestic demand shocks have no impact on relative prices, i.e., interest rates in the case of capital demand shocks, and should instead spur cross-border capital imports.
In Table 1, I decompose the Swedish aggregate wealth accumulation into the relative contributions from savings and capital gains, using the wealth model discussed earlier. The table presents results for both private and personal saving rates. The former includes both household and corporate saving and the latter only household saving. The motivation for making this distinction is that private gross assets in the SNWD correspond to the household sector balance sheet (housing, bank deposits, shares, insurance savings, etc.) which maps directly against personal savings. Corporate savings are, in principle, also incorporated through the value of corporate equity, but in case there are deviations between book and market values of corporate equity (when Tobin's Q differs from one), then large corporate savings may not feed into firm values, rather spills over to the estimation of capital gains or losses in other asset markets, predominantly the housing market.Footnote 14 .
Table 1 Decomposing Wealth Accumulation Into Savings and Capital Gains

Notes: The contributions from savings (gWs
) and capital gains (q) are based on the two-sector model described in Section 2 using private net saving rates (![]() ) and personal net saving rates (
) and personal net saving rates (![]() ).
).
Sources: Sweden: SNWD, v. 1.3. France: Piketty and Zucman (Reference Piketty and Zucman2014), appendix table FR.4b (NB: 1870–1810 is actually 1810–1910). United States: Piketty and Zucman (Reference Piketty and Zucman2014), appendix table US4b. No data reported before 1870; no decompositions with personal saving data reported before 1950.
The main result from the table is that Sweden is different from the larger economies. Before 1910, capital gains were the most important source of Swedish real private wealth growth, regardless of saving concept. In both France and the United States, by contrast, saving stood for most (United States) or all (France) of wealth growth. During the twentieth century, Sweden becomes more similar, but only when using private saving. If one disregards corporate savings, saving rates are much lower and capital gains account for the major part of private wealth accumulation. Note that the same does not hold for France and the United States: switching between private and personal saving rates makes little difference, and underlining the finding that Sweden differs.
One possible explanation for the difference between Sweden and the larger economies could be that Swedish capital gains, which are backed out from the wealth accumulation model, and thus measured indirectly, are measured with error and are too large. I examine this by comparing the model-induced capital gains with actual capital gains observed in historical data over Swedish housing and stock markets in the nineteenth and twentieth centuries.Footnote 15 Table 2 shows four variants of capital gains (all net of inflation): (a) Housing price increases in the two largest cities (Stockholm and Gothenburg), (b) Stock returns on the Stockholm Stock Exchange composite index, (c) Model-induced capital gains using private saving rates, and (d) Model-induced capital gains using personal saving rates. The overall message is that the correlation between the actual and the estimated capital gains is relatively low, especially for the model using private saving rates. In other words, the simple structural model of section 2 decomposing wealth growth into net savings and capital gains performs remarkably well when evaluated against real-world price gains in housing markets and using personal saving rates but not when using private saving rates, a result that most likely reflects discrepancies between the measurement of corporate values in either book or market terms.
Table 2 Comparing actual and model-imputed capital gains in Sweden, 1870-2010

Sources:
(a): Housing price gains are derived from the prices of houses and apartments reported by Söderberg, Blöndal, and Edvinsson (2014) for Stockholm and Bohlin (2014) for Gothenburg, with all series combined into an unweighted average. (b): Stock returns are computed from the composite market index at the Stockholm Stock Exchange as reported by Waldenström (2014). (c) and (d): Capital gains-induced wealth growth comes from the Piketty-Zucman decomposition approach described in section 2, where the saving rate is for either the private sector as a whole (![]() ) or households only (
) or households only (![]() ) (see Table 1).
) (see Table 1).
Further explanations for the evolution of Swedish wealth-income ratios
Was Sweden “the U.S. of Europe”?
A main result in the previous section was that Sweden's wealth-income ratios before WWI differed substantially from those observed in Continental Europe and were instead closer to those of the United States. Is this similarity accidental or does it reflect the impact of features that were shared by nineteenth century Sweden and the United States, such as being sparsely populated and predominantly agrarian?Footnote 16
Before labeling Sweden “the U.S. of Europe,” a closer inspection of the data is required. Figure 4 decomposes β into three broad asset classes: agricultural land, housing, and other domestic assets.Footnote 17 Only one of the three, agricultural land, shows Sweden and the United States deviating from the other European countries. Agricultural land values before 1900 represented approximately 1–2 years of national income in the United States and Sweden compared to 3–4 years in France, Germany, and the United Kingdom. This accounts for most of the measured difference in aggregate wealth-income ratios.

Figure 4 Composition of Private Wealth, Five Countries, 1810-2010
What, then, explains the relatively low values of agricultural land in Sweden and the United States? The answer must be found in either low land prices (a relative price effect) or small areas of cultivated land (a volume effect) or a combination of the two. Piketty and Zucman (Reference Piketty and Zucman2014) also discuss the low U.S. agricultural land values, arguing that given the country's high saving rates and vast geographical areas the natural explanation is a low land price per acre.Footnote 18 Table 3 takes this prediction to the data and present farmland prices per acre in Sweden and the United States between 1800 and 1920, expressed in 1960 U.S. dollars.Footnote 19 There are two series for Sweden, one for cultivated farmland and one for farmland plus surrounding grassland, meadows, and pastures.Footnote 20 In 1800, an acre was worth, on average, 62 or 34 USD in Sweden depending on land base, but only 10 USD in the United States; a Sweden to U.S. ratio of between 3.5 and 6.5. In 1850, land prices had increased in both countries, but at a different pace: in Sweden by about one half and in the United States they almost tripled. Land prices in the two countries converged towards the end of the century and in the 1910s, the U.S. land value per acre had surpassed that in Sweden. In other words, U.S. land prices per acre were low in the nineteenth century, which supports Piketty and Zucman's assertion for the low U.S. wealth-income ratio.
Table 3 Land Values in Sweden and The United States, 1800-1920

Sources:
The Swedish land value per acre (4,047 square meters transformed from the Swedish unit hektar, 10,000 square meters) is computed by dividing the farmland value (from SNWD, v. 1.3, SE2.2) by the size of (1) total farmland and (1) farmland + total natural grassland (including meadows, pastures) using data from Statistics (Sweden 1959, table E2). (Lindert Reference Lindert, Rothstein and Field1993, Table 1) reports data from agricultural censuses and the official U.S. Department of Agriculture averages for the 48 states. Prices are in 1960 USD.
While explaining the relatively low wealth-income ratio in the United States, the land price evidence still leaves us with a puzzle for Sweden: If Sweden's land prices were so high (in relative terms), why were the country's aggregate value of agricultural land still so low in relation to national income? The standard wealth accumulation model would point to the volume effect, i.e., insufficient new savings to generate a stock of assets. As a final piece of evidence for examining this issue, Table 4 reports net saving rates and income growth rates since 1810 for all five countries analyzed here. Sweden's net saving rates were low throughout the nineteenth century, at only 2–3 percent of national income, which was about one-quarter of the saving rates found in the United States and France and the United Kingdom. Over time, the Swedish saving rates increased, and by the latter part of the twentieth century, all four countries seem to have converged.
Table 4 Saving and growth in four countries, 1810-2010

Sources:
The table shows net private saving rates (![]() ). Data on private net saving rates and growth are from Piketty and Zucman (Reference Piketty and Zucman2014), appendix tables for France (table FR.4b), the United Kingdom (table UK.5a), and the United States (table US.5a). Data for Sweden's calculations are from SNWD, v1.3, tables SE1.1, SE5.1.
). Data on private net saving rates and growth are from Piketty and Zucman (Reference Piketty and Zucman2014), appendix tables for France (table FR.4b), the United Kingdom (table UK.5a), and the United States (table US.5a). Data for Sweden's calculations are from SNWD, v1.3, tables SE1.1, SE5.1.
Summing up the discussion, the answer to the question “Was Sweden ‘the U.S. of Europe'?” must be “no.” The two countries were similar in their wealth-income ratios during the nineteenth century, but for quite different reasons. The United States had a low ratio mainly because of low land prices whereas Sweden had a low ratio because of insufficient domestic savings: the Swedes were simply too poor and earned too little in order to be able to save out of their income. Sweden was therefore not the United States of Europe, rather it was just more dissimilar to the other European countries included in the comparison, which calls for an investigation into the potential roots of the differing historical and institutional drivers of European wealth accumulation.
The Role of Foreign Capital
The importance of cross-border capital flows for the Swedish economy has often been highlighted in relation to two historical episodes: the industrialization era in the late nineteenth century and the high capital taxation era in the late twentieth century.
Nineteenth century Sweden was capital-scarce according to the previous analysis. Private wealth-income ratios hovered around 300–400 percent and for national wealth the level was only marginally higher. Did this capital scarcity imply that it was ultimately other people's money that was used to industrialize the country in the late nineteenth century? The role of capital imports in the Swedish industrialization process is not new, and previous research has documented both the size of capital flows and identified the main borrowers. However, there is no consensus over how important these foreign funds were. Some scholars point to balance sheets of industrial firms which indicate that most of the borrowed capital came from domestic banks, not foreign financiers (Gårdlund Reference Gårdlund1942). Others have emphasized the role of foreign capital imports (Schön Reference Schön and Dahmén1989), arguing in particular that even though Swedish banks indeed did lend money to Swedish industrial corporations, Swedish banks were, in turn, largely capitalized by foreign loans. Furthermore, the Swedish government borrowed abroad to finance the railway expansion, which benefited domestic industrialization, and that also left some funds for the private industry to borrow, which otherwise may not have been available (Schön Reference Schön2012).Footnote 21
In Figure 5, I describe the sum of net foreign assets (defined as all claims on foreigners' net of foreign claims on citizens at current market prices) to national income since 1810. Sweden was evidently a net capital importer during the entire industrial take-off of the second half of the nineteenth century, with foreign wealth representing approximately one-half of a year's incomes. Most of these foreign funds came from German and French creditors who bought Swedish bonds floated on the Hamburg and Paris markets (Franzén Reference Franzén1998, p. 110). Compared with the other countries, Sweden was the largest net debtor and only the United States had a negative foreign position, but at a smaller level, whereas France, Germany, and the United Kingdom were instead net creditors on international capital markets.Footnote 22 Gauging the quantitative importance of these foreign funds for Swedish industrialization is difficult. During the expansive industrial period 1880–1910, the net foreign assets were about the same size as the stock of commercial bank credit and roughly 150 percent of central government debt.Footnote 23 But when comparing the 1908 cumulate stock of private Swedish bonds floated abroad to all corporate bank credits in that year, the share is only one-tenth.Footnote 24 .

Figure 5 The Role of Foreign Capital, 1810–2010
Towards the end of the twentieth century, foreign capital mattered less in all Western economies, including Sweden. Perhaps due in part to capital flows taking less legal and disclosed shapes. A particular debate in Sweden has concerned tax-driven capital flight that, according to some, was substantial during the 1980s, 1990s, and 2000s when Sweden combined internationally high capital taxes and a liberalized capital account. Roine and Waldenström Reference Roine and Waldenström2009) attempted to estimate the size of this potential illicit offshore wealth stored in tax havens by cumulating the net errors and omissions in the Balance of Payments statistics.Footnote 25 Figure 6 extends their series up to 2014, and adds to the estimates the fortunes of a few named super-rich Swedish individuals living abroad but who are included in journalists' rich lists of Swedish billionaires.Footnote 26 As much as 10–15 percent of Swedish private wealth could be located in tax havens according to these, admittedly uncertain, estimates. While these are sizeable amounts, they do not suffice to alter the main conclusions drawn in previous sections of Sweden today as a relatively capital-scarce country among the other Western nations.

Figure 6 Offshore hidden wealth of Swedes since 1980
The Role of Government Wealth
The last specific investigation into Sweden's wealth-income ratios concerns the public sector balance sheet. There are reasons why Sweden may stand out in this particular respect. One is that Sweden did not fight a war after 1809, and most importantly stayed out of the two damaging World Wars of the twentieth century. Another is the egalitarian Welfare States that the country developed in the postwar era, which created a large financial pressure on government finances regarding its commitment to deliver public services. Despite the vast previous research on the role of political and economic institutions for the size and scope of government, quite little is known about the impact on national balance sheets.Footnote 27 This section examines two specific dimensions to shed some light on the issue: the evolution of the size of government wealth and the importance of the unfunded public pension system.
Government Wealth-Income Ratios
Figure 7 presents government wealth-income ratios, βG , for the same five countries over the past 140 years. Public sector wealth in Sweden is much smaller than private wealth, just like in all the other countries, but two features stand out. First, Sweden had the largest government sector in terms of net assets over almost all time periods.Footnote 28 In the nineteenth century, state-owned railways dominated central government assets alongside crown land. In the postwar period, the accumulation of government wealth was rapid and one important reason was the expansion of the public pension system that caused a peak in the βG at 120 percent. Also noteworthy is that there are no periods when the Swedish public sector has had a negative net position, not even during the periods of extensive foreign borrowing in the late nineteenth century or during the economic crisis of the 1990s.Footnote 29 Second, the impact of wars on government wealth is clear from the figure. The fact that Sweden stayed out of the two World Wars allowed the country to avoid the maximal pressure on public finances seen in, for example, France and the United Kingdom during the wartime episodes.

Figure 7 Government Wealth-Income Ratios, Five Countries, 1870–2010
Pension Wealth Effects
Pensions represent a sizeable share of most households' lifetime incomes and thus a considerable financial commitment on behalf of employers and government. Despite this, the wealth concept analyzed so far has not included all forms of pension entitlements. In the official definition of wealth in the System of National Accounts, only funded, defined contribution (DC) pensions in either public or private schemes are counted as wealth, whereas unfunded, defined benefit (DB) pensions are not. The main reason for disregarding the unfunded DB pension wealth is that it only represents a claim on future incomes and is not a tangible asset today, which means that there is no equivalent tangible liability held by the policyholder (the state or a private employer). Some have questioned the exclusion by claiming that these entitlements crowd out private wealth accumulation (see, e.g., Feldstein Reference Feldstein1974, for the United States and Lennart Berg Reference Berg1983, for Sweden) and would thus have materialized as private wealth had there been no DB pensions.
Figures 8 and 9 show evidence of the impact of the total value of pension wealth, including both funded pension assets and the estimated value of unfunded pension wealth, on the private wealth-income ratios in Sweden, the United Kingdom, and the United States. Figure 8 begins with the case of Sweden, presenting four different series:Footnote
30
βP
= WP
/Y, the Swedish private wealth-income ratio; ![]() the same but excluding all DC pension assets;
the same but excluding all DC pension assets; ![]() which includes all DC and the present value of DB pension wealth;
which includes all DC and the present value of DB pension wealth; ![]() which also adds the total value of government-controlled pension buffer funds, called Allmänna Pension (AP) funds, which were built up in the 1960s and 1970s by income taxes and sometimes referred to as “forced personal savings.” In 2014, the sum of private wealth and total pension wealth in the public and private systems amounts to seven years of national income, i.e., approximately 1.5 times the private wealth-income share. Before the postwar era, pension entitlements were, according to my estimates, unimportant relative to other private net assets. Particularly notable is the quantitative insignificance of the universal public pension system that came in 1914, being the first in the world, containing basic guarantee pensions (folkpensioner) for all elderly individuals. More important were the extensions of the pension system coming with the 1947 reform (substantially raising basic guarantee pensions) and the 1960 reform when public pensions for white-collar workers were elevated. These two events lifted the value of pension wealth from a tiny fraction of private wealth to 100 percent of total private wealth in 1960.
which also adds the total value of government-controlled pension buffer funds, called Allmänna Pension (AP) funds, which were built up in the 1960s and 1970s by income taxes and sometimes referred to as “forced personal savings.” In 2014, the sum of private wealth and total pension wealth in the public and private systems amounts to seven years of national income, i.e., approximately 1.5 times the private wealth-income share. Before the postwar era, pension entitlements were, according to my estimates, unimportant relative to other private net assets. Particularly notable is the quantitative insignificance of the universal public pension system that came in 1914, being the first in the world, containing basic guarantee pensions (folkpensioner) for all elderly individuals. More important were the extensions of the pension system coming with the 1947 reform (substantially raising basic guarantee pensions) and the 1960 reform when public pensions for white-collar workers were elevated. These two events lifted the value of pension wealth from a tiny fraction of private wealth to 100 percent of total private wealth in 1960.

Figure 8 The role of pension wealth in Sweden

Figure 9 Unfunded pension wealth in Sweden, the United Kingdom, and the United States
Is the large impact of unfunded pension wealth a pattern that is unique for Sweden, or is it a common characteristic of all developed economies? Unfortunately, it is difficult to answer this question properly due to a general lack of aggregate pension wealth data, in particular over longer time periods (Piketty and Zucman excluded DB defined-benefit pensions from their analysis). However, there are some pieces of historical time series evidence on both DC and DB pension wealth for the United Kingdom and the United States. For the United Kingdom, Blake and Orszag (1999) present estimations of the size of pension assets on a yearly basis between 1948 and 1994.Footnote 31 For the United States, Edward Wolff Reference Wolff1989, 2011, 2015) and Wolff and Marcia Marley Reference Wolff1989) estimate variants of private and pension wealth in various years since 1922 using data from national accounts, estate tax records, and wealth surveys, while the Investment Company Institute (2015) reports annual totals since 1974.Footnote 32 I also include a share of the net present value of Social Security benefits related to old-age and survivors insurance (OASI) which are essentially retirement payments. Adding OASI benefits is important as it increases the pension asset amount by at least half in the recent period.
The international comparison of the importance of unfunded pension wealth is shown in Figure 9, which displays wealth-income ratios with and without unfunded pension wealth for Sweden, the United Kingdom, and the United States over a large part of the twentieth century. All three countries exhibit increasing trends in the share of unfunded pension wealth in total private wealth over the period (or at least until the late 1990s), but the levels of these shares differ between the countries by an order of magnitude. Before the 1940s, unfunded pension wealth was insignificant, amounting to only 5 to 10 percent of total private wealth. During the 1950s unfunded pension wealth became more important as the countries expanded their social security systems and amounted to around one-third of private wealth in all three countries. However, from the 1960s onwards, Sweden's unfunded DB pensions were extended and became worth as much as all private wealth while they still only amount to one-third in the United Kingdom and one-half in the United States. Another difference is that almost all this unfunded pension wealth in Sweden has been tied to public pension schemes but in the Anglo-Saxon countries it is more of a mixture between private and public schemes.
Taken together, the comparative account of the historical evolution of government wealth presented in this section suggests that Sweden was not drastically different from the large European economies or the United States. The eras when Sweden differs the most were the World Wars and the postwar period. This last one was the ambitious egalitarian Social-Democratic era in Sweden, when policies put pressure the government to create tremendous financial reserves to be able to honor its commitments and thus generating large positive net positions.
Summary and conclusions
In this study, I set out to analyze the historical development of aggregate wealth-income ratios in the Western world. While such trends were studied recently by Piketty and Zucman (Reference Piketty and Zucman2014), the unique contribution of this article is to contrast their evidence on some very large and advanced economies with new evidence on a small and relatively backwards economy: Sweden. At the core of the analysis lies a new historical dataset on Swedish national wealth and its components spanning two centuries.
Lessons can be learned from such a comparative analysis. Having only a few countries and a large number of potential driving factors, some being common and others distinct across countries, will, of course, limit the ability to make a full account. Yet the addition of Sweden increases the cross-country variation in size, level of development, and institutional structure and therefore opens up for some tentative conclusions to be made. A first main finding is that Sweden did not follow the same pattern as the other European countries, especially during the nineteenth century but to some extent also in the twentieth century. Swedish households were poorer, both in per capita wealth and aggregate wealth-income ratios. Up until WWI Sweden's wealth-income ratio was about half of that in France, Germany, and the United Kingdom, but on par with the one in the United States. Examination shows, however, that the underlying reasons the low levels differed; Sweden's low ratio was due to low saving rate while the low U.S. ratio was due to high income growth.
A second finding is that capital gains mattered more for wealth accumulation in Sweden, and even over long-run periods. Although measurement errors (poorly estimated saving rates) could potentially explain some of this difference, the Swedish estimates are partly in line with evidence on actual capital gains recorded on historical housing and stock markets.
A third main result is that political and economic institutions seem to matter for wealth accumulation, a largely overlooked question in previous studies. Sweden's different political context and welfare-state institutions vis-à-vis those in Continental European and Anglo-Saxon countries offer a unique opportunity to examine this issue. The evidence indicates an extraordinarily large growth of Swedish government wealth in the postwar era, precisely during the intensive expansion of the social democratic welfare state. A particularly important component appears to have been the establishment of a comprehensive public pension system, which slashed private incentives to save privately for old age. When comparing the total retirement wealth, including the net present value of defined benefit pensions, in Sweden with estimates for the United Kingdom and the United States, results suggest that Sweden stands out also in this respect.
These findings need to be interpreted cautiously as they are bounded by several shortcomings, not least regarding the small number of countries available in the current long-run dataset. They nevertheless offer a first comprehensive account of the nature of national wealth and its evolution over time when considering both large and small developing countries. Future studies encompassing more countries will hopefully be able to build upon them and further contribute to our understanding of these important matters.