


1. Introduction
Many existing studies have demonstrated the importance of financial literacy. As a key determinant of wealth inequality, financial knowledge helps individuals make investment decisions and better allocate financial resources (Lusardi et al., Reference Lusardi, Michaud and Mitchell2017). People with more financial knowledge learn about new financial issues faster (Delavande et al., Reference Delavande, Rohwedder and Willis2008). The lack of financial literacy, on the other hand, can lead to high-cost borrowing (Lusardi & Tufano, Reference Lusardi and Tufano2015), and inadequate financial planning for both the short- and the long-term (Lusardi & Mitchell, Reference Lusardi and Mitchell2011b, Reference Lusardi and Mitchell2014).
Financial knowledge is especially critical in the US today – as the economy has just experienced the COVID-19 pandemic, a spike in inflation, and a subsequent increase in interest rates. The uncertainties and risks in the macroeconomic environment amplify the importance of financial literacy. Despite its importance, financial literacy is low in the US (Lusardi & Mitchell, Reference Lusardi and Mitchell2011b, Reference Lusardi and Mitchell2014, Reference Lusardi and Mitchell2023).
In this paper, we analyze financial literacy in the US, using the most recent data from the National Financial Capability Study (NFCS), collected by the Financial Industry Regulatory Authority (FINRA) Investor Education Foundation in 2021. This is a very large data set allowing us to do an in-depth analysis of both financial literacy and its link to financial wellbeing.
Several findings emerge. First, we show that low levels of financial literacy documented, for example in Lusardi and Mitchell (Reference Lusardi and Mitchell2011b), continue to persist. Less than 30% of respondents in the NFCS could answer three basic financial literacy questions correctly. Second, not only is financial literacy low but it is unevenly distributed. Younger people, females, Black Americans and Hispanics, and those with low education attainment (high school or less) were among the least financially literate, including knowing little about inflation. Older people generally had more financial literacy; moreover, those who had lived through prior inflationary periods knew more about inflation than younger generations. Third, people overestimated how much they knew, and the gap between one’s actual financial knowledge and self-perception was often large. People who had less financial literacy tended to be more overconfident about their knowledge. Fourth, financial literacy matters as it is associated with financial behaviors and outcomes. Our results show that the more financially literate respondents were more likely to have planned for retirement, prepared for economic emergencies, and kept their debt at a manageable level.
The paper is organized as follows: In section 2, we lay out a few economic characteristics and conditions of the US. In section 3, we discuss the data and summary statistics. In section 4, we show the results of descriptive and regression analyses. We conclude in Section 5 with some thoughts on how to improve financial literacy in the US.
2. Economic conditions in the US
As of 2020, the US population was over 333 million, with about 60% non-Hispanic White, 14% non-Hispanic Black, 18.9% Hispanic or Latino, and 6.1% Asian. The population is ageing: about 16.8% of Americans are over 65. The fertility rate has also declined: total births per woman decreased from 3.65 in 1960 to 1.66 in 2021 (FRED, 2023c). Educational attainment has steadily increased: the percentage of people with a college degree increased from 7.7% in 1960 to 37.9% in 2021 (Statista, 2023); however, there has been a decline in male enrollment in college since the Great Recession of 2008. And the gender gap in educational attainment continues to widen: in 2020, only 41% of students enrolled in college were male (Smith, Reference Smith2021).
Besides the changes in demographics, we must note several important changes in the US financial markets and financial system in the last several decades, which have increased the stake in financial decision-making at the individual and household levels. First, since the 1970s, retirement plans shifted away from defined-benefit (DB) plans to defined-contribution (DC) plans and Individual Retirement Accounts (Lusardi & Mitchell, Reference Lusardi and Mitchell2011b, Reference Lusardi and Mitchell2014). The transition to the DC retirement saving model meant that individuals were now responsible for preparing for their golden years.
Second, financial institutions and financial markets have become increasingly complex. Meanwhile, the advance of technology has enabled people to trade stocks, options, bitcoins, and other financial instruments from the convenience of their personal computers and smartphones. Online banking has made it easier for people to transfer money with a click. For those with inadequate financial knowledge, such convenience to engage in financial transactions and trading can expose them to undesirable risks and potentially disastrous outcomes.
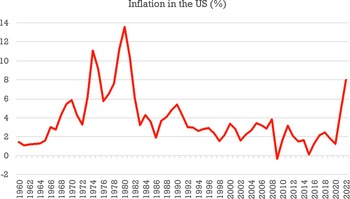
Third, following the COVID-19 pandemic, the US experienced the highest inflation since the mid-1980s. The growth rate of the consumer price index increased from 1.2% in 2020 to 8% in 2022 (see Figure 1). As a result, real earnings declined by about 7.6% during the same period (FRED, 2023b). The last high inflation episode happened more than three decades ago, thus many younger people had no memory of fast-rising prices. Knowledge of inflation is crucial in deciding asset allocation, consumption, borrowing, and more. For those experiencing high inflation for the first time in life, a lack of financial literacy can lead to both poor economic decisions and anxiety.
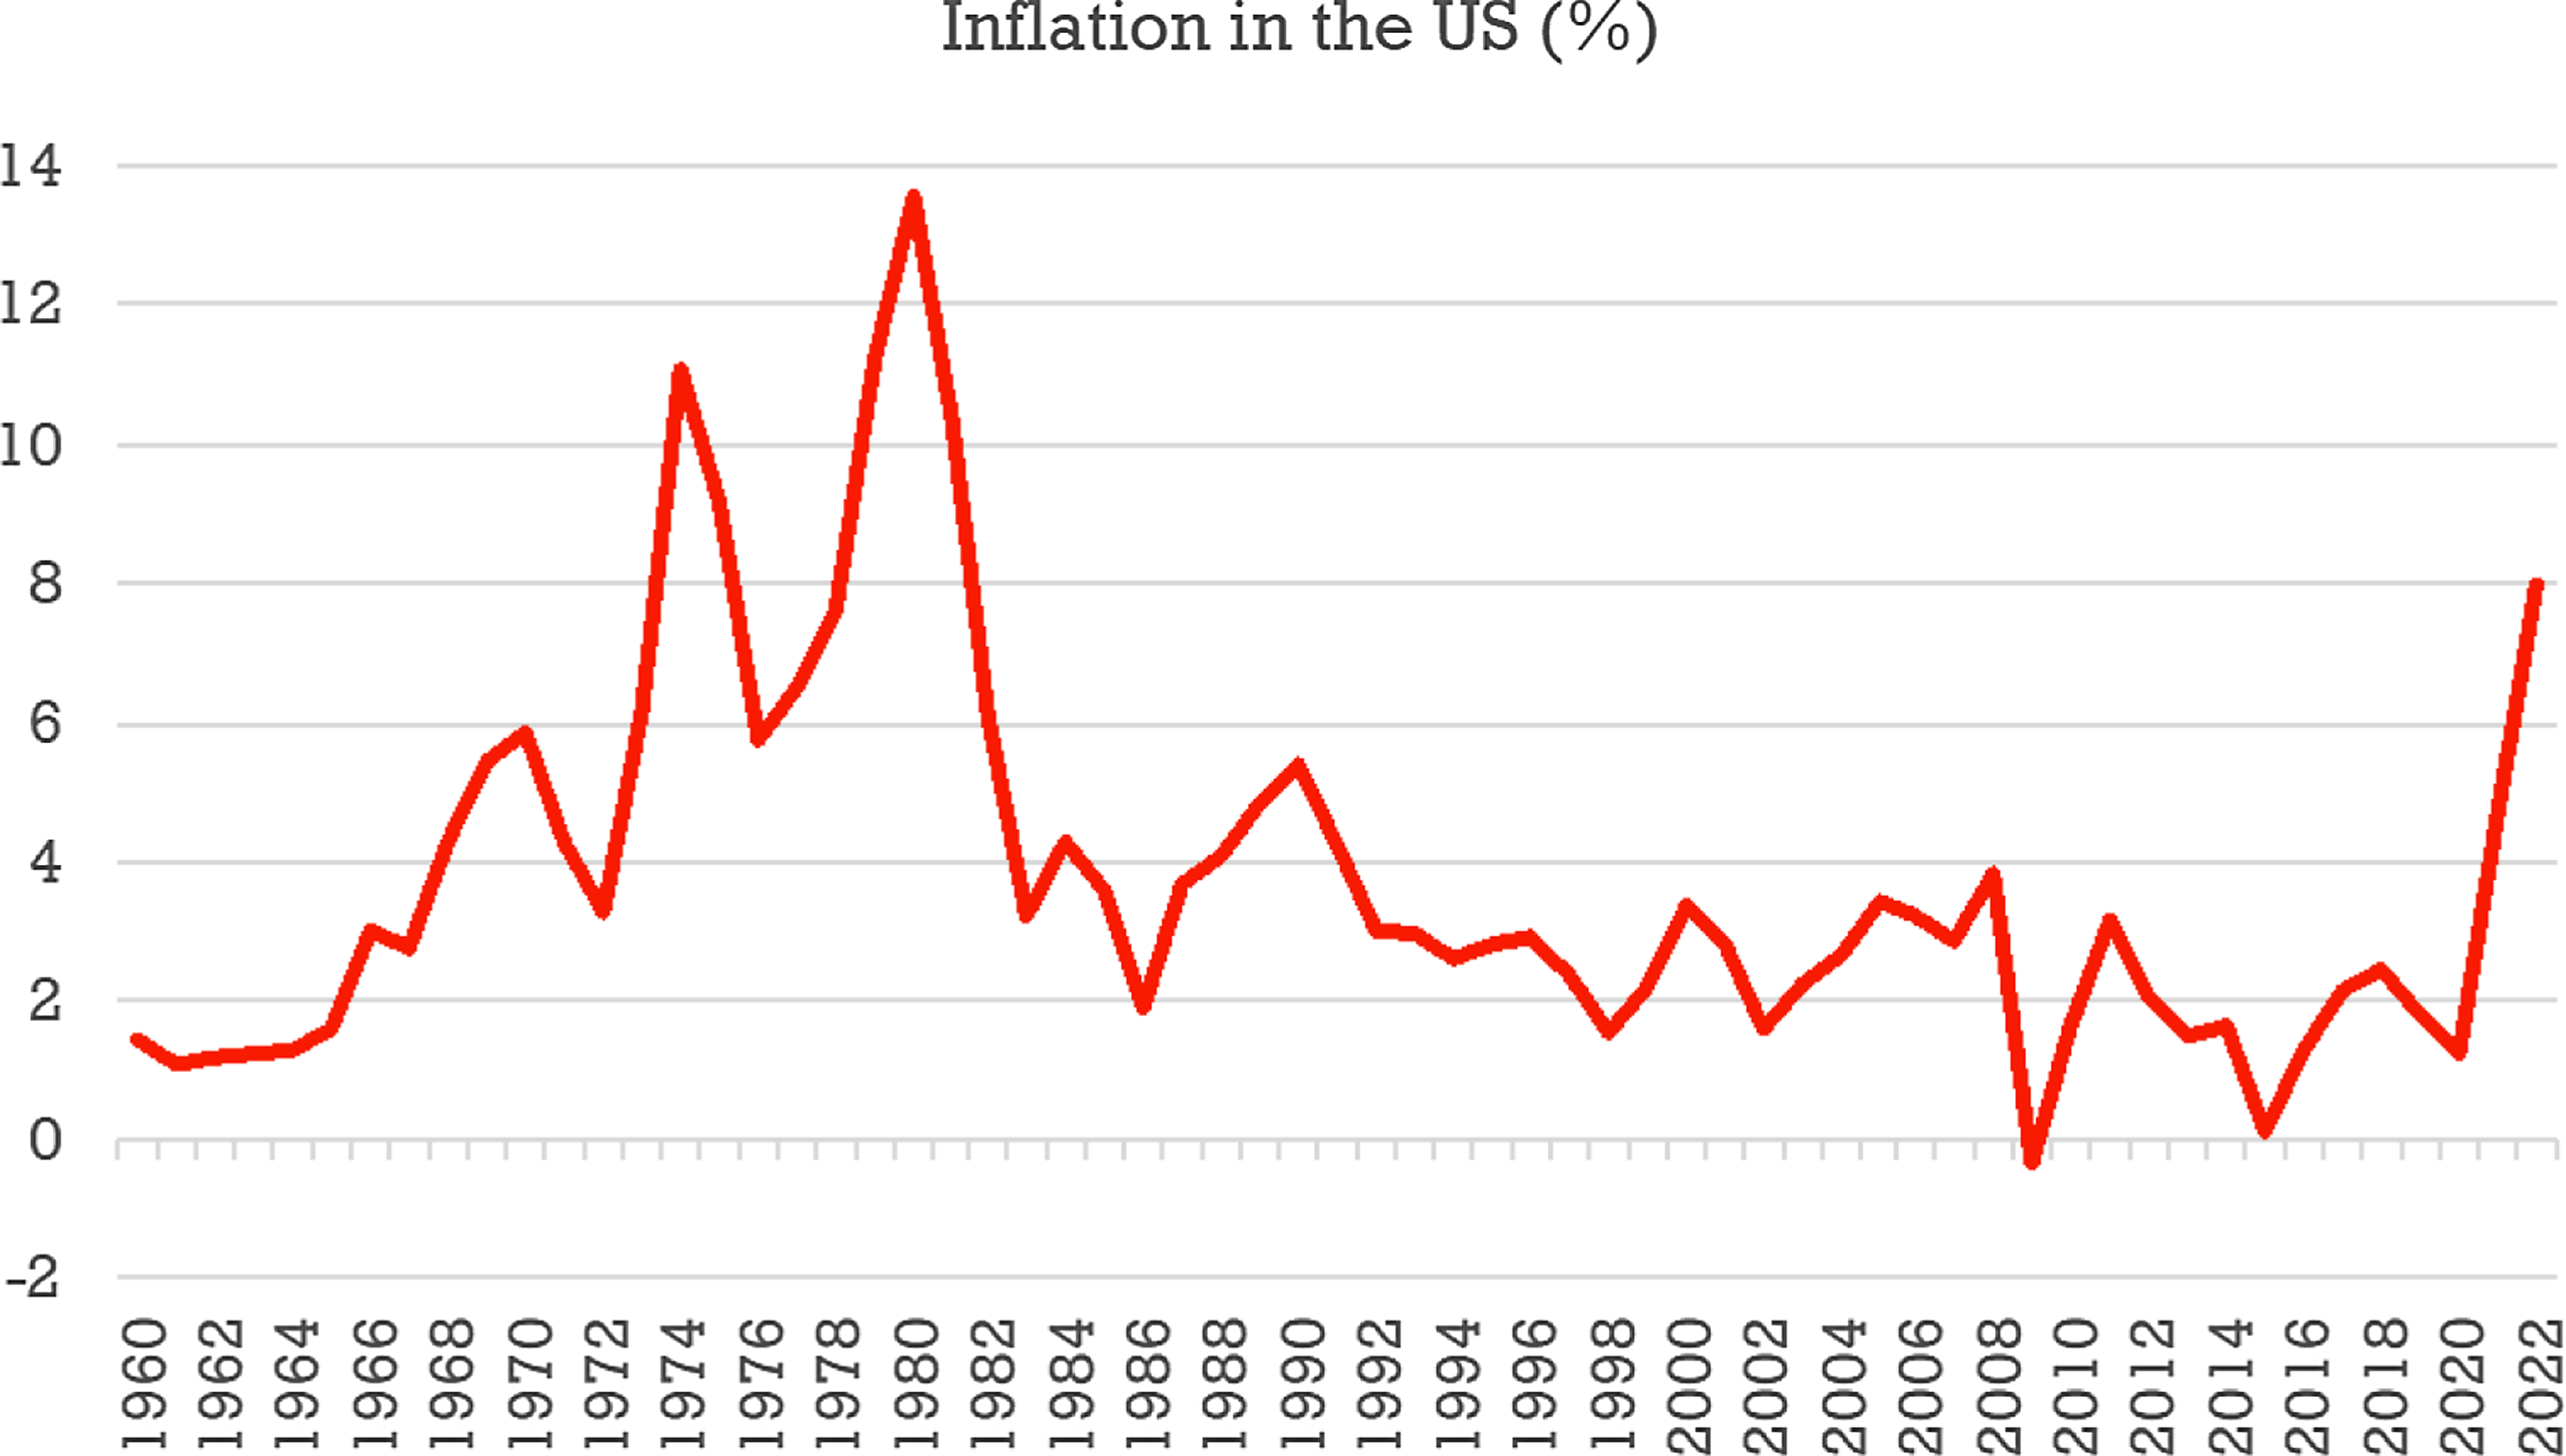
Figure 1. Inflation in the US (%), 1960–2022.
Source: FRED (2023).
Fourth, the loose monetary policy and low-interest rate environment in the US over the last several decades until early 2022 incentivized household borrowing and spending, and sometimes risky investment, but disincentivized savings. Indeed, the market yield on the 10-year Treasury decreased from 15.8% in 1981 to 0.55% in 2020 (FRED, 2023e). The 30-year fixed rate mortgage average fell from 18.44% in 1981 to 2.87% in 2021 (FRED, 2023a). Household debt as a percent of GDP rose instead from 24.8% in 1950 to 99.15% in 2008. Although this ratio decreased somewhat after the Great Recession, it still hovered around 80% (IMF, 2023). Between February 2022 and February 2023, the commercial bank interest rate on credit card plans rose from 14.56% to 20.09% (FRED, 2023d). Such rising interest rates can impact those carrying credit card debt, who now face higher borrowing costs.
Financial literacy is critical in helping individuals and households navigate complex financial circumstances and make sound financial decisions. In the next section, we explain the data that we use in our work.
3. Data overview and summary statistics
Since 2009, the FINRA Investor Education Foundation has conducted a detailed survey every three years known as the NFCS, which examines key indicators of financial literacy and financial capability, perceptions, attitudes, experiences, and behaviors.
This paper uses the latest wave of NFCS data, fielded from June to October 2021. The sample consisted of 27,118 adults (18+) across the US with about 500 respondents from each state and the District of Columbia. The respondents were drawn from onlineFootnote 1 panels and were offered incentives to participate. The survey responses were weighted to be representative of the national population in terms of age, gender, ethnicity, education, and Census Division. As with previous NFCS State-by-State surveys, the questionnaire did not specifically target heads of households or primary financial decision-makers (FINRA Investor Education Foundation, 2021).
We must keep in mind the potential implications of the unusual context of the COVID-19 pandemic on our results. The pandemic and the inflationary environment exposed some individuals and families to unexpected economic shocks. For example, one in five respondents in the 2021 NFCS said they were laid off or furloughed due to the pandemic during 2020 or 2021, and more than one in four respondents experienced a large, unexpected drop in income (FINRA Investor Education Foundation, 2022).
Summary statistics are in Appendix Table A1. In the full sample, there were 27,118 individuals, with an average age of 47 years. About 31% of the respondents had a high school education or less, 39% had some college, 21% had a college degree, and 9% had a graduate degree. About 47% of the respondents were married and 36% were single. In terms of employment status, about 46% were working for an employer full-time or part-time, 8% were self-employed, 21% were retired, and the rest were not employed, including homemakers, full-time students, disabled, and the unemployed. Close to 60% were homeowners. In the next section, we will perform our empirical analyses on the total sample but also look at sub-groups and those in the working years and who are not retired yet.
4. Empirical analysis and results
4.1. How financially literate are individuals in the US?
Survey respondents were asked three carefully crafted financial literacy questions – the “Big Three” (Lusardi & Mitchell, Reference Lusardi, Mitchell, Lusardi and Mitchell2011a) – which measure the knowledge of basic but fundamental concepts underlying financial decision-making. The exact wording of the questions is as follows:
Q1. Understanding of interest rate (numeracy)
“Suppose you had $100 in a savings account and the interest rate was 2% per year. After 5 years, how much do you think you would have in the account if you left the money to grow?”
-
a) More than $102 (correct)
-
b) Exactly $102
-
c) Less than $102
-
d) Do not know
-
e) Refuse to answer
Q2. Understanding of inflation
“Imagine that the interest rate on your savings account was 1% per year and inflation was 2% per year. After 1 year, would you be able to buy?”
-
a) More than today
-
b) Exactly the same as today
-
c) Less than today (correct)
-
d) Do not know
-
e) Refuse to answer
Q3: Understanding of risk diversification
“Do you think that the following statement is true or false? ‘Buying a single company stock usually provides a safer return than a stock mutual fund.’”
-
a) True
-
b) False (correct)
-
c) Do not know
-
d) Refuse to answer
The question on interest rates tests whether respondents have basic numeracy and the capacity to do simple calculations in the context of interest compounding. The question on inflation is particularly relevant for the 2021 wave of the survey as the US was experiencing rising inflation. The last question assesses people’s understanding of risk diversification. This is important for those actively engaged in the stock markets, and buying stocks and mutual funds.
Responses to the financial literacy questions are summarized in Table 1. Panel (A) shows that about 69.4% of all respondents could correctly answer the interest rate question. Many people could not do these calculations: 14.2% answered the question incorrectly and another 15.4% simply did not know the answer.
Table 1. Summary statistics for the Big Three financial literacy questions, NFCS 2021
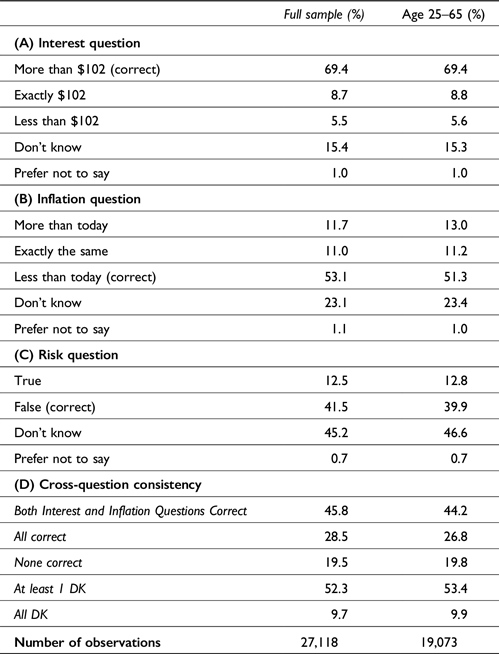
Note: Figures are weighted. DK indicates respondents who do not know.
Respondents had more difficulty answering the inflation question, where 22.7% answered incorrectly and another 23.1% did not know the response to this question (Panel B). The pattern of answers changes with risk diversification, where the proportion of do not know answers jumped to more than 45%; this is the topic about which people knew the least (Panel C).
Panel (D) examines the correlation between responses to the Big Three financial literacy questions. Less than 50% of the respondents know about interest rates and inflation, and fewer than 30% of the respondents got all three questions correct. Nearly 20% answered none of the questions right. More than half of the respondents indicated they did not know the answer to one or more questions, and nearly 10% did not know how to answer all three questions. These are alarming findings given the complex financial decisions that individuals must make.
4.2. Who is financially illiterate?
We compare the level of financial literacy across socio-demographic subgroups in Table 2. Previous studies (Lusardi & Mitchell, Reference Lusardi and Mitchell2011b, Reference Lusardi and Mitchell2011c) have documented a hump-shape profile with respect to age. This is not confirmed by the present study. The 2021 wave of the survey shows that financial literacy is lowest among younger persons and rises with age. Only 14% of the youngest respondents answered all three questions correctly, compared to 47% of those over 65. The age gap in financial knowledge was bigger for the knowledge of inflation and risk diversification. Only 34% of the youngest group answered the inflation question correctly, compared to 76% of the 65+ group. On the risk diversification question, the 65+ group was twice as likely to answer it correctly compared to those under 35. It is possible that the hump-shape profile found by the prior study was not an age effect but a cohort effect.
Table 2. Distribution of responses (%) to financial literacy questions by age, sex, education, and employment status in the 2021 NFCS. Full sample
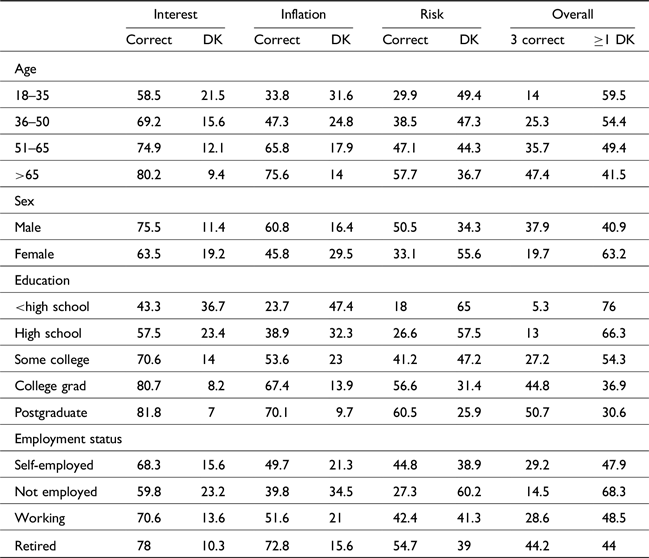
Notes: All figures are weighted. DK indicates respondents do not know.
Compared to men, women were less financially literate, and the gender knowledge gap was substantial. While close to 38% of men answered all three questions correctly, the proportion among women was only half that (19.7%). Across the three financial literacy questions, women knew more about interest rates than about inflation and risk diversification: only 46% and 33% of women could correctly answer the inflation and risk diversification questions, respectively. Women were much more likely to answer “do not know” to each of the Big Three questions than men. The high prevalence of “do not know” responses can be attributed to both a lack of confidence and a lack of knowledge (Bucher-Koenen et al., Reference Bucher-Koenen, Alessie, Lusardi and van Rooij2021).
Not surprisingly, financial literacy was correlated with educational attainment, and the knowledge gap was the largest between those with and without a college education. A college graduate was over three times more likely to have answered all three questions correctly than a high school graduate (45% vs. 13%). The differences between a high school graduate and those with some college were larger than between people with some college and those with a Bachelor’s degree. However, even the best educated displayed low financial literacy. About 30% of those with a graduate degree did not answer the inflation question correctly, and 40% of them did not answer the risk diversification question correctly.
Lastly, financial literacy differed by employment status. The not-employed group did the worst – only 14.5% answered all three questions correctly. This group of respondents included full-time students, the unemployed, the disabled, and homemakers. Interestingly, the self-employed and those working for an employer performed similarly. The retiree group did the best of all, as the older respondents in this survey were the most financially literate.
4.2.1 Inflation knowledge in the US
The NFCS survey used in this paper was conducted in the second half of 2021 when inflation was on the rise in the US. As shown in Figure 1, inflation was high in the US in the 1970s to mid-1980s, reaching 14 percent at its peak in the early 1980s. After that and up until 2020, inflation remained low around 2–4 percent. After 2020, however, inflation started rising again: between 2020 and 2022, inflation increased from under 2 percent to 8 percent.
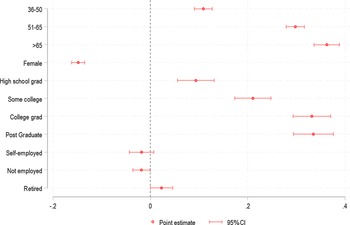
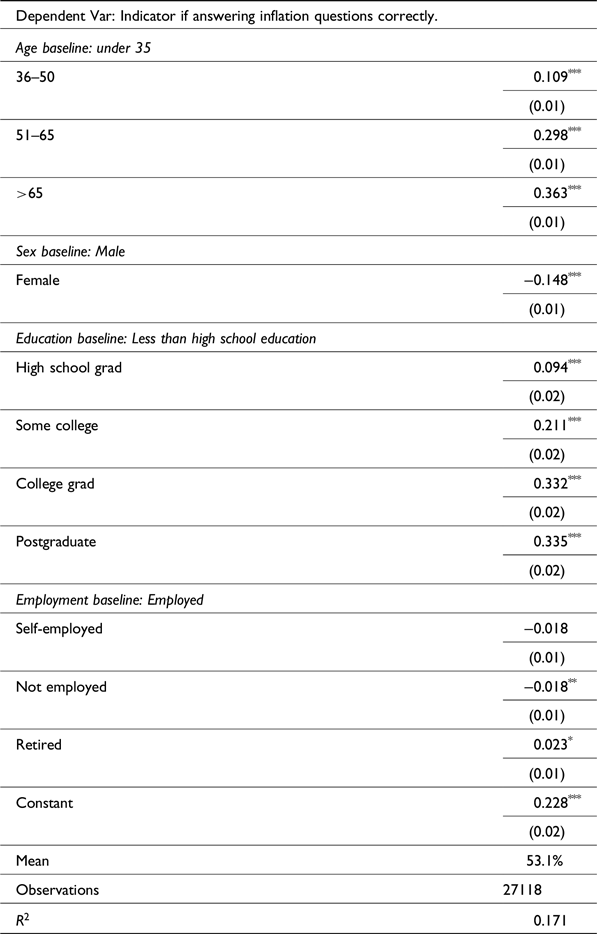
In this section, we focus on inflation knowledge and its correlation with socio-demographic characteristics. Ceteris paribus, people who were younger, female, less educated, or not employed knew less about inflation. Age being one of the most significant predictors of inflation knowledge suggests that the experience of a high inflation period helps people get a grasp of this concept. Respondents in our survey who lived through the high inflation period in the 1970s and early 1980s were more likely to understand inflation. Compared to people under age 35, the likelihood of someone age 65+ answering the inflation question correctly was 36.3 percentage points higher (Figure 2 and Table 2a).
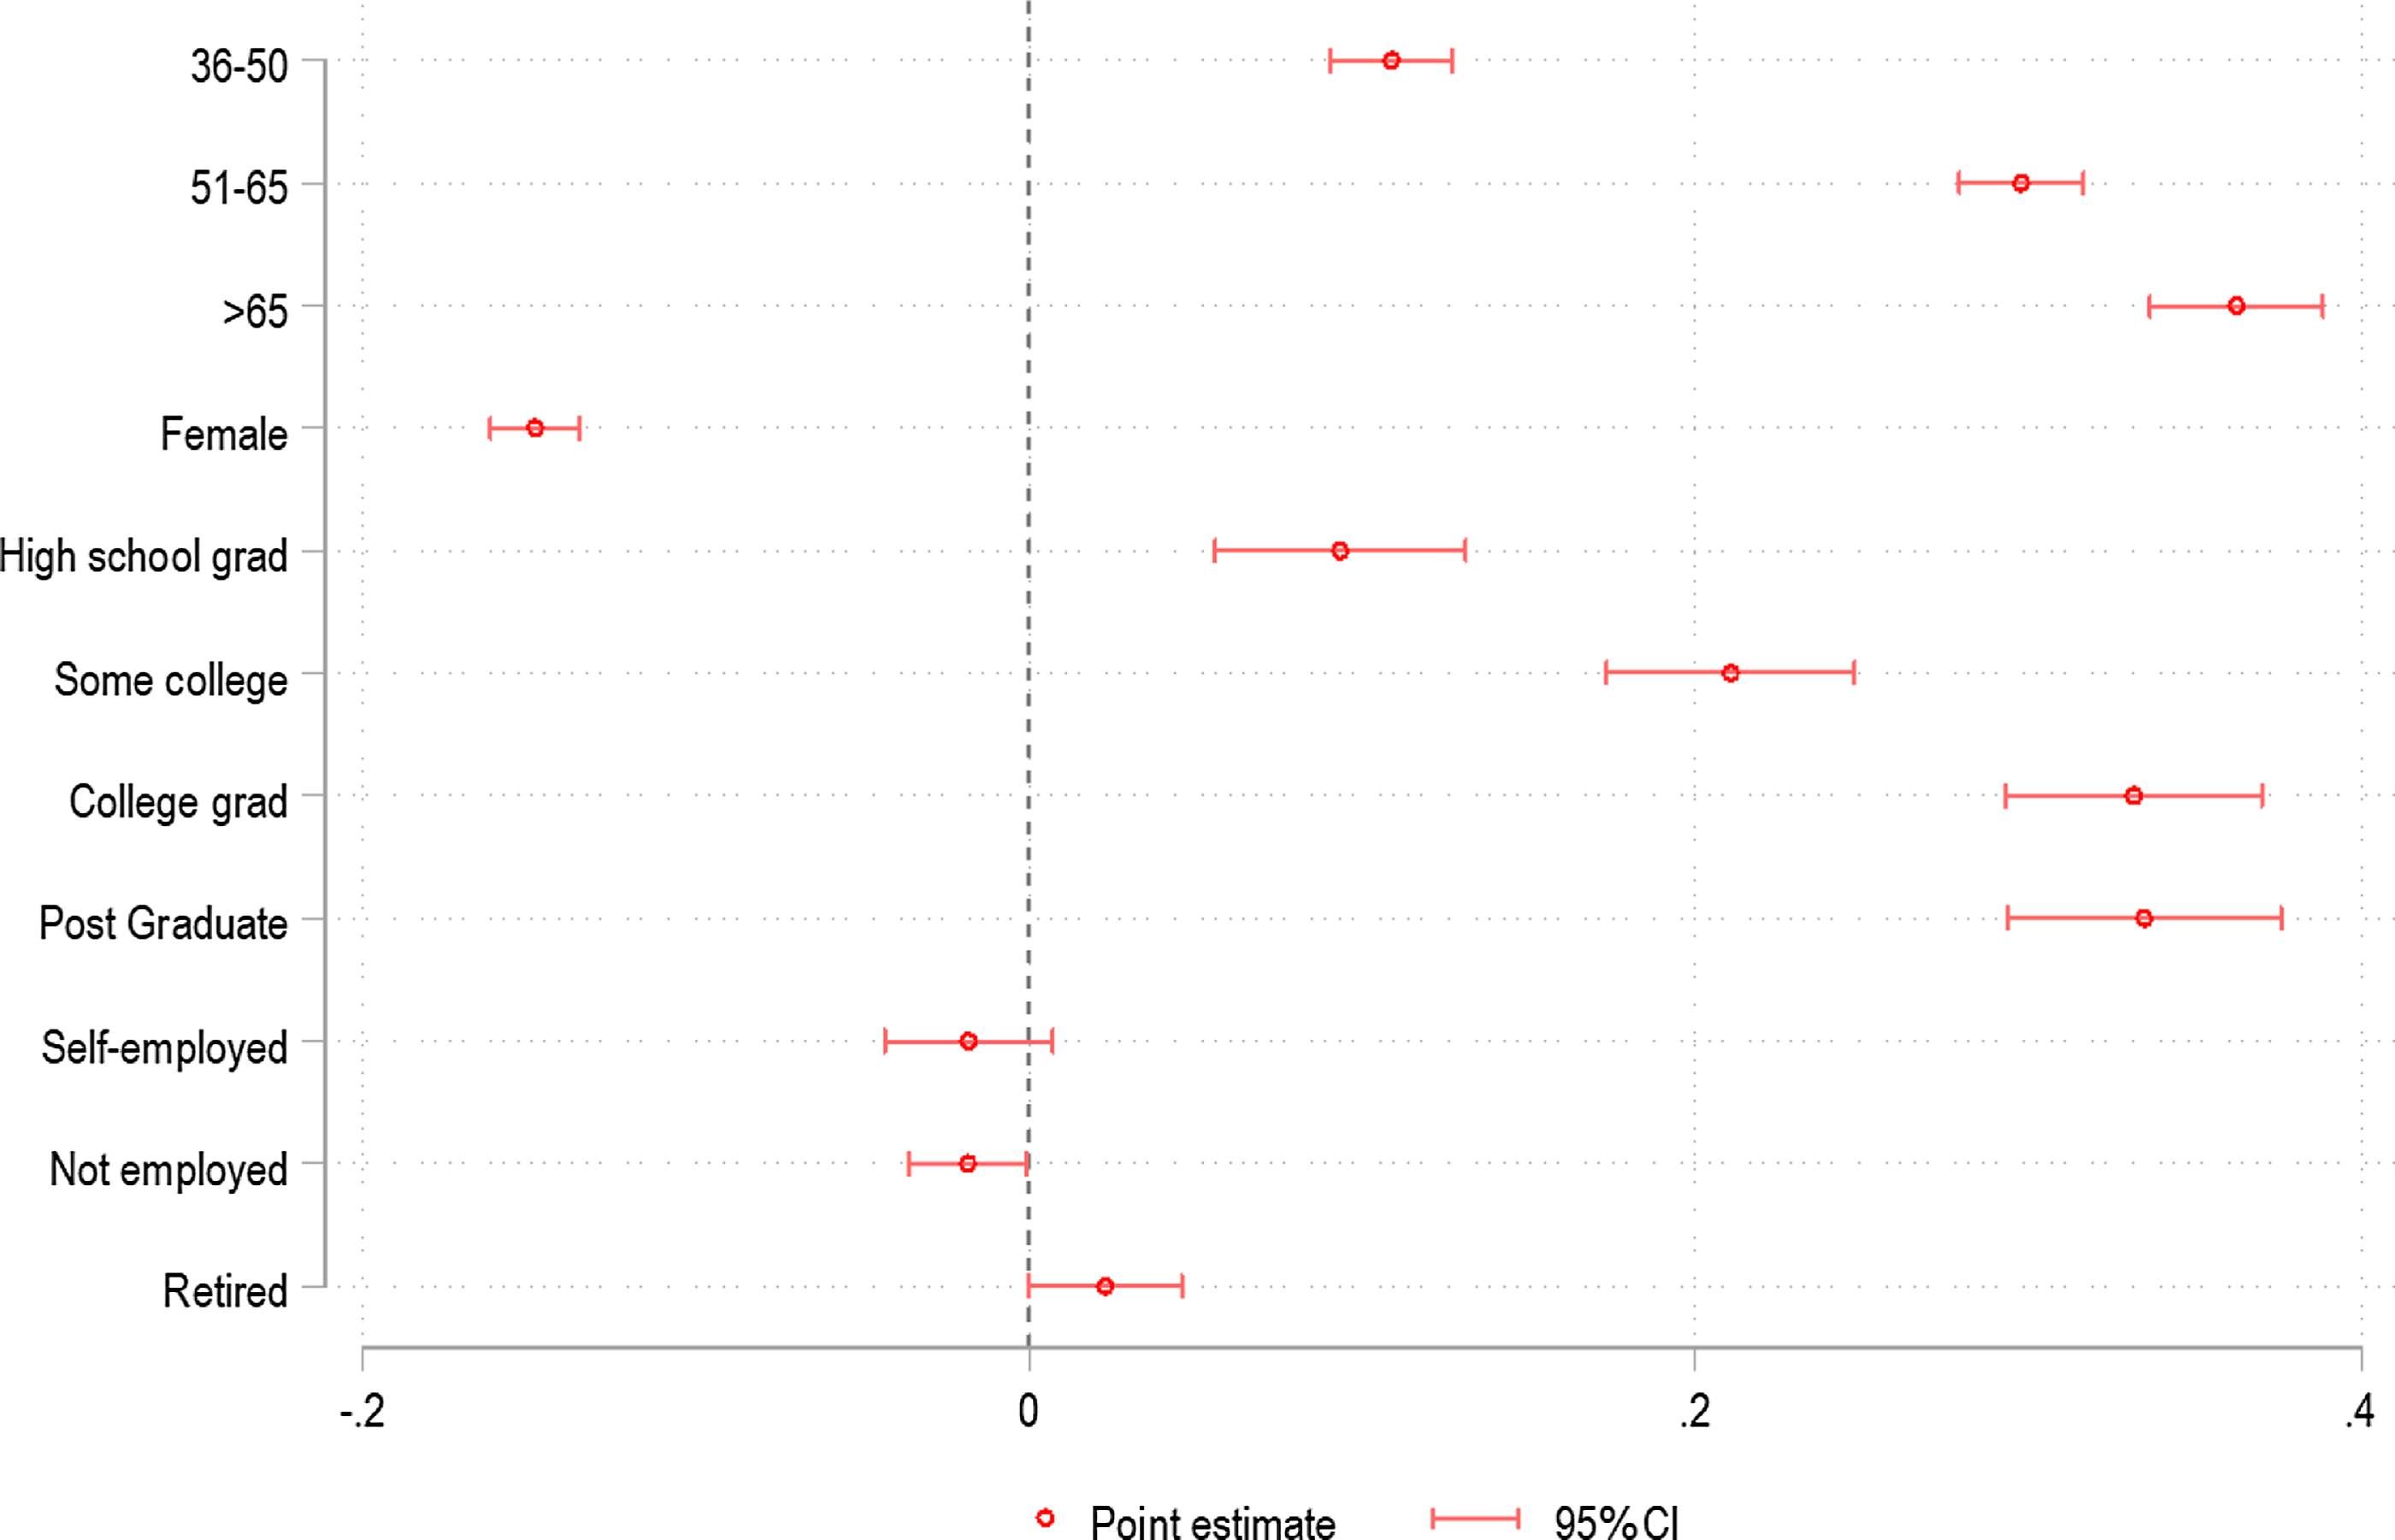
Figure 2. Regression estimation for correct answers to inflation question. Full sample.
Note: For specific coefficient estimates, see Table 2a.
Table 2a. OLS estimates of answering inflation correctly on demographic variables. Full sample

Note: *for p < .1,
**for p < .05, and
***for p < .01. Full sample (18+) regardless of whether retired or not. The dummy variable is created so that it takes the value 1 if answered correctly, and 0 if answered incorrectly, don’t know, or prefer not to say.
4.2.2 Race and ethnicity
We compare financial literacy across different racial/ethnic groups (Table 3a). Results show that Black respondents had the lowest level of financial literacy – fewer than 12% answered all three questions correctly, compared to 33% of Whites and 45% of Asians. Hispanic respondents performed poorly on the test as well with about 20% answering the Big Three correctly.
Table 3a. Distribution of responses to the Big Three by race/ethnicity, NFCS 2021. Full sample
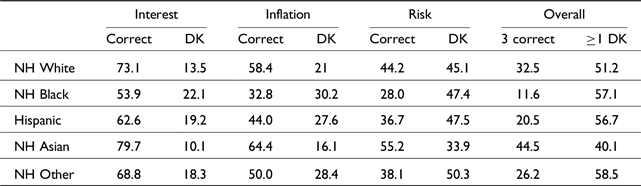
Notes: All figures are weighted. DK indicates respondents do not know. NH: non-Hispanic.
Examining the Big Three financial literacy questions separately, the results show that Black respondents lagged behind other racial/ethnic groups, but the knowledge gap was especially pronounced in inflation and risk diversification. Less than one-third of Black Americans answered the inflation question correctly. Moreover, they had the most difficulty answering the risk diversification question – only 28% responded correctly to this question. This result is consistent with studies that found financial literacy gaps across racial and ethnic differences (Lusardi & Mitchell, Reference Lusardi and Mitchell2011b, Reference Lusardi and Mitchell2014), and only 34 percent of Black American households invest in the stock market, compared with 61 percent of White families (Federal Reserve Board, 2023).
4.2.3. Self-reported vs. actual financial literacy
How do people perceive their financial literacy? And, how does that perception compare to their actual financial knowledge? To examine these questions, survey respondents were asked to rate their self-assessed financial literacy, from 1 (very low) to 7 (very high). As shown in Table 3b, despite the low actual level of financial literacy, most respondents gave themselves relatively high ratings. For example, although only 28.5% of all respondents were able to answer the Big Three correctly, when asked to rate their financial knowledge, the same group of people gave themselves an average rating of 5.1 out of 7.
Table 3b. Distribution of self-reported financial literacy by age, sex, education, employment status, and race/ethnicity in the National Financial Capability Study (%). Full sample
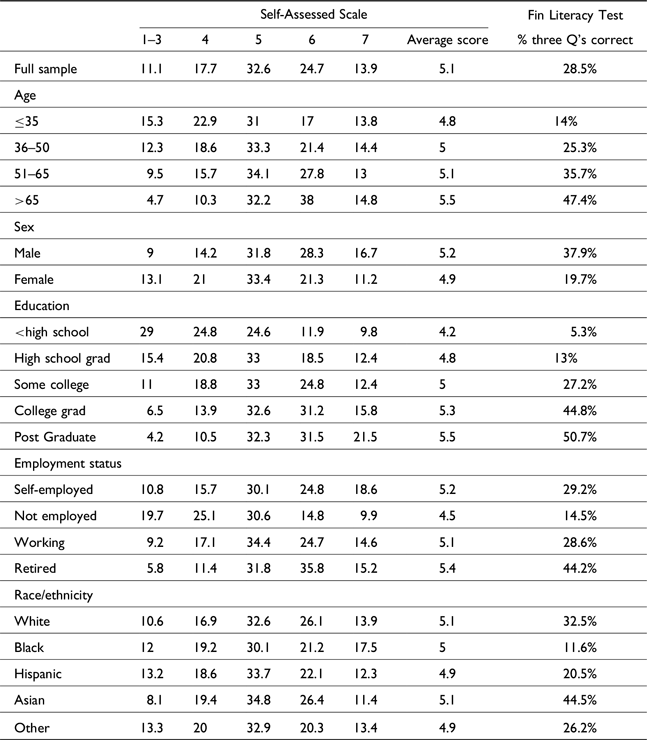
Notes: All figures are weighted. 1-“very low” 7-“very high”
Despite wide gaps in actual financial knowledge in terms of age, gender, and education, the gaps in perceived financial knowledge were smaller. The same can be found across race and ethnicity groups. Black and Hispanic respondents had lower actual financial literacy levels than Whites and Asians; yet, their self-rating of financial literacy was very similar to that of Whites and Asians. The average self-rating was 5.1, 5, 4.9, and 5.1 among Whites, Blacks, Hispanics, and Asians. While more people with low financial literacy choose ratings between 1 and 3, the percentage of those doing so is fairly small. These findings raise concerns that the gap between perception and reality can cause overconfidence when it comes to critical financial decision-making. Again, similar findings are reported in other papers (Lusardi & Mitchell, Reference Lusardi and Mitchell2011b, Lusardi & Tufano, Reference Lusardi and Tufano2015).
4.3. Does financial literacy matter?
In this section, we examine the link between financial literacy and financial well-being. We focus on three measures for financial well-being: retirement planning, financial fragility, and debt burden. The survey asked people whether they have ever tried to figure out how much they need to save for retirement (“retirement planning”), how confident they were that they could come up with $2,000 if an unexpected need arose within the next month (“financial fragility”); and how strongly they agreed that they had too much debt (“debt burden”). The definition of the financial outcome variables and coding are shown in Table A2 in the appendix.
Retirement planning is a good proxy for wealth accumulation (Lusardi & Mitchell, 2014a). An inability to come up with $2000 in a month has proven to be a good measure of financial fragility (Lusardi et al., Reference Lusardi, Schneider and Tufano2011). The question about debt indicates the health of the household’s balance sheet, and how much debt is a burden (Lusardi & Tufano, Reference Lusardi and Tufano2015). These variables are used as indicators of financial well-being.
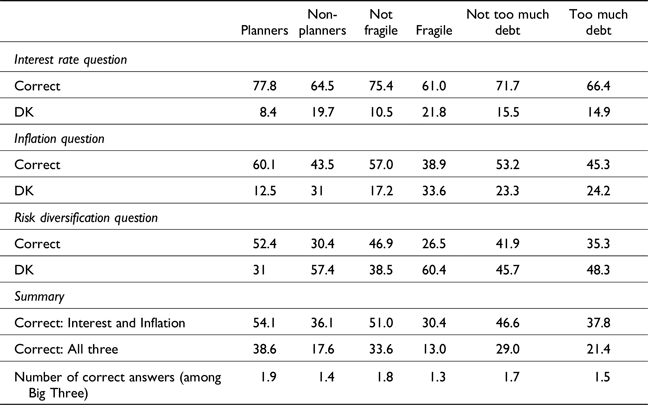
Table 4 shows a simple tabulation of financial outcomes between people who correctly answered and those who did not know the answer to the Big Three questions. We find that retirement planning and financial literacy are positively correlated. Interestingly, the “do not know responses” are highly indicative of failing to plan for retirement. For instance, if someone answered “I don’t know” on the inflation question, then the person was over twice as likely to be a non-planner than a planner (30.4% vs. 12.2%).
Table 4. Financial literacy and financial well-being in the National Financial Capability Study (%). Full sample
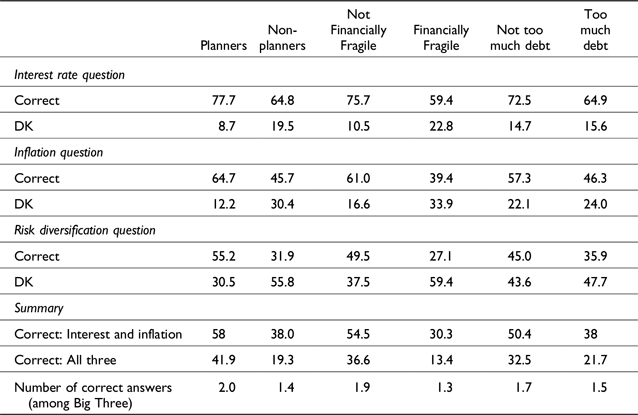
Financial literacy is also correlated with financial fragility. Responses to the three financial literacy questions are strong predictors of the ability to come up with $2,000 in a month. Among people who answered the Big Three correctly, 37% could come up with $2,000 while only 13.4% could not.
The correlation between financial literacy and debt burden was weaker. Even among those who answered correctly, a substantial proportion of them had too much debt. This may be attributed to the constraints induced by student loans or mortgages, regardless of households’ financial literacy levels.
Findings are similar when we consider the sample of working-age non-retirees (see Table A3 in the Appendix).
4.3.1. A multivariate model of financial literacy and well-being
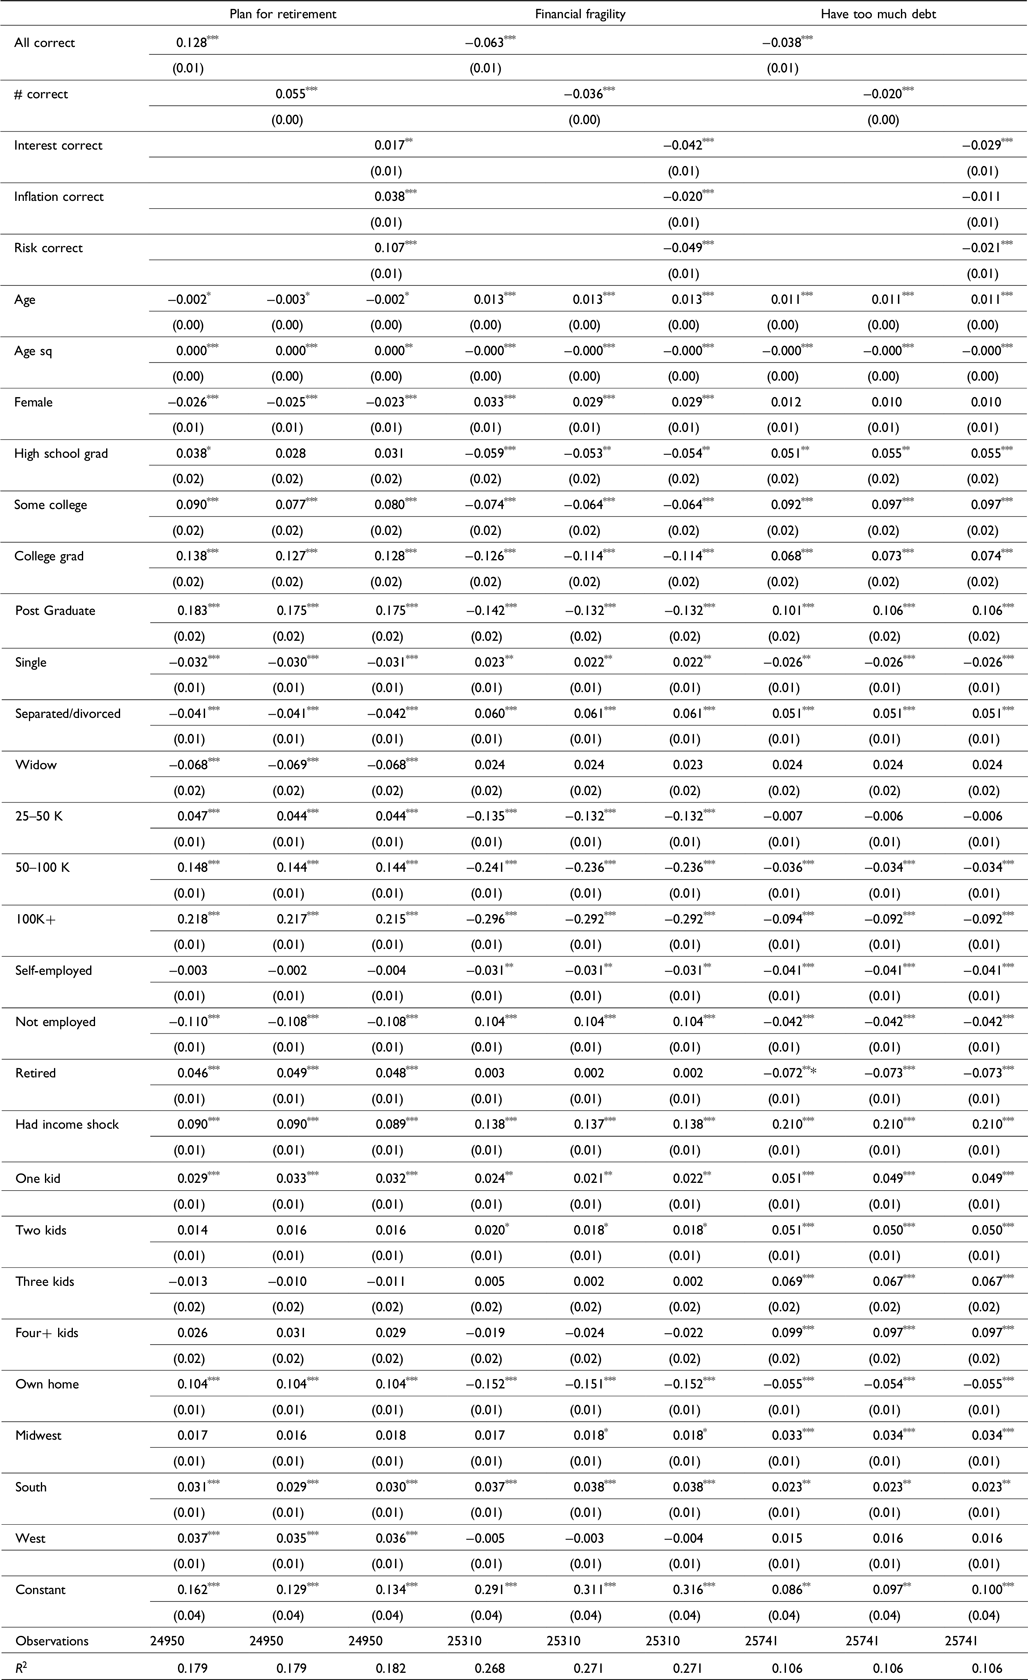
We now examine the relationship between financial literacy and the above measures of financial well-being using OLS regressions (Table 5). We use three different model specifications for financial literacy: in the first specification, the main independent variable is an indicator for answering all the Big Three correctly. In the second specification, the main independent variable is the total number of correct answers among the Big Three questions. In the third specification, the main independent variables are indicators for correctly answering each of the financial literacy questions. Results show that, in all specifications, financial literacy is linked to planning for retirement, the ability to come up with $2,000 within a month, and having a manageable level of debt.
Table 5. Financial literacy and financial well-being in the National Financial Capability Study, 2021. OLS estimates. Full sample.
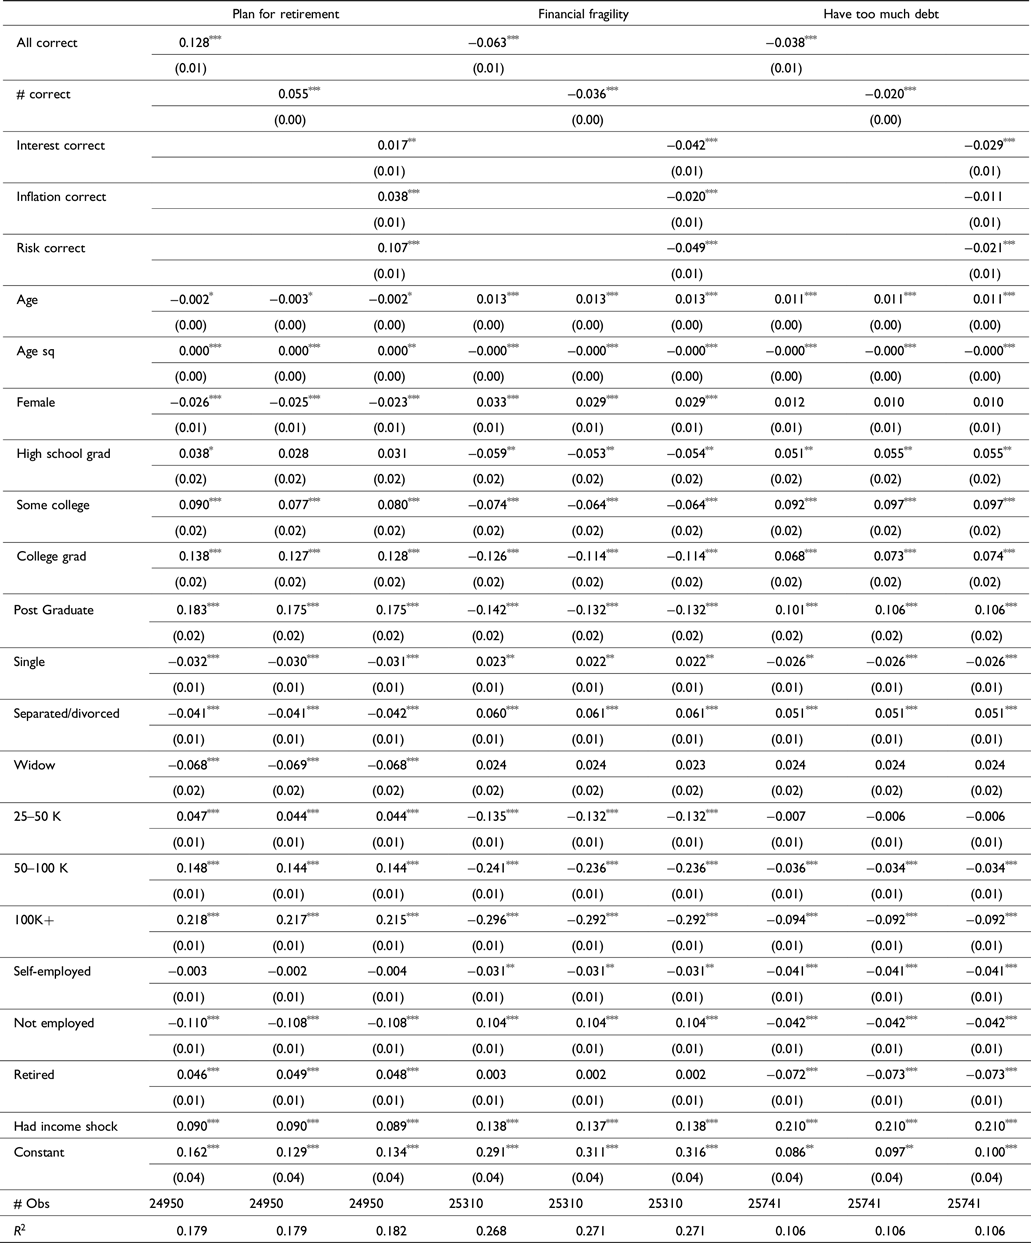
Note: Robust standard errors in parentheses; *for p < .1,
**for p < .05, and
***for p < .01. Full sample. Weights are used. Regression also controls for children, homeownership, and geographic regions. For full results see Appendix.
Respondents who answered all Big Three correctly had a 12.8 percentage point higher likelihood of planning for retirement. Note that most of the gain is attributed to understanding risk. When comparing the three dimensions of financial knowledge – interest compounding, inflation, and risk diversification – understanding of risk diversification is more relevant (0.107***) than inflation (0.038**) or interest compounding (0.017***).
The demographic variables that correlate most with retirement planning are having a college degree and higher income. Similar to other studies (Lusardi & Mitchell Reference Lusardi and Mitchell2011b, Reference Lusardi and Mitchell2014), people who suffered income shocks were more likely to plan for retirement.
Financial literacy is also positively related to financial resilience and good debt management. Our results show that people who answered the Big Three correctly had a 6.3 percentage points lower likelihood of being financially fragile, and a 3.8 percentage points lower likelihood of having too much debt. Comparing the three financial wellbeing outcomes, we can see that financial literacy was most strongly associated with retirement planning, and least associated with debt. These findings are similar to those of Angrisani et al. (Reference Angrisani, Burke, Lusardi and Mottola2023). Meta-analyses of financial education programs also show weaker effects on debt (Kaiser et al., Reference Kaiser, Lusardi, Menkhoff and Urban2022).
Lastly, the demographic variables that correlate most with financial fragility are having had an income shock (0.137***) and owning a home (−0.152***). The demographic variable that correlated most with having too much debt was having had an income shock (0.210***). See Tables A4 and A5 for the full set of estimates and estimates on the sample of working-age non-retirees, respectively.
4.3.2. Robustness checks
One may argue that financial literacy could be an endogenous variable. For instance, people may invest in financial education to better prepare for retirement, to be better able to face shocks, or to better manage their debt. Moreover, measurement errors in financial literacy could also lead to estimation bias.
To address these issues, we make use of another variable that is potentially more exogenous than financial literacy. The survey provides information on exposure to financial education. The following question was asked: “Was financial education offered by a school or college you attended or a workplace where you were employed?”
-
(a) Yes, but I did not participate in the financial education
-
(b) Yes, and I did participate in the financial education
-
(c) No
-
(d) Don’t know
-
(e) Prefer not to say
In our sample, 10.44% of the respondents said they were offered financial education but they did not participate, 21.92% said they participated, and 67.64% said they were not offered financial education.
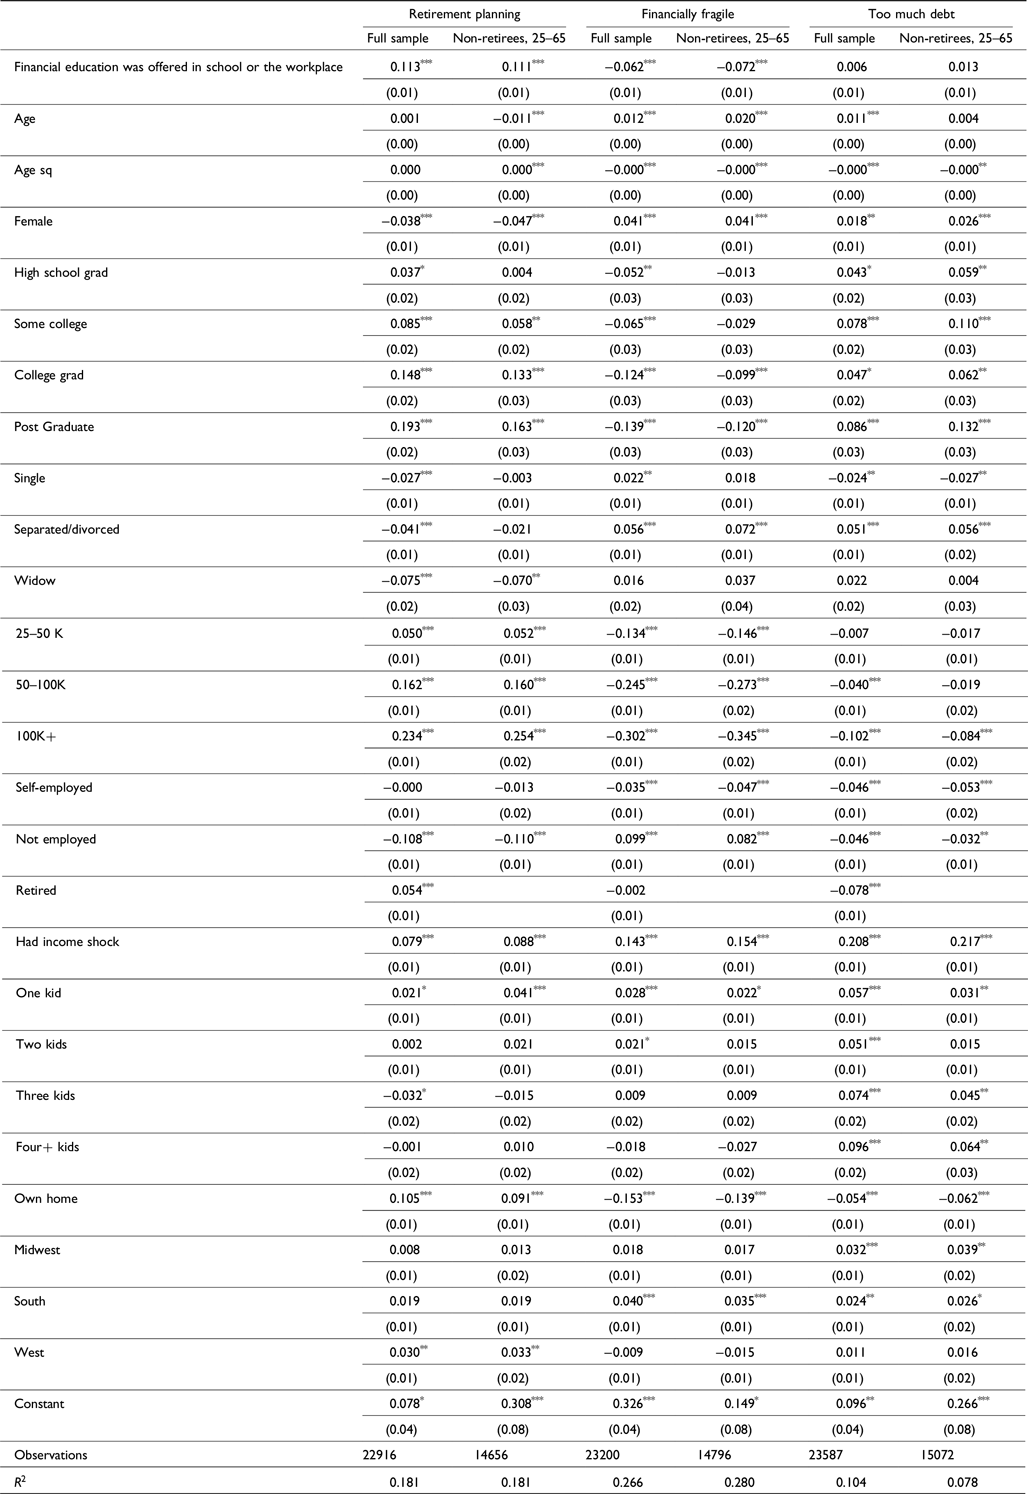
Table 6 replaces the financial literacy variables with exposure to financial education. Here we only focus on whether financial education was offered, regardless of whether the respondent participated. We find that both retirement planning and financial fragility are affected by such exposure, but that is not the case for debt. Exposure to financial education is associated with an 11.3 percentage point increase in the likelihood of people planning for retirement and a 6.2 percentage point decrease in the likelihood of being financially fragile. These results are consistent with previous findings using financial literacy (Angrisani et al., Reference Angrisani, Burke, Lusardi and Mottola2023) and the fact that many financial education programs, in particular those in the workplace, focus more on retirement savings and do not often cover topics such as debt and debt management. See Table A6 for the full set of estimates.
Table 6. Exposure to financial education and financial well-being, OLS estimates
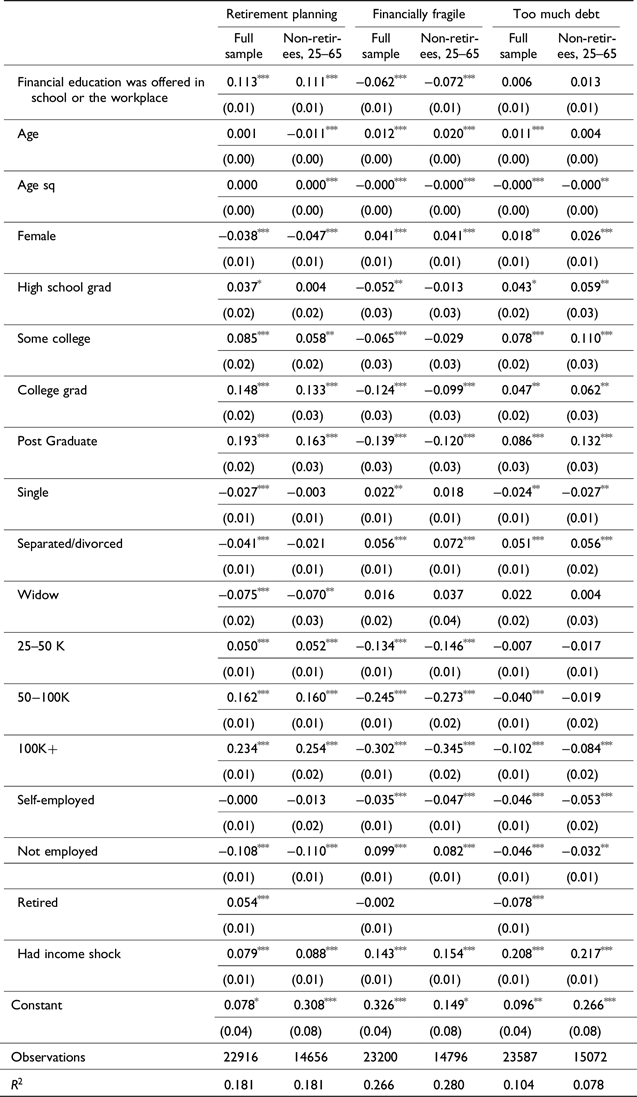
Note: Robust standard errors in parentheses; *for p < .1,
**for p < .05, and
***for p < .01. Weights are used. Regression also controls for children, homeownership, and geographic regions. For full results see Appendix.
5. Concluding remarks
Over the last several decades, financial institutions in the US have changed substantially. The transition from DB to DC plans has shifted the responsibility of planning and saving for retirement from employers to employees. Moreover, the decades-long low-interest rate environment stimulated both borrowing and consumption and discouraged savings.
More recently, however, economic conditions have changed quickly due to both unexpected events and policy changes. The COVID-19 pandemic was not only a health shock, but also an economic shock that threatened many people’s job security. The pandemic was followed by a hike in inflation to levels unseen since the 1980s, followed by a subsequent increase in interest rates by the Federal Reserve to curb inflation. These disruptions to job security, income stability, inflation, and interest rates all brought new challenges to people’s financial well-being.
This paper uses data from the 2021 NFCS to examine financial literacy among Americans. We focus on three dimensions of financial knowledge: interest rates, inflation, and risk diversification. Our results show that financial literacy continues to be low in the US. In particular, people who are younger, female, less educated, and not employed have the lowest level of financial knowledge. Many respondents in the survey were ill-informed about their true level of financial knowledge and mistakenly overconfident about their ability.
Since inflation was a particular challenge for many American families in 2021–2023, we focus particularly on people’s understanding of inflation. Results show that those over 65 knew more about inflation than younger age groups. This could be attributed to the fact that they lived through the inflationary periods in the 1970s and 1980s.
The responses to the Big Three financial literacy questions help predict people’s financial behaviors and well-being. Those who answered those questions correctly were much more likely to have planned for retirement, remained financially resilient, and managed their debt better. In addition, exposure to financial education in school or at the workplace was linked to an increased level of financial well-being.
In recent years, academics and policymakers have advocated for improving financial literacy. Financial education in school is one key for many young people to gain a foundation in financial literacy. Meanwhile, we should not underestimate the value of alternative and continued forms of financial education, including in the workplace. This education should be more holistic and cover topics well beyond retirement savings.
Our results also show that Black Americans had the lowest financial literacy levels of all subgroups examined, implying a need for programs better targeted to the needs of specific groups. In addition, women were consistently found to have lower financial literacy, even after controlling for age, education, and socioeconomic status. Studies have found that women are more likely to encounter challenges in managing finances after a divorce or losing a spouse (Holden & Smock, Reference Holden and Smock1991; Streeter, Reference Streeter2020; Zick & Holden, Reference Zick and Holden2000). Effective financial literacy programs are needed to help women take control of their financial lives and close the gender gap in financial knowledge.
Appendix A.
Table A1. Summary Statistics, NFCS 2021
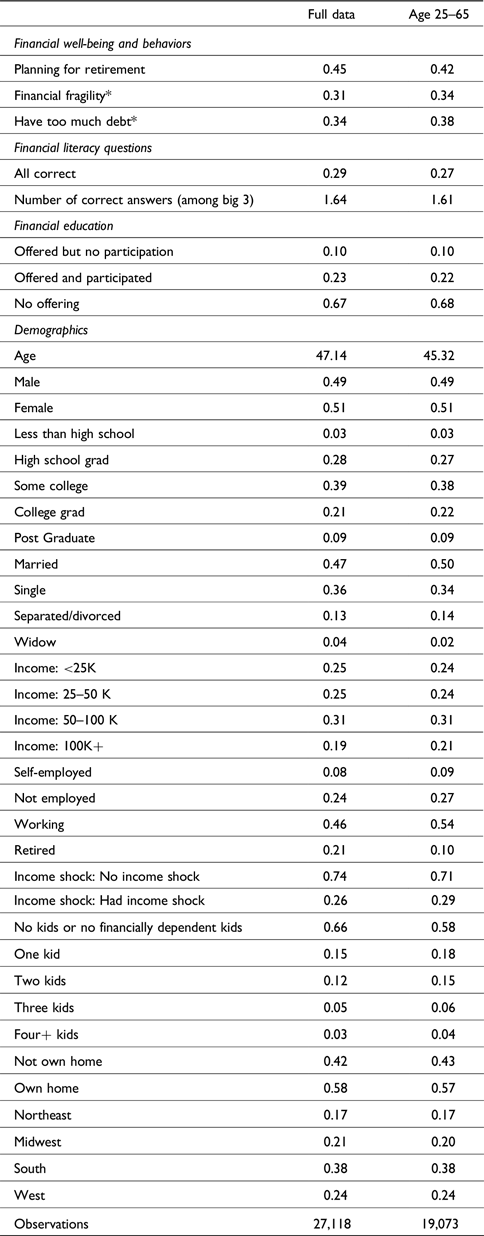
Notes: (1) Figures are weighted.
(2) We define someone as financially fragile if they responded to the question “How confident are you that you could come up with $2,000 if an unexpected need arose within the next month” with either “I could probably not come up with $2,000" or “I am certain I could not come up with $2,000.”
(3) People were asked “How strongly do you agree or disagree with the following statement? – I have too much debt right now.” The response options include 1 (strongly disagree); 2; 3; 4 (neither agree nor disagree); 5; 6; and 7 (strongly agree). We define someone as having too much debt if they chose 5, 6, or 7.
Table A2. Survey questions on financial outcomes
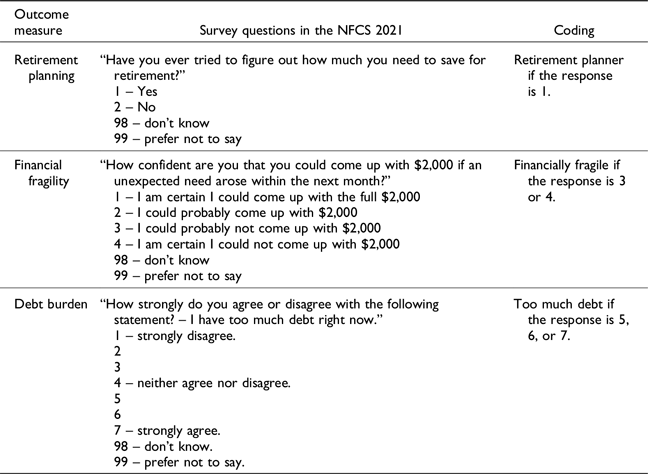
Note: For all three measures, 98 and 99 are treated as missing.
Table A3. Financial literacy and financial well-being. National Financial Capability Study (%). Non-retirees age 25–65.
Note: Sample consists of 17,287 non-retired respondents age 25–65. DK indicates respondent doesn’t know.
Table A4. Financial literacy and financial well-being. National Financial Capability Study, 2021. OLS estimates. Full sample.
Note: Robust standard errors in parentheses; *for p < .1,
**for p < .05, and
***for p < .01. Full sample. Weights are used.
Table A5. Financial literacy and financial well-being. National Financial Capability Study, 2021. OLS estimates. Non-retirees age 25–65.
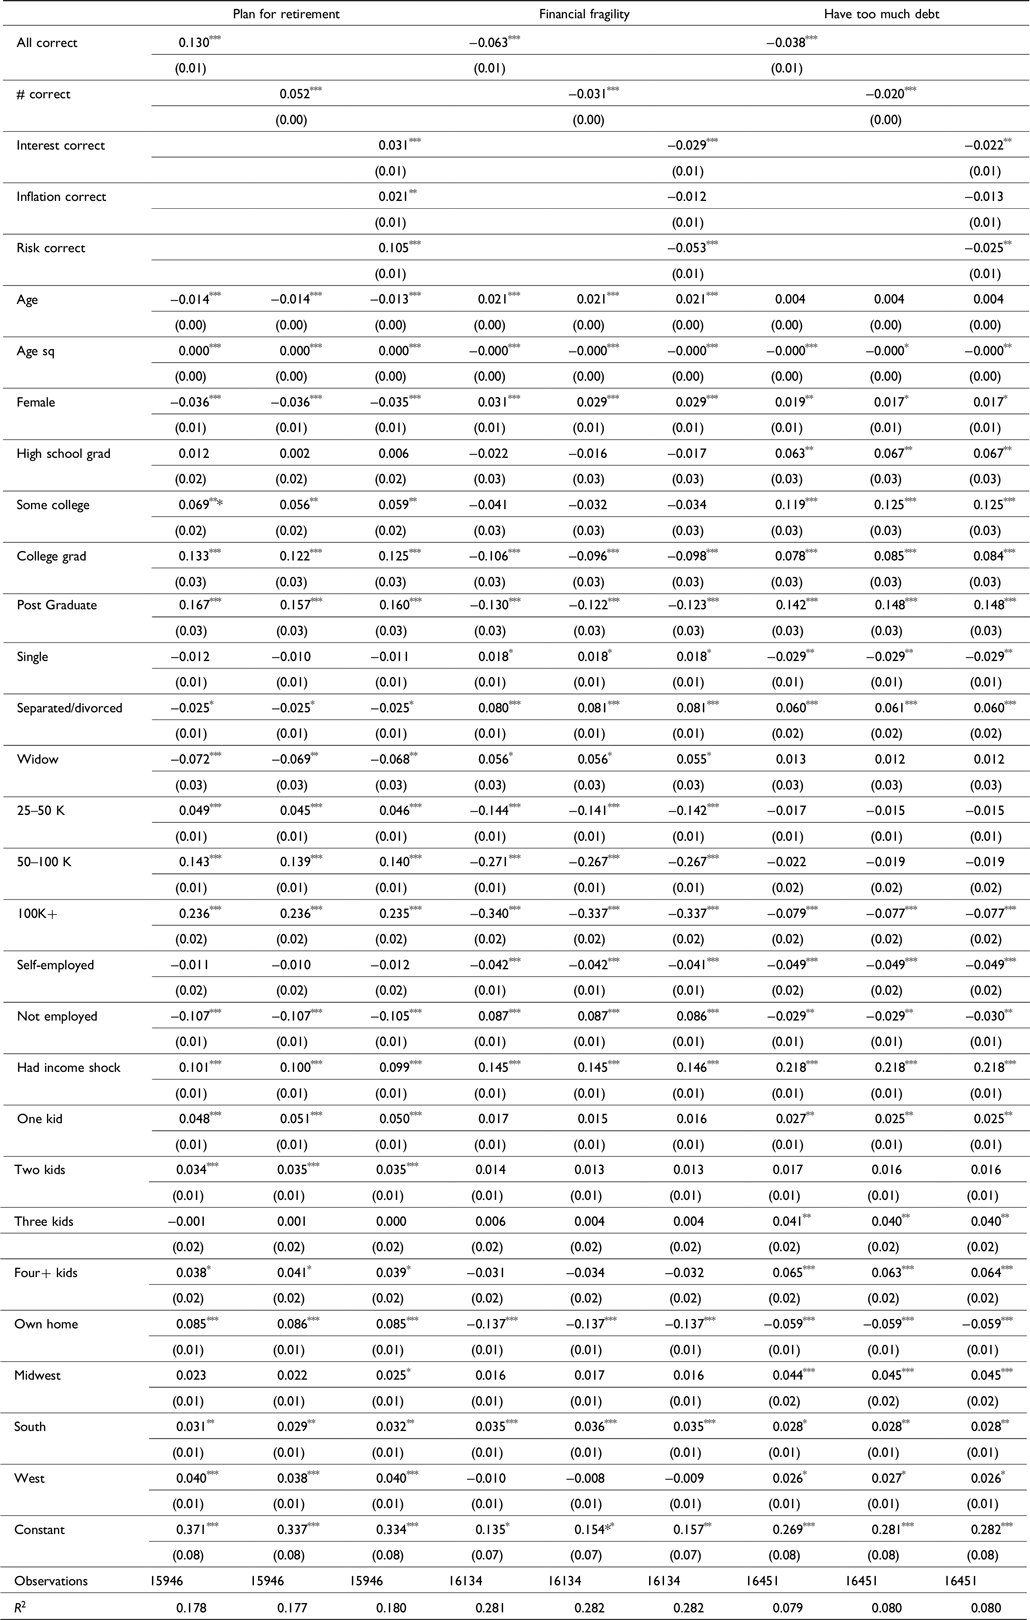
Note: Robust standard errors in parentheses; *for p < .1,
**for p < .05, and
***for p < .01. Data are for non-retirees age 25–65. Weights are used.
Table A6. Exposure to financial education and financial well-being. OLS estimates.
Note: Robust standard errors in parentheses; *for p < .1,
**for p < .05, and
***for p < .01. Weights are used.


 Open access