


1. Introduction
The existence of particles in two-phase flows not only increases the complexity of the dynamics of the fluid but also makes the particles exposed to complex transport processes, such as the settling of the particles, the secondary entrainment, and suspension in low-speed and high-speed regions induced by the fluids. Complex interactions exist between particles and fluids, and between particles. Based on the particle volume fraction  $\varPhi _v$ (particle volume proportion per unit volume), the two-phase flow with $\varPhi _v<10^{-3}$ is termed empirically dilute flow, and the flow with $\varPhi _v>10^{-3}$ is termed dense flow. For the former, $\varPhi _v<10^{-6}$ can be simplified further to a unidirectional sparse flow that considers only the influence of turbulence on particles, while particle and turbulence interactions are taken into consideration (two-way coupled) when $10^{-6}<\varPhi _v<10^{-3}$ (Elghobashi Reference Elghobashi1991, Reference Elghobashi1994). Two key issues in two-phase flows are the behaviour of particle motions and flow characteristics of the fluid. On the one hand, studies of the effects of turbulence on particles contribute to a better understanding of the motion behaviour of particles and their transport laws (Tsuji, Morikawa & Shiomi Reference Tsuji, Morikawa and Shiomi1984; Kaftori, Hetsroni & Banerjee Reference Kaftori, Hetsroni and Banerjee1995; Fong, Amili & Coletti Reference Fong, Amili and Coletti2019; Zhu et al. Reference Zhu, Pan, Wang, Liang and Ji2019). On the other hand, many studies focus on the turbulence characteristics in the flow field to help in understanding the particle-to-fluid feedback mechanism, and thus promote the development of a unified model of turbulence dynamics and particle kinematics (Kiger & Pan Reference Kiger and Pan2002; Kussin & Sommerfeld Reference Kussin and Sommerfeld2002; Bellani et al. Reference Bellani, Byron, Collignon, Meyer and Variano2012; Li et al. Reference Li, Wang, Liu, Chen and Zheng2012; Zade, Lundell & Brandt Reference Zade, Lundell and Brandt2019). The wind-blown sand flow/sandstorm is a typical high-Reynolds-number particle-laden wall-bounded turbulence with an erodible surface that exists in nature. The particles move violently on the erodible surface. The particles may rebound and splash other particles after impacting the wall (Zheng, Feng & Wang Reference Zheng, Feng and Wang2021a). Therefore, the turbulence characteristics in two-phase flows are influenced by both particle and particle near-wall motions.
The existing studies on two-phase wall turbulence are focused on the particle effects on turbulence statistics. First, the particle has a significant effect on the average velocity profile. In the early stage, Tsuji & Morikawa (Reference Tsuji and Morikawa1982) conducted two-phase flow experiments with incoming velocity  $6\unicode{x2013}20\ {\rm {m}}\ {\rm {s}}^{-1}$ using laser doppler velocimetry (LDV) on horizontal and vertical pipes, and found that particles of sizes 0.2 mm and 3.4 mm enhanced the near-wall flow velocity but reduced the velocity in the outer region. Most subsequent studies on channel flow suggested that particles may increase the fluid velocity in the viscous region and the wake region, and decrease the velocity in the logarithmic region (Kaftori et al. Reference Kaftori, Hetsroni and Banerjee1995; Muste & Patel Reference Muste and Patel1997; Tanière, Oesterle & Monnier Reference Tanière, Oesterle and Monnier1997; Kiger & Pan Reference Kiger and Pan2002; Wu et al. Reference Wu, Wang, Liu, Li, Zhang and Zheng2006). For example, Li et al. (Reference Li, Wang, Liu, Chen and Zheng2012) studied a particle-laden flow with the particle image velocimetry (PIV) technique in a horizontal channel at friction Reynolds number $Re_\tau =470$ (where $Re_\tau =\delta u_\tau /\nu$, with $\delta$, $u_\tau$ and $\nu$ representing the boundary layer thickness, friction wind velocity and fluid kinematic viscosity, respectively), particle mass loading $\varPhi _m=0.025,0.1,0.5$, and particle diameter $d_p=60\ \mathrm {\mu }{\mathrm {m}}$. Particles were found to increase the fluid velocity in the near-wall region ( $y^+<10$) and reduce the velocity further from the wall ( $10< y^+<250$). Ji et al. (Reference Ji, Munjiza, Avital, Xu and Williams2014) applied a full-resolution numerical simulation to calculate particle-laden flow with $Re_\tau =647$ and $\varPhi _m=0.139$. They concluded that the flow velocity increased in the inner region, while it decreased in the outer region. The results in Fong et al. (Reference Fong, Amili and Coletti2019) also showed an increased velocity near the wall and decreased velocity far away from the wall through PIV visualization experiments in a horizontal channel two-phase flow with $Re_\tau =235\,335$, $d_p=50\ \mathrm {\mu }{\mathrm {m}}$ and $\varPhi _v=3\times 10^{-6}$, $5\times 10^{-5}$. Recently, Costa, Brandt & Picano (Reference Costa, Brandt and Picano2020, Reference Costa, Brandt and Picano2021) used interface-resolved direct numerical simulation (DNS) to study near-wall turbulence modulation by small inertial particles under three bulk solid mass fractions ( $\varPhi _m = 0.34\,\%$, 3.37 % and 33.7 %) at $Re_\tau = 180$, and found that the velocity is attenuated in the outer region at higher mass fractions. In addition, two-phase flow numerical simulations with different particle volume fractions, particle densities and wall roughnesses, by Wu et al. (Reference Wu, Wang, Liu, Li, Zhang and Zheng2006), Molin, Marchioli & Soldati (Reference Molin, Marchioli and Soldati2012), Liu, Luo & Fan (Reference Liu, Luo and Fan2016) and Costa et al. (Reference Costa, Picano, Brandt and Breugem2018), confirmed that particles enhance the near-wall velocity and reduce the outer-region velocity. Specifically, Li et al. (Reference Li, Wang, Liu, Chen and Zheng2012) suggested that the particle effects on the mean velocity profile may also be related to the particle collision with the wall.
The particle not only affects the mean velocity but also changes the turbulence intensity and Reynolds shear stress. Owen (Reference Owen1969) summarized the two-phase flow experiments in pipes and proposed the relaxation time of the particle. He suggested that if the relaxation time of the particle is less than the characteristic time of energetic turbulent eddies, then the particle would restrain the turbulence fluctuations. In solid–liquid two-phase flow experiments with  $\varPhi _v\sim O(10^{-4})$, Rashidi, Hetsroni & Banerjee (Reference Rashidi, Hetsroni and Banerjee1990) found that large particles ( $d_p=1100\ \mathrm {\mu }{\mathrm {m}}$) lead to an increase in the number of ‘ejection’ events near the wall, and thus increase the turbulence intensity and Reynolds shear stress, while small particles ( $d_p=120\ \mathrm {\mu }{\mathrm {m}}$) reduce the number of ejection events and weaken the turbulence. Subsequently, Kulick, Fessler & Eaton (Reference Kulick, Fessler and Eaton1994) confirmed that small particles weaken the turbulence under the condition of a smaller particle size ( $d_p=50\ \mathrm {\mu }{\mathrm {m}}$), and indicated that the turbulence attenuation is more significant with increasing Stokes number, $\varPhi _m$, and wall-normal distance. However, Righetti & Romano (Reference Righetti and Romano2004) found that the effect of particles on turbulence varies in different regions of the boundary layer by conducting a particle-laden flow experiment in a horizontal channel at $Re_h=14\,500$ (where $Re_{h}=U_{\infty }h/\nu$, with $U_{\infty }$ and $h$ the inlet velocity and half-channel height, respectively) and $d_p=100\unicode{x2013}200\ \mathrm {\mu }{\mathrm {m}}$. Near the wall ( $y^+<20$), the ‘sweep’ motion of the fluid makes the particles move towards the wall. Since the inertial particle maintains a high velocity, the velocity of the particle is greater than that of the fluid, which enhances the Reynolds stress. Away from the wall ( $y^+>20$), the ejection event of the fluid rolls up the particles, which maintain a low velocity due to inertia, leading to the inhibited Reynolds stress. The phenomenon that particles increase turbulence second-order statistics in the viscous region and decrease them in the outer regions was also observed by the horizontal channel PIV experiment in Li et al. (Reference Li, Wang, Liu, Chen and Zheng2012), the fully resolved numerical simulation of a horizontal channel in Shao, Wu & Yu (Reference Shao, Wu and Yu2012), the vertical channel PIV experiment in Fong et al. (Reference Fong, Amili and Coletti2019), and the vertical channel interface-resolved particle DNS in Yu et al. (Reference Yu, Xia, Guo and Lin2021). Recently, the high-Reynolds-number ( $Re_\tau =19\,000$) two-phase turbulent boundary layer (TBL) flow experiment performed in Berk & Coletti (Reference Berk and Coletti2020) indicated that the suspended microglass beads ( $St^+=18\unicode{x2013}770$ and $\varPhi _v\sim O(10^{-4})$, where $St^+$ is the viscous Stokes number defined by the viscous time scale) exhibit negligible effects on turbulence statistics. Brandt & Coletti (Reference Brandt and Coletti2022) summarized the results of interface-resolved particle DNS, and indicated that the suspended particles decreased the streamwise fluctuation intensity in the inner region, and increased it in the outer region. These studies indicate that the particle effect on turbulence fluctuations is affected by many factors, such as flow conditions and particle parameters.
To divide the particle effect differences on turbulence, various dimensionless parameters referring to the particle-laden flow were proposed. Gore & Crowe (Reference Gore and Crowe1989, Reference Gore and Crowe1991) proposed the scale ratio of particle to fluid,  $d_p/L_{e}$ (where $L_{e}$ is the characteristic length of the most energetic eddy), to scale the turbulence modulation by summarizing the available experimental data in pipes and jet flows. The particle is found to attenuate turbulent intensity at $d_p/L_e<0.1$ but enhance it at $d_p/L_e>0.25$. The multiscale nature of turbulence and the varying characteristic scale in different flow layers makes it very difficult to determine an appropriate scale for the turbulence structure (Best et al. Reference Best, Bennett, Bridge and Leeder1997; Righetti & Romano Reference Righetti and Romano2004). Hetsroni (Reference Hetsroni1989) used the particle Reynolds number $Re_p$ (defined by the relative velocity between the particle and the surrounding flow, the particle diameter and the kinematic viscosity) to distinguish the different effects of particles on turbulence. Large particles ( $Re_p>400$) tend to enhance turbulence, while small particles ( $Re_p<200$) suppress the turbulence intensity. Elghobashi (Reference Elghobashi1994) suggested that $\varPhi _v$ can also be used to determine the level to which the particles affect the fluid phase. The particle enhances turbulence for $\varPhi _v<2\times 10^{-5}$ but reduces it for $\varPhi _v>2\times 10^{-4}$. The particle Stokes number $St$, which is defined as the ratio of the particle relaxation time to the time scale of energetic eddies, was found by Righetti & Romano (Reference Righetti and Romano2004) to also be a useful parameter for identifying the degree of particle effects on turbulence; turbulence is augmented at $St>1$ and attenuated at $St<1$. All of these parameters consider the particle effects from a single point of view. However, the modulation of turbulence by particles is affected by multiple parameters. Therefore, a composite parameter was proposed in Tanaka & Eaton (Reference Tanaka and Eaton2008) by dimensional analysis of the particle force in the momentum equation – that is, the particle momentum number $Pa=St\,Re_{L_e}^2{(\eta /L_e)}^3$, where $Re_{L_e}$ is the Reynolds number calculated with the energetic-eddy length scale $L_e$, and $\eta$ is the Kolmogorov length. The turbulence intensity was found to be augmented for $Pa<10^{3}$ or $Pa>10^{5}$, and attenuated for $10^{3}< Pa<10^{5}$, by employing the existing experimental data in the pipe and channel flows. Details of these parameters are summarized in Saber, Lundström & Hellström (Reference Saber, Lundström and Hellström2015). Recently, Luo, Luo & Fan (Reference Luo, Luo and Fan2016) derived a novel dimensionless parameter $Cr=(\rho _p/\rho _f)(L_e/d_p)\,Re_{L_e}^{-11/16}\,Re_p$ (with $\rho _p$ and $\rho _f$ denoting the particle density and fluid density, respectively), using Buckingham $\varPi$ theory and dimensional analysis. The experimental data showed turbulence intensity augmentation at $Cr>7000$, and attenuation at $Cr<7000$. Various single and compound dimensionless parameters are proposed to scale the effects of particles on turbulence. However, none of the dimensionless parameters above consider particle near-wall motions.
In addition to the particle effects, the turbulence is affected by the interaction between particles and the wall. Phase Doppler anemometer (PDA) experiments in TBL flow with  $Re_\theta \approx 1800$ (where $Re_\theta =U_\infty \theta /\nu$, with $\theta$ denoting the momentum thickness) by Tanière et al. (Reference Tanière, Oesterle and Monnier1997) indicated that the particle reduces the near-wall turbulence intensity and Reynolds shear stress due to the collision between particles and the wall. Two-phase flow experiments in the channel by Righetti & Romano (Reference Righetti and Romano2004) found that the particles induce large fluctuations in the fluid phase as they hit and rebound from the wall. Wu et al. (Reference Wu, Wang, Liu, Li, Zhang and Zheng2006) suggested that particles enhance the turbulence intensity under high $\varPhi _v$ conditions owing to the collision between the particle and wall, by two-phase experiments in a horizontal channel at $Re_\tau =445.5$ and $\varPhi _v=6\times 10^{-7}\unicode{x2013}4.8\times 10^{-5}$. The TBL experiments on 1 m sand grain beds with $d_p=125\unicode{x2013}150\ \mathrm {\mu }{\mathrm {m}}$ performed by Zhang, Wang & Lee (Reference Zhang, Wang and Lee2008) found that enhancement of turbulence intensity by particles is more significant in the saltation layer where near-wall particle motions occur (as well as the two-phase flow experiment on erodible surface by Li & McKenna Neuman Reference Li and McKenna Neuman2012). Revil-Baudard et al. (Reference Revil-Baudard, Chauchat, Hurther and Eiff2016) suggested that the interaction between particle and wall is the dominant factor in decreasing the mean fluid velocity and increasing the Reynolds normal stress across the boundary layer in the mobile sediment bed two-phase flow. The two-phase flow experiment in the TBL provided in Zhu et al. (Reference Zhu, Pan, Wang, Liang and Ji2019) indicated that the particle reduces the streamwise and wall-normal turbulence fluctuations as a result of the particle and wall interaction. Recently, Zheng, Wang & Zhu (Reference Zheng, Wang and Zhu2021b) studied the particle–wall process in a wind tunnel TBL at $Re_\tau =2002$, and found that the mean velocity of the fluid weakened in the near-wall region due to the particle–wall process. Zheng et al. (Reference Zheng, Feng and Wang2021a) proposed the ‘splashing effect’ through a wall-resolved large-eddy simulation of particle-laden flows with an erodible surface at $Re_\tau =3730$ and 4200; that is, the saltating particles enhance the outer Reynolds normal stress over a wide range of wavelengths from moderate to very large scales. Baker & Coletti (Reference Baker and Coletti2021) investigated buoyant suspended particles ( $St^{+} = 15$) in a smooth-wall open channel flow at $Re_{\tau } = 570$, and found that the particle–wall interaction results in a decrease of the fluid turbulence intensity and shear stress in the inner region.
In summary, both particle and particle near-wall motions exhibit effects on turbulence in two-phase flow. However, previous studies usually confuse these two factors, making it difficult to distinguish the effects of particles and the effects of near-wall motions of particles. Moreover, the effects of collision bounce and impact splashing of particles on turbulence are not refined. Therefore, the present work aims to explore the effects of particle near-wall motions on turbulence statistics based on four cases of PIV measurements (with an extensive field of view,  $8\delta \times 1.4\delta$) in a wind tunnel with the same incoming velocity at $Re_\tau =3950$, which includes the particle-free flow, two-phase flow with particle releasing from the top of the tunnel, local laying of a sand bed in the front section of the tunnel, and laying sand bed as a whole.
This paper is organized as follows. Section 2 provides a detailed description of the experimental set-up and the pretreatment method. Section 3 analyses the particle near-wall motions in different cases of experiments, estimates the particle dimensionless parameters, and validates the basic statistics of the flow field. Section 4 investigates the effects of collision bounce and impact splashing on the turbulence statistics by comparing the results for different cases of particle-free and particle-laden flows. Additional conclusions are drawn in § 5.
2. Experimental set-up and methodology
2.1. Experimental set-up
Experiments were performed in an open-loop multifunctional environmental wind tunnel at Lanzhou University. Figure 1 shows a schematic of the wind tunnel. It consists of power, rectifying, working and diffusion sections with total length 55 m. The cross-section of the working section is rectangular, with length, width and height 20 m, 1.3 m and 1.45 m, respectively. Additional details of the wind tunnel can be found in Zhu et al. (Reference Zhu, Pan, Wang, Liang and Ji2019) and Zheng et al. (Reference Zheng, Wang and Zhu2021b). The bottom and side walls are Plexiglas to facilitate optical observation, and the bottom walls are considered hydraulically smooth. The wind tunnel fan can be used to adjust the free stream velocity  $U_\infty$ to range from 3 to $40\ \mathrm {m}\ \mathrm {s}^{{-1}}$. In this study, $U_\infty$ was set to $9.0\ \mathrm {m}\ \mathrm {s}^{-1}$ for both the particle-free case and three cases of particle-laden flows, to ensure the same incoming flow conditions. The free stream turbulence intensity $T_u$ (where $T_u= u/U_\infty$, with $u$ the fluctuating streamwise velocity) was less than 1 $\%$. The experimental measurement was set at 7.5–9 m of the working section.

Figure 1. Sketch of the wind tunnel.
For the particle-free experiment, which is denoted as Case 1, the camera placement and arrangement were the same as the particle-laden experiments, as shown in figure 2. For the experiment of the top-release particle (Case 2), the sand particles were released uniformly by a sand feeder at the top entrance of the working section, at distance 8 m from the laser. As shown in figure 2(a), the sand particles were transported in the streamwise direction while falling, forming a particle-laden flow. The local-laying sand bed experiment is denoted as Case 3. The sand bed with thickness 0.02 m, length 1.0 m and width 1.3 m was well distributed over the floor of the wind tunnel in the entrance of the working section, shown by the yellow region in figure 2(b). In this case, sand particles were started from the sand bed by wall shear, travelled along the flow direction, and collided on and rebounded from the smooth wall frequently to form a fully developed saltation wind-blown sand flow. Figure 2(c) shows the experimental set-up of the global-laying sand bed (Case 4), with sand beds measuring  $10\ \mathrm {m}\ (\mathrm {length})\times 1.0\ \mathrm {m}\ (\mathrm {width})\times 0.05\ \mathrm {m}\ (\mathrm {depth})$ spread uniformly on the wall. A ramp of length 1 m was installed at the start of the sand bed such that the air flow translated smoothly (Zhang et al. Reference Zhang, Wang and Lee2008). The equivalent sand grain roughness height ${k_s}^+$ of the erodible surface was approximately 40, which was estimated following Ligrani & Moffat (Reference Ligrani and Moffat1986). In this case, compared with Case 3, the sand particles not only collided with the wall during transport but also splashed other particles since the surface was erodible. In the particle-laden flows, the particle density is $2600\ \mathrm {kg}\ \mathrm {m}^{-3}$, and the density ratio of sand particles to fluid is $\rho _p/\rho _f=2148$. The diameters of sand particles collected from the Tengger Desert, measured by a commercial standard sieve analyser (MicrotracS3500), present a distribution that deviates slightly from a Gaussian distribution (as shown in figure 2d). The sand grain diameter varies from 30 to $550 \ \mathrm {\mu }\mathrm {m}$, with mean diameter $d_{pm}=203\ \mathrm {\mu }{\mathrm {m}}$. In figures 2(a–c), the $x$-,
$x$-,  $z$- and $y$-axes represent the streamwise, spanwise and wall-normal directions, respectively. The corresponding three components of velocity are denoted as $U$,
$U$,  $W$ and $V$ (velocity fluctuations are $u$,
$u$,  $w$ and $v$). Figure 2( $e$) shows the laser, CCD camera, and view field set-up.

Figure 2. Experimental set-up: schematic diagram of experimental settings for (a) uniform release of sand at the top of the wind tunnel, (b) local-laying sand bed, and (c) global-laying sand bed. (d) Particle diameter distribution of the sand grain. (e) Enlarged view of laser settings, CCD camera, and field of view (FOV).
The PIV/PTV (particle-tracking velocimetry) synchronous measurement method was adopted to obtain the gas-phase and particle-phase velocities, as shown in figure 2. The laser was shot vertically from the top of the wind tunnel and reflected upstream via an oblique reflector placed at 10 m in the working section. A dual-pulse laser device (Beamtech Vlite-500) was employed in the PIV measurement as the light source; the energy output is  $500\ {\rm mJ}\ {\rm pulse}^{-1}$, and the wavelength is 532 nm. Due to the use of a specially designed long-focal-length convex lens to shape the laser sheet and the effect of the mirror, the thickness of the laser sheet is approximately 1 mm in the entire field of view (FOV). Four 12-bit deep and $4920\ {\rm pixel} \times 3280\ {\rm pixel}$ high-resolution cameras (FlowSense EO 16MP CCDs and 50 mm Nikkor lens at f/4) were arranged side by side, with FOV $1.5\ {\rm m} \times 0.26\ {\rm m}$ and camera magnification $80\ \mathrm {\mu }{\mathrm {m}}\ {\rm pixel}^{-1}$. DEHS droplets with diameters $0.3\unicode{x2013}3 \ \mathrm {\mu }{\rm m}$ acted as tracer particles for the gas phase, which were produced by a pressurized seeding generator and were released into the wind tunnel before the power section for better homogeneity. The sampling frequency was 4 Hz, the straddle-frame time of two frames was $80\ \mathrm {\mu }{\rm s}$, and the total number of samples was 3200 pairs of images. This corresponds to an eddy turnover time $Tu_\tau /\delta \approx 1518$ (where $T$ is sampling duration) or a normalized sampling duration $TU_\infty /\delta \approx 38\,502$, which can guarantee the convergence of energetic large-scale structures. In Cases 1 and 2, the PIV sampling was continuous without interruption. For experiments in Cases 3 and 4, the entire sampling process was divided into 16 runs because the sand layer was carried by the incoming flow, and 200 pairs of images were sampled for each run. During each run (duration 50 s), the sand surface was lowered by 0.002 m, which is significantly smaller than the boundary layer thickness (approximately 1 %) and consistent with that in Li & McKenna Neuman (Reference Li and McKenna Neuman2012) (1–2 %) and Zheng et al. (Reference Zheng, Wang and Zhu2021b) (1 %). Before the next run, the lost sand particles on the bed surface were supplemented and flattened to ensure the consistency of the sand bed in each run without adjusting the incoming flow conditions. Therefore, the measurements in Cases 3 and 4 can be regarded as conducting in the temporally stationary situations. The images were processed by the adaptive-PIV in the software of DynamicStudio. An interrogation area of $32\ {\rm pixels} \times 32\ {\rm pixels}$ was selected for the correlation, with 75 % overlap in both the streamwise and wall-normal directions. The data of Case 1 were processed, and the flow parameters obtained under the working conditions are listed in table 1. Based on the environmental temperature and the barometric pressure in the wind tunnel, the $\nu$ of the gas phase was estimated as $1.68\times 10^{-5}\ \mathrm {m}^{2}\ \mathrm {s}^{{-1}}$. Here, $u_{\tau }$ and $\delta$ were calculated by fitting the mean velocity profile following the chart method of Clauser (Reference Clauser1956) with log-law constants $\kappa = 0.41$ and $B = 5.0$ based on the particle-free flow, and were approximated for particle-laden flows. The Reynolds number was $Re_\tau =3950$. The shape parameter $H$ was 1.27, which is close to the empirical parameter predicted by Chauhan, Monkewitz & Nagib (Reference Chauhan, Monkewitz and Nagib2009) and Marusic, Mathis & Hutchins (Reference Marusic, Mathis and Hutchins2010).
Table 1. Key information related to the particle-free flow.
2.2. Gas–particle phase separation
Before gas–particle separation, the wall boundary should be identified and removed as the background noise. To identify the wall boundary, the data were divided into segments. There is negligible change in the inner boundary within 50 s (Johnson & Cowen Reference Johnson and Cowen2020); thus the data were divided into several 50 s (200 image pairs) intervals for subsequent processing. The brightness at the wall boundary is always strong. Therefore, the wall boundary for each segment was extracted by looking for the minimum brightness value at each pixel among the 200 image pairs (Cowen & Monismith Reference Cowen and Monismith1997). This effectively removed tracer particles in the sheet, to retain only the wall boundary. Then the background noise image containing only the bed surface was subtracted from the original image.
Two-phase image processing consists of two steps: phase separation of the images, and sand grains matching. The sizes and brightnesses of the sand particles and tracer particles are significantly different, as shown in figure 3. Therefore, the traditional median filtering method was employed to separate the fluid and particle phases (Kiger & Pan Reference Kiger and Pan2002; Ahmadi et al. Reference Ahmadi, Ebrahimian, Sanders and Ghaemi2019; Zhu et al. Reference Zhu, Pan, Wang, Liang and Ji2019). Specifically, a median filter with a large kernel size was applied to the background-subtracted particle image (figure 3a) to remove the tracer particles and retain only sand particles (see figure 3b). Then, to obtain an image with only tracer particles (see figure 3c), the image component yielded by filtering the background-subtracted particle image with another small kernel size median filter was subtracted from the image in figure 3(a). The filtration window is important to determine the effectiveness of two-phase separation (Kiger & Pan Reference Kiger and Pan2000). Therefore, the small filter was selected with size  $2\times 2 \ {\rm pixel}^2$, and the large filter was $5\times 5$ pixel $^2$ according to the analysis in Zheng et al. (Reference Zheng, Wang and Zhu2021b). In addition, the sand particles beyond the laser sheet may still be illuminated due to the strong scattering of sand grains, but most of the grey levels of the sand particles were great than 400. Thus a nominal brightness threshold of 400 was chosen to remove these sand particles. The light spot was considered a grain of sand when the brightness was greater than the threshold value, and was considered a sand grain out of the measured plane when the brightness was lower than the threshold value.

Figure 3. Description of phase separation in two-phase images: (a) background-subtracted two-phase image; (b) image retained only sand particles; (c) image retained only tracer particles.
After phase separation, the velocity of the flow phase was calculated through the adaptive-PIV of DynamicStudio. The interrogation window used in this study is  $32\ {\rm pixel} \times 32\ {\rm pixel}$, which results in a spatial resolution of the interrogation window corresponding to 64 viscous units per vector (each vector is $15\eta$). Each vector is spaced by 16 viscous units. Although this spatial resolution does not capture the finest turbulent energetic structures ( $O(10\eta )$), the large-scale structures that dominate the outer region of wall turbulence can be acquired, thus approximately reliable turbulence statistics can be obtained, as verified in the next section. By calculating the standard deviation of velocities in an interrogation window and estimating the uncertainty at confidence level 95 %, the average (for all 3200 pair images) relative uncertainties of the time-averaged velocities are estimated to be less than $\pm$2.0 % in Case 2, $\pm$3.2 % in Case 3, and $\pm$7.3 % in Case 4 at $y^{+}>50$, and reduce rapidly with increasing $y^{+}$. The average relative experimental errors for all of the wall-normal locations at $y^{+}>50$ are 0.84 %, 0.73 % and 0.68 % in Cases 2, 3 and 4, respectively. These errors are in general agreement with that in the PIV two-phase channel flow experiments in Tay, Kuhn & Tachie (Reference Tay, Kuhn and Tachie2015) (3 %) and wind tunnel experiments in Zhu et al. (Reference Zhu, Pan, Wang, Liang and Ji2019) (1 %), and are considered in the subsequent comparative analyses to ensure the reliability of the results.
Sand particle image pairs were analysed by a hybrid PIV/PTV algorithm. The adaptive-PIV of DynamicStudio was applied first to estimate the particle velocity range and get a better correlation peak during the PTV cross-correlation analysis. Then the PTV algorithm (adjusted according to Sciacchitano, Wieneke & Scarano Reference Sciacchitano, Wieneke and Scarano2013) was used to calculate the particle velocity precisely based on the results of adaptive-PIV. This method can obtain a high-accuracy velocity measurement, and reduces the error in the identification of particle-centre in the PTV algorithm (Baek & Lee Reference Baek and Lee1996). The relative error of sand particle matching was reduced to 1 %. In addition, the uncertainties of the mean velocity and the fluctuating root-mean-square of sand particles were estimated to be 1 $\%$ when the number of particle images is $O(10^{5})$.
3. Particle near-wall motions and validation of flow field
3.1. Particle near-wall motions
A method of box-counting was employed to calculate the volume fraction of the sand particles due to the dispersion of particles. The field of view was divided into several subboxes with dimensions  $\Delta x\times \Delta y=8\times 1\ \mathrm {mm}^2$ and an overlap ratio of 50 % in flow direction. The formula for calculating the local particle volume fraction is written as
 \begin{equation} \varPhi_{v}(\Delta x, \Delta y, t)={\rm \pi} d_{p}^{3}\,N(\Delta x, \Delta y, t) /(6\,\Delta x\,\Delta y\,\Delta z), \end{equation}
where  $\Delta z$ is the thickness of the laser light sheet, $N(\Delta x, \Delta y, t)$ represents the number of matched sand grains within a subbox, and $t$ represents the instantaneous time. The resulting volume fraction of sand particles at different wall-normal distances is normalized with the integrated concentration over $y^+$ (where $y^+=u_\tau y/\nu$ is the inner-scaled wall-normal distance) and is shown in figure 4(a). The coordinates are logarithmic to show the magnitude of concentration at different boundary layer heights. Figure 4(a) shows that the variations of $\varPhi _v/\varPhi _{total}$ with $y^+$ collapse reasonably well with each other in the three cases of two-phase flows. This provides a reliable premise for the subsequent comparative analysis.

Figure 4. Particle distributions at different inner-scaled wall-normal distances: (a) particle volume fraction  $\varPhi _v$ normalized with the integrated concentration over $y^{+}$; (b) the ratio $n_{up}/(n_{up}+n_{down})$, where $n_{up}$ and $n_{down}$ are the numbers of ascending and descending particles, respectively; (c) $\varPhi _v$ in the linear ordinate.
To quantify the degree of particle near-wall motions for different cases of particle-laden flows, the numbers of upward-moving and downward-moving particles at a given height are counted (denoted as  $n_{up}$ and $n_{down}$). The ratio of $n_{up}$ to the total of $n_{up}$ and $n_{down}$ is calculated, i.e. $n_{up}/(n_{up}+n_{down})$ (following Zheng et al. Reference Zheng, Wang and Zhu2021b), because the near-wall motion is mainly reflected the generating of the ascending particles. A ratio value of zero indicates that the descending particles dominate, while very few particles jump to this wall-normal distance by colliding with the wall. When the particles move violently near the wall, the collision bounces and impact splashing may produce a large number of ascending particles, which results in the number of ascending particles being almost equal to the number of descending particles, i.e. $n_{up}/(n_{up}+n_{down})\approx 0.5$.
Figure 4(b) shows the variations of  $n_{up}/(n_{up}+n_{down)}$ with $y^+$ in different cases. There is a significant difference in the proportion of ascending particles in different cases, which suggests there are different degrees of particle near-wall motions. In the case of top-release particles, the proportion of ascending particles decreases rapidly to almost zero with $y^+$, which is consistent with the experimental results in Zheng et al. (Reference Zheng, Wang and Zhu2021b). This indicates that although particle–wall collisions near the wall are inevitable, the collision process is too weak to transport the rebounding particles to a high position; that is, the particle near-wall motion is weak. In the case of the local-laying sand bed, compared with the top-release particle case, the proportion of ascending particles at different heights in the outer region increases. This indicates that the collision bounce is enhanced because the bottom-released particles are more likely to interact with the wall. In the case of a global-laying sand bed, the particles impacting the erodible surface not only rebound but also splash other stationary particles on the bed surface. This results in the proportion of the ascending particles being greatly increased, equal to nearly half at different heights. The particle near-wall motion in this case is the most significant among the three cases of particle-laden flows due to the addition of the splashing effect. Therefore, to investigate the effects of the particle, the turbulence statistics in the particle-free flow are compared with those in the top-release particle flow; a comparison of the top-release particle case and the local-laying sand bed case could be used to examine the effects of particle collision bounce on turbulence, while the effects of impact splashing can be determined by comparing the local-laying sand bed and global-laying sand bed experiment results.
Figure 4(c) shows  $\varPhi _v$ in the linear ordinate to highlight the large $\varPhi _v$ in the inner region. The variation of $\varPhi _v$ with $y^+$ is systematic and exhibits two obvious inflection points, as shown by the black dashed lines in figure 4(c). In the inner region (approximately $y^+<300$, left of the grey solid lines), $\varPhi _v$ decreases slowly with $y^+$ in all three cases because the collision bounces of the particles maintain a high particle concentration near the wall. The addition of the impact splashing of the particles in the case of a global-laying sand bed makes the particle concentration larger than that in the other two cases of particle-laden flows, $\varPhi _v\sim O(10^{-3})$, at the lowest measurement height. In the logarithmic region (approximately $300< y^+<1000$, between the grey solid lines), the log-linear decreasing trend of $\varPhi _v$ with $y^+$ agrees well with the wind tunnel experimental results in Creyssels et al. (Reference Creyssels, Dupont, El Moctar, Valance, Cantat, Jenkins, Pasini and Rasmussen2009) and the atmospheric flow observational results in Wang, Gu & Zheng (Reference Wang, Gu and Zheng2020), and is much more significant than that in the buffer layer. Here, $\varPhi _v$ is less than $10^{-3}$, and the flows belong to the two-way coupled dilute two-phase flow. In the wake region ( $y^+>1000$, right of the grey solid lines), $\varPhi _v$ decreases to a value less than $O(10^{-6})$; they are unidirectional sparse flows where the particle effects on turbulence are negligible.
3.2. Particle dimensionless parameters
The maximum particle Reynolds number is calculated as  $Re_p=d_p\,\vert u_f-u_p\vert /\nu =21.5$ (where $u_f$ and $u_p$ represent the flow and particle velocity, respectively). This suggests that the flow surrounding the particle is in a non-Stokes state. Therefore, inertia cannot be ignored when calculating the response time of particles. During the experiments, the free stream velocity for the particle-free and particle-laden flow cases were the same, thus the fluid parameters in particle-laden flows were estimated by the particle-free flow. Following Kumaran (Reference Kumaran2003), the modified response time $\tau _p$ of the particle could be given as
 \begin{equation} \tau_{p}=\frac{\rho_{p} d_{p}^{2}}{18 \nu \rho_{f}(1+0.15\,Re_{p}^{0.687})}, \end{equation}
and the particle Stokes number can be calculated as
 \begin{equation} St=\tau_p/\tau_f. \end{equation}
Following Tanière et al. (Reference Tanière, Oesterle and Monnier1997) and Zhang et al. (Reference Zhang, Wang and Lee2008), the characteristic time of fluid  $\tau _f$ can be taken as the Kolmogorov time scale $\tau _l$ or the time scale of the energetic turbulent eddy $\tau _L$, which can be estimated separately as
 $$\begin{gather} \tau_{l} = \left(\nu /\varepsilon\right)^{1 / 2}, \end{gather}$$
 $$\begin{gather}\tau_{L} \approx \delta /\left(0.1 U_{\infty}\right), \end{gather}$$
where  $\varepsilon$ is the turbulence dissipation rate. The formula used to estimate $\varepsilon$ is written as (Sheng, Meng & Fox Reference Sheng, Meng and Fox2000)
 \begin{equation} \varepsilon ={-}\langle\tau_{i,j}S_{i,j}\rangle, \end{equation}
where
 \begin{equation} \tau_{i,j} ={-}2C_{s}^{2}\varDelta^{2}\lvert\,\langle S_{i,j}\rangle \rvert\,\langle S_{i,j}\rangle \end{equation}
is sub-grid scale stress,  $C_{s} = 0.17$ is the Smagorinsky constant, $\varDelta$ denotes the physics distance of the vector for PIV data processing, $S_{i,j}$ denotes the strain rate tensor, and the angle bracket represents the time average. The product of the strain rate tensor yields five terms in a two-dimensional measurement. Thus the strain rate tensor is multiplied by $9/5$, given that the assumption of homogeneity is satisfied, i.e.
 \begin{equation} \langle S_{i,j}\rangle \langle S_{i,j}\rangle = \left(\frac{9}{5}\right)\left[\left(\frac{\partial U}{\partial x}\right)^{2}+\left(\frac{\partial V}{\partial y}\right)^{2}+ \left(\frac{\partial U}{\partial x}+\frac{\partial V}{\partial y}\right)^{2}+0.5\left(\frac{\partial U}{\partial y}+\frac{\partial V}{\partial x}\right)^{2}\right]. \end{equation}
The  $St$ values corresponding to $\tau _{l}$ and $\tau _{L}$ are denoted as $St_l$ and $St_L$, respectively. In addition, the viscous Stokes number $St^{+}$, which is based on the viscous inner time, is calculated as
 \begin{equation} St^{+} = \tau_{p}u_{\tau}^{2}/\nu. \end{equation}
The characteristic length of the energetic turbulent eddy  $L_e$ is adopted as $\delta$ (Zhang et al. Reference Zhang, Wang and Lee2008), and the Kolmogorov length scale $\eta$ is estimated as
 \begin{equation} \eta=(\nu^{3}/\varepsilon)^{1/4}. \end{equation}
 The key particle parameters related to the three particle-laden flow cases are listed in table 2. The maximum  $St_l$ and minimum $St_L$ are 75.1 and 0.53, respectively, which indicate that the wind-blown sand flows in this study are not in a pure suspension state ( $St_L\ll 1$) or a complete saltation state ( $St_l \gg 1$). Therefore, the particle-laden flows are related to both the turbulence and particle inertias.
Table 2. Key parameters of sand particles in particle-laden flows.

3.3. Data validation of flow field
To verify the reliability of the measurements, some basic mean statistics of the experimental data are compared to the corresponding theoretical predictions based on typical TBL flows (following Hutchins & Marusic Reference Hutchins and Marusic2007a; Marusic et al. Reference Marusic, Monty, Hultmark and Smits2013; Zheng et al. Reference Zheng, Wang and Zhu2021b). One of the most basic verifications is to validate the mean velocity profile, as shown in figure 5, where the blue solid line is the theoretical result (Musker Reference Musker1979), and the red dashed line is the log-linear behaviour. The superscript ‘ $+$’ represents inner scaling, i.e. $U^+=U/u_\tau$. It is seen in figure 5 that the particle-free flow results measured using PIV are in good agreement with the theoretical results.

Figure 5. Mean velocity profile in the particle-free flow measured by PIV.
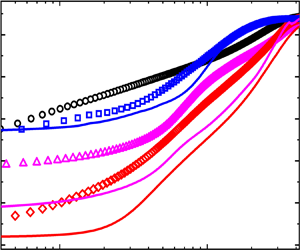
The experimental results of streamwise normal stress are shown in figure 6 and compared with the theoretical calculation results (Marusic & Kunkel Reference Marusic and Kunkel2003). The present particle-free flow experimental result is consistent with the theoretical prediction profile. The average relative error is approximately 5 $\%$. The local underestimation of the streamwise normal stress in the buffer layer is caused by the lack of spatial resolution in the PIV measurement (Adrian Reference Adrian1997; Scarano Reference Scarano2003; Lavoie et al. Reference Lavoie, Avallone, De Gregorio, Romano and Antonia2007); that is, the small-scale turbulent motions that are popular near the wall may not be fully resolved. The deviation extends up to $y^{+}\approx 300$. Given that the difference in the proportion of ascending particles between all of the three particle-laden cases can be negligible in the near-wall region (approximately $y^{+}<300$) and is gradually significant in the outer region (as shown in figure 4b), the effects of particle near-wall motions on turbulence statistics, which are the topic of this study, are derived from the outer region. Therefore, the near-wall underestimation of the Reynolds normal stress may not affect the following analysis. Moreover, the results of particle effects on turbulence statistics in the near-wall region are compared with the previously documented results for reliability.

Figure 6. Comparison of streamwise normal stress measured in the present particle-free flow and the theoretical results (Marusic & Kunkel Reference Marusic and Kunkel2003).
4. Results and discussion
According to the analysis in figure 4, the comparison of the turbulence statistics in the top-release particle flow (Case 2) and the particle-free flow (Case 1) suggests that the effects of the particle on turbulence, the comparison of the local-laying sand (Case 3) and the top-release particle (Case 2) results indicates the effects of particle collision bounce, and the comparison of the global-laying sand (Case 4) and local-laying sand (Case 3) results shows the effects of impact splashing particles. Therefore, this section compares the results of Cases 2 and 1, Cases 3 and 2, and Cases 4 and 3, in sequence.
4.1. Basic statistics
A comparison of the mean velocities in particle-free and particle-laden flows is shown in figure 7. Compared with Case 1, the fluid velocity in Case 2 is lower at  $y^+<1000$ and slightly higher at $y^+>1000$. Given the Reynolds number $Re_\tau =3950$, $y^+=1000$ corresponds to $y=0.25\delta$ in outer scaling, which approximates the upper boundary of the logarithmic region. Therefore, particles in the top-release sand flow reduce the fluid velocity significantly in the inner region, but increase the fluid velocity in the wake region. This is consistent with the two-phase experimental results of Li et al. (Reference Li, Wang, Liu, Chen and Zheng2012) in a horizontal channel with $Re_\tau =470$, and Zheng et al. (Reference Zheng, Wang and Zhu2021b) in a two-phase flow in the boundary layer with $Re_\tau =2002$. A plausible explanation is that in the top-release sand experiment, the particles were released uniformly from the top of the tunnel and accelerated by the free stream flow as they settled. This results in the particles having the same velocity as the free stream velocity when they enter the boundary layer, thus the flow phase velocity at the top of the boundary layer is almost unaffected by the particles. In the subsequent settling process, the high-velocity particles exhibit an accelerating effect on the fluid, making the fluid velocity greater than the velocity in the particle-free flow in the wake region. However, the acceleration effect of the descending particle is not the only mechanism near the wall where the collision bounces of particles also occur (as shown in figure 4b). The inevitable kinetic energy loss during collision slows down the particles, which in turn impedes the fluid motion, and results in the reduced fluid velocity.

Figure 7. Mean velocity profiles in the four cases of particle-free and particle-laden experiments. Symbols denote the fluid velocity, and lines show the particle velocity in the two-phase flow.
The profiles of Cases 2 and 3 in figure 7 show that the average velocity of the flow field in Case 3 is much less than that in Case 2. In the local-laying sand bed case, the stationary sand particles are accelerated gradually by air drag, with the velocity always being less than the fluid velocity. The reaction of the particles slows down the fluid. Meanwhile, the enhanced collision bounce (as shown in figure 4b) exacerbates the kinetic energy loss, and the upward-moving particles with lower streamwise velocity further decelerate the fluid. The combination of these effects causes the fluid velocity in the local-laying sand bed two-phase flow to be much smaller than that in the top-release particle and particle-free flows. Therefore, it may be suitable to propose that the collision bounce of particles reduces the fluid velocity.
Finally, the velocities in Cases 3 and 4 also show a significant difference. Case 4 exhibits a lower mean velocity profile than that in Case 3, and the reduction is more significant closer to the wall. This implies an increase in the mean velocity gradient over the entire boundary layer in the two-phase flow with an erodible surface – that is, an enhanced mean shear. Unlike the local-laying sand bed, the global-laying sand flow contains an erodible surface. The near-wall motions of sand particles include not only the collision bounce, but also the impact splashing (Zheng et al. Reference Zheng, Feng and Wang2021a). Therefore, the difference between Cases 3 and 4 in figure 7 indicates that the addition of impact splashing of particles on the erodible surface weakens the mean velocity and enhances the mean shear of the fluid. This is because the particles impacting the erodible surface not only lose kinetic energy during collision with the wall but also transfer energy to stationary particles on the sand bed, causing particles to splash. This reduces greatly the velocity of rebounding and splashing particles, thereby decelerating the fluid more significantly. The larger particle concentration near the wall enhances the deceleration effect on the fluid, while the particle concentration decreases and the deceleration effect on the fluid weakens with increasing height. In addition, the much lower mean velocity in the two-phase flow with an erodible surface than that in the single-phase flow, as shown in figure 7, is consistent with the numerical simulation results in Zheng et al. (Reference Zheng, Feng and Wang2021a) and the experimental results in Li & McKenna Neuman (Reference Li and McKenna Neuman2012).
The streamwise and wall-normal Reynolds normal stresses in particle-free and the particle-laden flows are shown in figures 8(a) and 8(b). The blue squares represent the experimental results of Case 2. The streamwise and wall-normal Reynolds stresses are smaller in Case 2 than those in Case 1 throughout almost the entire boundary layer, except for the slightly larger values at the top of the boundary layer. This suggests that the particle weakens the Reynolds normal stress, which is consistent with the particle-laden TBL results in Zhu et al. (Reference Zhu, Pan, Wang, Liang and Ji2019). The modulation of Reynolds normal stress by the particles can be scaled by the particle dimensionless parameters, which are summarized in Saber et al. (Reference Saber, Lundström and Hellström2015). The corresponding particle dimensionless parameters for the three cases of particle-laden flow experiments in the present work are listed in table 2, belonging to the range of particles suppressing turbulence intensity. The present experimental results are in good agreement with the existing studies under the same solid wall conditions, confirming the reliability of the experimental measurements in this study. The scale ratio  $d_p/\eta \sim 1$ obtained based on the turbulent minimum scale vortex indicates that particles suppress turbulence due to the enhanced turbulent dissipation by distorting the turbulent small-scale structure and by enhancing the momentum transfer events between the particles and the gas phase (Balachandar & Eaton Reference Balachandar and Eaton2010). In addition, the slightly larger Reynolds normal stress at the top of the boundary layer is the result of particles with large kinetic energy due to the acceleration of the free stream and gravity as they enter the boundary layer.

Figure 8. Comparisons of Reynolds normal stresses in different cases of particle-laden and particle-free flows: (a) streamwise, and (b) wall-normal. Symbols denote the Reynolds stress of the fluid phase, and lines that of the particle phase.
The streamwise and wall-normal Reynolds stresses in Case 3 are represented by pink triangles in figures 8(a) and 8(b), and show a significant difference from the results in Case 2. Both the streamwise and wall-normal Reynolds stresses in the local-laying sand bed flow are smaller than those in the top-release particle experiment at  $y^+<500$, and larger in the outer region of $y^+>500$. Combined with the distributions of the ratio of ascending particles and the particle volume fraction at different wall-normal distances (as shown in figures 4b,c), the proportions of ascending particles are similar in Cases 2 and 3 in the near-wall region, whereas the particle volume fraction is larger in the top-release particle case than in the local-laying sand bed case. The suppression of turbulence by particles is more significant, and thus reduces the Reynolds normal stress in the local-laying sand bed flow. With increasing height, the difference in the proportion of ascending particles between these two cases gradually increases; that is, the proportion is larger in the local-laying sand bed case than in the top-release particle case due to the enhanced collision bounce. However, the distinction of the particle volume fraction decreases, which indicates that there is an insignificant difference in the particle effect. Therefore, the Reynolds normal stress in the outer region of the local-laying sand bed two-phase flow is increased due to the collision bounce of particles. This implies that the particle weakens the Reynolds normal stress, while the collision bounce enhances it. In addition, the Reynolds normal stress of the case of local-laying sand is also enhanced as compared to the particle-free experiment in the outer region. This provides further evidence for the enhanced Reynolds normal stress by the collision bounce, given that the particle attenuates it.
The streamwise and wall-normal Reynolds stresses in Case 4 shown in figure 8 indicate that the trend of the Reynolds normal stress varies with height similarly to that in Case 3, but the magnitude is much larger at all heights within the measurement range, although this is not obvious in the near-wall region and at the top of the boundary layer. Compared with the local-laying sand bed flow, the particle motions in the global-laying sand bed flow include the impact splashing, instead of only the collision bounce. However, there is no significant difference in the proportion of ascending particles (and thus the effect of particle motions on turbulence) for these two cases in the near-wall region (as shown in figure 4b); instead, the larger particle volume fraction (more significant attenuation effect of particles on turbulence) in the global-laying sand bed flow results in the Reynolds normal stress seeming slightly smaller than that in the local-laying sand bed flow. With increasing height, the proportion of ascending particles in Case 4 is gradually larger than in Case 3 due to the addition of the impact splashing particles, and the difference of the Reynolds normal stress between these two flows also appears, i.e. the Reynolds normal stress in the global-laying sand bed flow is larger than that in the local case (a maximum of 43 % larger). This suggests that the effect of the impact splashing particle in the two-phase flow with erodible surface is to enhance the streamwise and wall-normal Reynolds stresses. At the top of the boundary layer (approximately  $y^+>3000$), the particle volume fraction is rarely low, approaching the order $O(10^{-8})$. In this situation, the particle effects on turbulence can be negligible (Balachandar & Eaton Reference Balachandar and Eaton2010), leading to the collapse of the Reynolds normal stress profiles in these two cases. In addition, figure 8 shows that the streamwise and wall-normal Reynolds stresses decrease near the wall and increase in the outer region for the two-phase flow with an erodible surface compared with that in the single-phase flow. This is consistent with the results in Zheng et al. (Reference Zheng, Feng and Wang2021a) and Li & McKenna Neuman (Reference Li and McKenna Neuman2012).
The streamwise and wall-normal dimensionless normal Reynolds stresses of the particle phase at different heights are also shown in figures 8(a) and 8(b). In Case 2, the Reynolds normal stresses of the particle phase are significantly higher than that of the carrier phase in Case 2 and the particle phase in Cases 3 and 4, which is consistent with the results of Li et al. (Reference Li, Wang, Liu, Chen and Zheng2012). This may be because the top-released particle obtained a relatively high kinetic energy during the gravity settling (Tanière et al. Reference Tanière, Oesterle and Monnier1997; Wu et al. Reference Wu, Wang, Liu, Li, Zhang and Zheng2006; Li et al. Reference Li, Wang, Liu, Chen and Zheng2012; Zhu et al. Reference Zhu, Pan, Wang, Liang and Ji2019). In Cases 3 and 4, the trends of the Reynolds normal stress of the particle phase are consistent qualitatively (as well as consistent with the results in Costa et al. Reference Costa, Picano, Brandt and Breugem2018, Reference Costa, Brandt and Picano2021), but the magnitude of Case 4 is slightly smaller than that of Case 3 because more kinetic energy is lost during the collision of particles with the erodible surface in Case 4 (not only losing kinetic energy during collision with the wall but also transferring energy to stationary particles on the sand bed) as compared to the solid wall in Case 3.
To verify further the results in figure 8, the Reynolds shear stresses of the flow field in different cases of particle-laden and particle-free experiments are also examined, and the results are compared in figure 9. Figure 9 shows that the Reynolds shear stress measured in Case 2 is less than the results in Case 1, especially in the inner region due to the large particle volume fraction (as observed in Zhu et al. Reference Zhu, Pan, Wang, Liang and Ji2019). This indicates that the particle weakens the Reynolds shear stress in the particle-laden flow. The reduction in Reynolds shear stress in the near-wall region may be due to the suppression of the ejection and sweep events (evidence provided in the next subsection) by the particles, which weakens the generation of Reynolds shear stress (Righetti & Romano Reference Righetti and Romano2004; Li et al. Reference Li, Wang, Liu, Chen and Zheng2012).

Figure 9. Comparison of the Reynolds shear stresses measured by the PIV experiments for single-phase flow and different cases of particle-laden flows. Symbols denote the fluid Reynolds shear stress, and lines show the particle phase Reynolds shear stress.
The comparison of the results in Cases 2 and 3 shown in figure 9 is consistent with the phenomenon in the Reynolds normal stress. The Reynolds shear stress measured in Case 3 is weakened compared with the results in Case 2 in the near-wall region, while it is enhanced in the outer region of the boundary layer. This is expected because the cause of this phenomenon is the same as that of the Reynolds normal stress. In the near-wall region, the ascending particle ratio is similar for the two cases, while the particle volume fraction of the local-laying sand case is greater than that in the top-release sand case, and the weakening effect of the particles on the Reynolds shear stress is dominant. Further from the wall, the ascending particle ratio of the local-laying sand bed is much larger than in the top-release sand condition, but the difference in the particle volume fraction becomes negligible. Therefore, the increased Reynolds shear stress in Case 3 is caused by the collision bounce of particles, i.e. the effect of collision bounce in the near-wall motion of particles is to enhance the Reynolds shear stress. The Reynolds shear stress in Case 4 is greater than that in Case 3, indicating that the addition of impact splashing of particles in the two-phase flow with erodible surfaces enhances the Reynolds shear stress. The greatly reduced particle concentration eliminates the difference at the top of the boundary layer. In addition, the increased Reynolds shear stress in the particle-laden flow with an erodible surface as compared to the particle-free flow is consistent qualitatively with the interface-resolved DNS two-phase flow results in Costa et al. (Reference Costa, Brandt and Picano2020, Reference Costa, Brandt and Picano2021) for small-inertia particles.
The Reynolds shear stresses of the particle phase in particle-laden cases are also shown in figure 9. As expected, the comparison of the results in the three cases of the particle-laden flows is consistent with that of the Reynolds normal stresses. The trend of the particle shear stress in Case 2 is consistent at a qualitative level with that in Zhu et al. (Reference Zhu, Pan, Wang, Liang and Ji2019), and the trends in Cases 3 and 4 are consistent with the results of Costa et al. (Reference Costa, Brandt and Picano2021).
4.2. Pre-multiplied energy spectrum
The turbulence pre-multiplied energy spectrum can reveal the energy distribution of multiscale turbulent motions and thus has been used widely in the study of turbulence (Kim & Adrian Reference Kim and Adrian1999; Kunkel & Marusic Reference Kunkel and Marusic2006; Hutchins & Marusic Reference Hutchins and Marusic2007a; Wang & Zheng Reference Wang and Zheng2016; Baars & Marusic Reference Baars and Marusic2020). This subsection presents the pre-multiplied energy spectrum of streamwise velocity fluctuations in different cases of experimental measurements.
The pre-multiplied spectra of the fluctuating streamwise velocity  $k_x\varPhi _{uu}/{{u_\tau }^{2}}$ (where $\varPhi _{uu}$ denotes the power spectral density of the fluctuating streamwise velocity, and $k_x=2{\rm \pi} /\lambda _x$ denotes the streamwise wavenumber) versus the inner-scaled streamwise wavelength $\lambda _x^+$ at different wall-normal distances in the four cases are presented in figures 10(a–d). Figure 10(a) shows that a distinct energy peak occurs at $y^+\approx 230$ ( $y\approx 0.06\delta$) in Case 1, and the peak corresponds to a scale of $\lambda _x^+\approx 16\,000$ ( $\lambda _x/\delta \approx 4$). This is consistent with the results in Deck et al. (Reference Deck, Renard, Laraufie and Weiss2014) at a similar Reynolds number ( $Re_\tau =3700$), and is referred to as the outer energy site by Hutchins & Marusic (Reference Hutchins and Marusic2007b). The energy in this outer spectral peak is a result of the largest motions in the TBL that are commonly termed very-large-scale motions (VLSMs) or ‘superstructures’. It is noted that the underestimated scale of the outer energy site (generally thought to be $6\delta$) is caused by the truncated compression effect of the pre-multiplied spectrum on the large scale of turbulence due to the limited streamwise field of view of PIV (de Silva et al. Reference de Silva, Squire, Hutchins and Marusic2015). This does not affect the subsequent analysis of the relative energy strength for the spectral peak and the wall-normal position.

Figure 10. Colour contour maps showing variation of one-dimensional pre-multiplied spectra of streamwise velocity fluctuations with wall-normal position in: (a) Case 1, particle-free flow; (b) Case 2, top-release particle two-phase flow; (c) Case 3, local-laying sand bed flow; (d) Case 4, global-laying sand bed flow. The  $x$-axis is the length scale for inner scaling. The $y$-axis is the wall-normal position for inner scaling. The colour scale shows the magnitude of $k_x\varPhi _{uu}/{u_\tau }^{2}$.
Figure 10(b) shows the pre-multiplied spectra in Case 2. The magnitude of  $k_x\varPhi _{uu}/{u_\tau }^{2}$ is significantly smaller than that of Case 1, which supports that the particle in two-phase flow decreases the Reynolds stress, as shown in figure 8. Moreover, the length scale corresponding to the outer spectral peak at approximately the centre of the logarithmic region is reduced significantly, with $y^+\approx 230$ ( $y\approx 0.06\delta$). This indicates that the particles alter the energy distribution among multiscale turbulent motions. The energy in the outer spectral peak is a result of the small-scale motions instead of the VLSMs. This result can be supported by the particle-laden experiments in Zheng et al. (Reference Zheng, Wang and Zhu2021b), where the VLSMs were observed to be reduced substantially in length scale or even destroyed. As a result, the energy is concentrated at small-scale motions below the centre of the logarithmic region. Nevertheless, figure 10(b) shows that another spectral peak, with wavelength $\lambda _x^+\approx 16\,000$ ( $\lambda _x/\delta \approx 4$), associated with the VLSMs, seems to occur at the top of the logarithmic region ( $y^+\approx 1000$ and $y/\delta \approx 0.25$).
Figure 10(c) shows the pre-multiplied energy spectra in Case 3. Compared with those in Case 2, there are two distinct energy peaks in the outer region of the TBL. However, the spectral peak at the top of the logarithmic region is more remarkable, with a magnitude much larger than the peak at the centre of the logarithmic region. The corresponding wavelength is approximately  $4\delta$, thus the distinct energy peak at the top of the logarithmic region comes from the VLSMs or superstructures. This indicates that the location where the VLSMs are a dominant feature in turbulence is lifted further from the wall in the particle-laden two-phase flow, and the collision bounce effect of the particle enhances significantly the kinetic energy of the VLSMs therein. The ascending particle ratio is greater in the local-laying sand bed flow than in the top-release sand case due to the collision bounce with the wall. The upward-moving particles promote the upward transport of the turbulent kinetic energy (TKE) produced near the wall, which contributes to a remarkable increase in the energy of the VLSMs in the outer region.
Moreover, a further enhanced spectral peak at the top of the log region is observed in the pre-multiplied energy spectra of Case 4, as shown in figure 10(d). The magnitude almost exceeds three times the peak spectral energy at the centre of the log region. As mentioned above, the impact splashing of particles in the global-laying sand bed case greatly increases the proportion of ascending particles in the entire measured boundary layer. This causes the upward transport of TKE produced near the wall to be significant, which further enhances the kinetic energy of the VLSMs associated with the distinct spectral peak at the top of the log region. In summary, figure 10 indicates that the energy distribution at multiscale turbulent motions and different wall-normal positions changes in the particle-laden two-phase flow; that is, the wall-normal range in which small-scale motions dominate is extended to the centre of the log region, while the position where the VLSMs are a dominant feature is lifted further from the wall. The collision bounce and impact splashing of particle cause the TKE produced near the wall to increase, and thus enhance significantly the kinetic energy of the VLSMs. In other words, the collision bounce and impact splashing make the VLSMs more energetic and transport them upwards.
4.3. Quadrant analysis
The turbulence structure determines the turbulence statistical characteristics, and quadrant events are the concrete manifestation of the turbulence structure effects on turbulence statistical characteristics. Therefore, quadrant analysis (Willmarth & Lu Reference Willmarth and Lu1972; Kiger & Pan Reference Kiger and Pan2002; Li et al. Reference Li, Wang, Liu, Chen and Zheng2012) was applied to gain further insight into the turbulence characteristics in particle-laden flows. The four quadrant events are: Q1 events,  $u>0$ and $v>0$; Q2 events, $u<0$ and $v>0$; Q3 events, $u<0$ and $v<0$; and Q4 events, $u>0$ and $v<0$. The ejection and sweep events represented by Q2 and Q4 are associated with the large-scale structures (Jeong et al. Reference Jeong, Bae, Lee and Kim1997) and thus contribute significantly to the production of both Reynolds shear stress and TKE.
To obtain a better understanding of the turbulence modulation by particle near-wall motions, condition averaging for the Reynolds shear stress of the gas phase is conducted for quadrants Q2 and Q4 using the measurements of the four experiment cases. The results are shown in figure 11. The Reynolds shear stresses inhabiting the Q2 and Q4 quadrant events are smaller in Case 2 than in Case 1. This indicates that the particles in the top-release particle flow weaken the intensities of the ejection and sweep events in the boundary layer. The ejection of lower velocity fluids and the sweep of higher velocity fluids are responsible for the formation of a hairpin vortex, which is an important elementary coherent structure in the wall turbulence (Dennis Reference Dennis2015). According to the model proposed by Adrian, Meinhart & Tomkins (Reference Adrian, Meinhart and Tomkins2000), the hairpin vortex packet created by coherent alignment of hairpin vortices in the streamwise direction is called larger-scale coherent motion. Therefore, the particles reduce the length of the energetic large-scale structure in the centre of the log region (as shown in figure 10) by suppressing the formation of hairpin vortices and hairpin vortex packets. Large-scale and very-large-scale structures contribute significantly to the production of TKE and Reynolds shear stress (Guala, Hommema & Adrian Reference Guala, Hommema and Adrian2006; Balakumar & Adrian Reference Balakumar and Adrian2007; Wang & Zheng Reference Wang and Zheng2016). Therefore, the intensity of the ejection and sweep events that is suppressed by the particles reduces the Reynolds stress in the top-release sand two-phase flow (see figures 8 and 9).

Figure 11. Gas-phase Reynolds shear stresses from quadrant events (a) Q2 and (b) Q4 in four cases of particle-free and particle-laden flow experiments.
The comparison of the results in Cases 2 and 3 in figure 11 shows that the Reynolds shear stresses of Q2 and Q4 in Case 3 are less than those in Case 2 for approximately  $y^+<500$, and much greater for $y^+>500$. This phenomenon is similar to the analysis of Reynolds stress in figures 8 and 9. Moreover, the comparison of Cases 3 and 4 in figure 11 is also consistent with that of Reynolds stress; that is, the intensities of Q2 and Q4 events for Case 4 are greater than those for Case 3. A similar analysis indicates that both the collision bounce and impact splashing of particles enhance the intensities of the turbulent ejection and sweep events. The upward throw of the lower velocity fluid and the downward sweep of the higher velocity fluid promote the formation of the hairpin vortex and thus enhance the production of TKE and Reynolds shear stress. Meanwhile, the ascending particles generated by collision bounce and impact splashing enhance the upward transport of the TKE. Therefore, a distinct energy peak further from the wall is produced in the pre-multiplied spectrum (as shown in figures 10c,d).
The probability of turbulent ejection and sweep events can be analysed by the probability distribution in quadrants Q2 and Q4 (Li et al. Reference Li, Wang, Liu, Chen and Zheng2012), which is given as
 \begin{equation} P(q_i,y^+)=\frac{N_{q_i}(y^+)}{N_{total}(y^+)}\quad i=(2,4), \end{equation}
where  $N_{qi}$ is the number of vectors of the corresponding quadrant events at a given height, and $N_{total}$ is the total number of vectors of the instantaneous velocity field.
The smoothed probability distributions (following the spectral smoothing method in Kunkel & Marusic Reference Kunkel and Marusic2006; Wang & Zheng Reference Wang and Zheng2016) of quadrants Q2 and Q4 at different wall-normal locations are shown in figure 12. Although the difference in the probability of ejection and sweep events under different experimental conditions is less pronounced, a comparison of different cases still shows the same phenomenon as the above mentioned Reynolds shear. Roughly, in the inner region where the particle volume fraction is large, the probabilities of ejection and sweep events are smaller in the top-release sand flow (Case 2, with averages 0.283 and 0.271) than in the single-phase flow (Case 1, 0.310 and 0.311). In the outer region where the difference in the proportion of ascending particles between all of the three particle-laden cases is significant, the probabilities are larger for the local-laying sand bed flow (Case 3, 0.282 and 0.333) compared to Case 2 (0.274 and 0.298), and larger in the global-laying sand bed flow (Case 4, 0.285 and 0.345) than in Case 3. This indicates that the particle decreases the frequency of ejection and sweep events, while the collision bounce and impact splashing of the particle increase the frequency. The upward-moving particles increase the frequency of the ‘ejection and sweep’ cycle, which enhances the energy transfer of turbulence.

Figure 12. Probability distribution of (a) Q2 and (b) Q4 events for the gas phase in four cases of particle-free and particle-laden flow experiments.
5. Conclusions
Four experiment cases, including top-release particles, local-laying sand beds and global-laying sand beds, at  $Re_\tau =3950$, were conducted in a horizontal wind tunnel using the PIV/PTV measurement technique with a two-dimensional extensive field of view to obtain the two-phase velocity fields. By comparing the experiments results with different degrees of particle near-wall motions, the effects of collision bouncing and impact splashing of particles with walls on turbulence characteristics are investigated to determine the difference in the modulations of turbulence by particles.
The particles released at the top are accelerated by the free stream flow in the process of gravitational settling, allowing the particles to have the same velocity as the free stream flow as they enter the boundary layer. The high-velocity particles exhibit an accelerating effect on the fluid during the subsequent settling process, which leads to a fluid velocity larger than that for the particle-free flow in the wake region. However, the collision bounce of particles with the wall loses kinetic energy, slows down the particles, and produces upward-moving particles, which bring particles with lower velocity into the fluid with higher velocity and thus decelerate the fluid. Moreover, the impact splashing of particles on the erodible surface decelerates the fluid more significantly because the particles that impact the erodible surface not only lose kinetic energy during collision with the wall but also transfer energy to the stationary particles.
In addition, the top-released particles decrease the intensities of the ejection and sweep events, and reduce the frequency of the ejection and sweep cycle. This results in a decrease in the length of the energetic large-scale structure, which is associated with the spectral peak in the centre of the log region, due to the ejection of lower-velocity fluids, and the sweep of higher-velocity fluids is responsible for the formation of hairpin vortices (Dennis Reference Dennis2015); the coherent alignment of hairpin vortices creates hairpin vortex packets called larger-scale coherent motion (Adrian et al. Reference Adrian, Meinhart and Tomkins2000). Therefore, the wall-normal range in which small-scale motions dominate is extended to the centre of the log region, while the position where VLSMs are a dominant feature is lifted further from the wall in the particle-laden two-phase flow. As a result, the particles attenuate the Reynolds stress. However, the collision bounce and impact splashing of the particle promote the ejection and sweep cycle and enhance the intensities of ejection and sweep, thus enhancing the production of TKE and Reynolds shear stress. Meanwhile, the ascending particles generated by collision bounce and impact splashing transport the TKE produced near the wall upwards. Therefore, the kinetic energy of the VLSMs further from the wall is enhanced significantly, which is shown to be a remarkable energy peak in the pre-multiplied spectrum at the top of the log region. The collision bounce and impact splashing seem to make the VLSMs more energetic and transport them upwards.
This work has designed experiments to distinguish the effects of particles and the effects of particle near-wall motions, which are usually confused. The findings reveal the effects of collision bouncing and impact splashing of particles with walls on turbulence statistics, and present the difference in the modulations of turbulence by particles, thus contributing a further insight into turbulence dynamics in particle-laden two-phase flow.
Acknowledgements
The authors are very grateful to X. Ji, W. Chen and Y. Wang for their help during the experiment and data processing.
Funding
This study was supported by grants from the National Natural Science Foundation of China (nos 92052202 and 11802110). The authors would like to express their sincere appreciation for the support.
Declaration of interests
The authors report no conflict of interest.


