


1 Introduction
1.1 Overview
Canonical flows play a special role in fluid dynamics. Their relative simplicity allows deep insight into mechanisms underlying real-world flow phenomena, and they also provide invaluable teaching material. In the laminar regime, canonical flows can often be described by explicit analytical formulae, which are exact solutions of the Navier–Stokes equations. In the turbulent regime some features of canonical flows can also be described by explicit analytical formulae, obtained semi-empirically by combining theoretical considerations with direct observations. The logarithmic velocity profile in a boundary layer is perhaps the most widely known example. The goal of the present study is to identify the slowest-decaying eigenmodes of averaged small-amplitude perturbations to a turbulent channel flow – which is one of the most fundamental canonical flows.
The paper is structured as follows: § 1.2 describes the analogous laminar channel flow case, for which the slowest-decaying eigenmodes can be obtained analytically, § 1.3 describes the turbulent channel flow case and provides a problem specification, § 1.4 reviews previous related work, § 2 details our chosen methodology, § 3 identifies the slowest-decaying eigenmodes and finally §4 draws conclusions.
1.2 Laminar channel flow case
Consider a plane channel that is infinite in the
 $x$
- and
$x$
- and
 $z$
-directions, with parallel no-slip walls at
$z$
-directions, with parallel no-slip walls at
 $y=\pm 1$
. Flow in such a channel is governed by the Navier–Stokes equation and the continuity equation
$y=\pm 1$
. Flow in such a channel is governed by the Navier–Stokes equation and the continuity equation
 $$\begin{eqnarray}\displaystyle & \displaystyle \displaystyle \frac{\unicode[STIX]{x2202}\boldsymbol{u}}{\unicode[STIX]{x2202}t}+\boldsymbol{u}\boldsymbol{\cdot }\unicode[STIX]{x1D735}\boldsymbol{u}=-\unicode[STIX]{x1D735}p+{\displaystyle \frac{1}{Re}}\unicode[STIX]{x1D6FB}^{2}\boldsymbol{u}, & \displaystyle\end{eqnarray}$$
 $$\begin{eqnarray}\displaystyle & \displaystyle \unicode[STIX]{x1D735}\boldsymbol{\cdot }\boldsymbol{u}=0, & \displaystyle\end{eqnarray}$$
subject to the boundary condition
 $$\begin{eqnarray}\displaystyle \boldsymbol{u}(x,\pm 1,z,t)=0, & & \displaystyle\end{eqnarray}$$
where
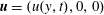
 $\boldsymbol{u}=(u,v,w)$
is the velocity,
$\boldsymbol{u}=(u,v,w)$
is the velocity,
 $p$
is the pressure and
$p$
is the pressure and
 $Re$
is the Reynolds number.
$Re$
is the Reynolds number.
If
 $Re$
is low enough such that flow is laminar, a simple unsteady solution of (1.1)–(1.2) can be obtained by imposing an initial condition
$Re$
is low enough such that flow is laminar, a simple unsteady solution of (1.1)–(1.2) can be obtained by imposing an initial condition
 $$\begin{eqnarray}\displaystyle \boldsymbol{u}(x,y,z,0)=(u_{\mathit{IN}}(y),0,0), & & \displaystyle\end{eqnarray}$$
that is independent of the wall-parallel coordinates
 $x$
and
$x$
and
 $z$
. In this case it is easy to verify that
$z$
. In this case it is easy to verify that
 $\boldsymbol{u}=(u(y,t),0,0)$
at all times, the pressure gradient is independent of space and (1.1)–(1.2) reduces to the heat equation
$\boldsymbol{u}=(u(y,t),0,0)$
at all times, the pressure gradient is independent of space and (1.1)–(1.2) reduces to the heat equation
 $$\begin{eqnarray}\displaystyle \displaystyle \frac{\unicode[STIX]{x2202}u}{\unicode[STIX]{x2202}t}=-d+{\displaystyle \frac{1}{Re}}\displaystyle \frac{\unicode[STIX]{x2202}^{2}u}{\unicode[STIX]{x2202}y^{2}}, & & \displaystyle\end{eqnarray}$$
where
 $$\begin{eqnarray}\displaystyle d={\displaystyle \frac{\text{d}p}{\text{d}x}}. & & \displaystyle\end{eqnarray}$$
To uniquely determine the solution, either the pressure gradient
 $d$
or the mass flow rate must be prescribed. Assuming the latter, separation of variables leads to
$d$
or the mass flow rate must be prescribed. Assuming the latter, separation of variables leads to
 $$\begin{eqnarray}\displaystyle u(y,t)=U(y)+u^{\prime }(y,t),\quad d(t)=D+d^{\prime }(t), & & \displaystyle\end{eqnarray}$$
where
 $D$
is the constant pressure gradient associated with the steady state solution
$D$
is the constant pressure gradient associated with the steady state solution
 $U(y)$
, and
$U(y)$
, and
 $$\begin{eqnarray}\displaystyle u^{\prime }(y,t)=\mathop{\sum }_{n=1}^{\infty }C_{n}\text{e}^{\unicode[STIX]{x1D706}_{n}t}u_{n}(y),\quad d^{\prime }(t)=\mathop{\sum }_{n=1}^{\infty }C_{n}\text{e}^{\unicode[STIX]{x1D706}_{n}t}d_{n}, & & \displaystyle\end{eqnarray}$$
where
 $C_{n}$
are determined by the form of
$C_{n}$
are determined by the form of
 $u_{\mathit{IN}}$
, and
$u_{\mathit{IN}}$
, and
 $u_{n}(y)$
,
$u_{n}(y)$
,
 $d_{n}$
and
$d_{n}$
and
 $\unicode[STIX]{x1D706}_{n}$
are solutions of the eigenvalue problem
$\unicode[STIX]{x1D706}_{n}$
are solutions of the eigenvalue problem
 $$\begin{eqnarray}\displaystyle \unicode[STIX]{x1D706}_{n}u_{n}=-d_{n}+{\displaystyle \frac{1}{Re}}\displaystyle \frac{\text{d}^{2}u_{n}}{\text{d}y^{2}},\quad u_{n}(-1)=u_{n}(1)=0,\quad \int _{-1}^{+1}u_{n}\,\text{d}y=0. & & \displaystyle\end{eqnarray}$$
All eigenvalues of this problem are negative, and hence
 $u(y,t)\rightarrow U(y)$
as
$u(y,t)\rightarrow U(y)$
as
 $t\rightarrow \infty$
. Moreover the eigenvalues can be ordered such that
$t\rightarrow \infty$
. Moreover the eigenvalues can be ordered such that
 $\unicode[STIX]{x1D706}_{n+1}>\unicode[STIX]{x1D706}_{n}$
for all
$\unicode[STIX]{x1D706}_{n+1}>\unicode[STIX]{x1D706}_{n}$
for all
 $n$
. The slowest-decaying eigenmode is given by
$n$
. The slowest-decaying eigenmode is given by
 $$\begin{eqnarray}\displaystyle u_{1}(y)=\sin (\unicode[STIX]{x03C0}y),\quad d_{1}=0,\quad \unicode[STIX]{x1D706}_{1}=-\unicode[STIX]{x03C0}^{2}/Re, & & \displaystyle\end{eqnarray}$$
which is anti-symmetric. The second slowest-decaying eigenmode is given by
 $$\begin{eqnarray}\displaystyle u_{2}(y)=\cos (\unicode[STIX]{x1D6FC}y)-\cos (\unicode[STIX]{x1D6FC}),\quad d_{2}=\unicode[STIX]{x1D706}_{2}\cos \unicode[STIX]{x1D6FC},\quad \unicode[STIX]{x1D706}_{2}=-\unicode[STIX]{x1D6FC}^{2}/Re, & & \displaystyle\end{eqnarray}$$
which is symmetric, where
 $\unicode[STIX]{x1D6FC}=4.4934$
is the smallest solution of
$\unicode[STIX]{x1D6FC}=4.4934$
is the smallest solution of
 $$\begin{eqnarray}\displaystyle \sin (\unicode[STIX]{x1D6FC})=\unicode[STIX]{x1D6FC}\cos (\unicode[STIX]{x1D6FC}). & & \displaystyle\end{eqnarray}$$
Consequently, the long-time behaviour of the solution for a generic initial condition is typically
 $u(y,t)\approx U(y)+C_{1}\text{e}^{\unicode[STIX]{x1D706}_{1}t}u_{1}(y)$
(assuming
$u(y,t)\approx U(y)+C_{1}\text{e}^{\unicode[STIX]{x1D706}_{1}t}u_{1}(y)$
(assuming
 $u_{1}(y)$
is excited by the initial condition), whereas the long-time behaviour for symmetric initial conditions, which would not excite
$u_{1}(y)$
is excited by the initial condition), whereas the long-time behaviour for symmetric initial conditions, which would not excite
 $u_{1}(y)$
, is typically
$u_{1}(y)$
, is typically
 $u(y,t)\approx U(y)+C_{2}\text{e}^{\unicode[STIX]{x1D706}_{2}t}u_{2}(y)$
(assuming
$u(y,t)\approx U(y)+C_{2}\text{e}^{\unicode[STIX]{x1D706}_{2}t}u_{2}(y)$
(assuming
 $u_{2}(y)$
is excited by the initial condition).
$u_{2}(y)$
is excited by the initial condition).
1.3 Turbulent channel flow case
If
 $Re$
is high enough such that flow is turbulent, then the widely accepted triple decomposition (Hussain & Reynolds Reference Hussain and Reynolds1970) can be applied, and the velocity field can be written as
$Re$
is high enough such that flow is turbulent, then the widely accepted triple decomposition (Hussain & Reynolds Reference Hussain and Reynolds1970) can be applied, and the velocity field can be written as
 $$\begin{eqnarray}\displaystyle \boldsymbol{u}=\overline{\boldsymbol{U}}+\overline{\boldsymbol{u}}^{\prime }+\boldsymbol{u}^{\prime \prime }, & & \displaystyle\end{eqnarray}$$
where
 $\overline{\boldsymbol{U}}$
is a steady component,
$\overline{\boldsymbol{U}}$
is a steady component,
 $\overline{\boldsymbol{u}}^{\prime }$
is a coherent component and
$\overline{\boldsymbol{u}}^{\prime }$
is a coherent component and
 $\overline{\boldsymbol{u}}^{\prime \prime }$
is a fluctuating component. Averaging the Navier–Stokes equation (1.1) and the continuity equation (1.2) leads to the unsteady Reynolds-averaged Navier–Stokes equation and continuity equation
$\overline{\boldsymbol{u}}^{\prime \prime }$
is a fluctuating component. Averaging the Navier–Stokes equation (1.1) and the continuity equation (1.2) leads to the unsteady Reynolds-averaged Navier–Stokes equation and continuity equation
 $$\begin{eqnarray}\displaystyle & \displaystyle \displaystyle \frac{\unicode[STIX]{x2202}\overline{\boldsymbol{u}}}{\unicode[STIX]{x2202}t}+\overline{\boldsymbol{u}}\boldsymbol{\cdot }\unicode[STIX]{x1D735}\overline{\boldsymbol{u}}=-\unicode[STIX]{x1D735}\overline{p}+{\displaystyle \frac{1}{Re}}\unicode[STIX]{x1D6FB}^{2}\overline{\boldsymbol{u}}-\unicode[STIX]{x1D735}\overline{\boldsymbol{u}^{\prime \prime }\boldsymbol{u}^{\prime \prime }}, & \displaystyle\end{eqnarray}$$
 $$\begin{eqnarray}\displaystyle & \displaystyle \unicode[STIX]{x1D735}\boldsymbol{\cdot }\overline{\boldsymbol{u}}=0, & \displaystyle\end{eqnarray}$$
subject to the boundary condition
 $$\begin{eqnarray}\displaystyle \overline{\boldsymbol{u}}(x,\pm 1,z,t)=0, & & \displaystyle\end{eqnarray}$$
where
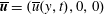
 $\overline{\boldsymbol{u}}=\overline{\boldsymbol{U}}+\overline{\boldsymbol{u}}^{\prime }$
is the averaged velocity,
$\overline{\boldsymbol{u}}=\overline{\boldsymbol{U}}+\overline{\boldsymbol{u}}^{\prime }$
is the averaged velocity,
 $\overline{p}$
is the averaged pressure and
$\overline{p}$
is the averaged pressure and
 $\overline{\boldsymbol{u}^{\prime \prime }\boldsymbol{u}^{\prime \prime }}$
is called the Reynolds stress tensor. In the case of a plane channel flow the averaging can be done in either of the wall-parallel directions, or over an ensemble of channels. According to the widely accepted ergodic hypothesis these averaging methods and their combinations are equivalent, provided that the flow is statistically homogeneous in wall-parallel directions.
$\overline{\boldsymbol{u}^{\prime \prime }\boldsymbol{u}^{\prime \prime }}$
is called the Reynolds stress tensor. In the case of a plane channel flow the averaging can be done in either of the wall-parallel directions, or over an ensemble of channels. According to the widely accepted ergodic hypothesis these averaging methods and their combinations are equivalent, provided that the flow is statistically homogeneous in wall-parallel directions.
Analogous to the laminar case, one can attempt to obtain a simple solution by imposing an initial condition
 $$\begin{eqnarray}\displaystyle \overline{\boldsymbol{u}}(x,y,z,0)=(\overline{u}_{\mathit{IN}}(y),0,0), & & \displaystyle\end{eqnarray}$$
that is independent of the wall-parallel coordinates
 $x$
and
$x$
and
 $z$
. In this case it is easy to verify that
$z$
. In this case it is easy to verify that
 $\overline{\boldsymbol{u}}=(\overline{u}(y,t),0,0)$
at all times, the averaged pressure gradient is independent of space and (1.14)–(1.15) reduces to
$\overline{\boldsymbol{u}}=(\overline{u}(y,t),0,0)$
at all times, the averaged pressure gradient is independent of space and (1.14)–(1.15) reduces to
 $$\begin{eqnarray}\displaystyle \displaystyle \frac{\unicode[STIX]{x2202}\overline{u}}{\unicode[STIX]{x2202}t}=-\overline{d}+{\displaystyle \frac{1}{Re}}\displaystyle \frac{\unicode[STIX]{x2202}^{2}\overline{u}}{\unicode[STIX]{x2202}y^{2}}-\displaystyle \frac{\unicode[STIX]{x2202}\overline{u^{\prime \prime }v^{\prime \prime }}}{\unicode[STIX]{x2202}y}, & & \displaystyle\end{eqnarray}$$
where
 $$\begin{eqnarray}\displaystyle \overline{d}={\displaystyle \frac{\text{d}\overline{p}}{\text{d}x}}. & & \displaystyle\end{eqnarray}$$
Since (1.18) contains an unknown Reynolds stress term, it is not closed. We anticipate that the correct, yet unknown, closure exists. The objective of the current study is to ascertain whether in the limit of small-amplitude perturbations (1.18), with the correct closure, has solutions of a form analogous to (1.8), and in particular to identify the slowest-decaying anti-symmetric and symmetric eigenmodes that are analogous to (1.10) and (1.11). However, since the closure for (1.18) is unknown, the system cannot be solved directly. Therefore, the problem will be tackled via an extensive set of high-fidelity graphics processing unit (GPU) accelerated direct numerical simulations (DNS) of channel flow, from which averaged solutions will be obtained and analysed directly.
1.4 Related work
The notion of a small-amplitude perturbation implies two flows are considered, one of which is designated a base flow, and the other as a sum of the base flow and the small-amplitude perturbation. Within this context, the base flow is often considered to be either an evolving time-dependent turbulent flow field, or an averaged flow field.
Analysis of small-amplitude perturbations to time-dependent turbulent base flows usually involves calculation of Lyapunov exponents, characterising the growth rate of the difference between the base flow and a small variation thereof. Recent studies in this area include e.g. Nikitin (Reference Nikitin2018). When flow is turbulent, small-amplitude perturbations defined in this way usually grow very quickly and then saturate at a finite amplitude, becoming in effect the difference between two unrelated realisations of the same turbulent state. Such small-amplitude perturbations are not considered in the present study.
Analysis of small-amplitude perturbations to averaged base flows began with the seminal work of Malkus (Reference Malkus1956), who attempted to build a theory of turbulence based on an assumption that average velocity profiles are marginally stable with respect to infinitesimal perturbations as described by the linearised Navier–Stokes equations, whilst at the same time maximising energy dissipation rate. It was later shown that this assumption is not true (Reynolds & Tiederman Reference Reynolds and Tiederman1967). However, the approach inspired further lines of research, including those motivated by the idea that patterns, also called organised structures, observed in developed turbulent flows, could be explained by studying instabilities of the averaged base flow. Indeed, patterns in a finite-amplitude solution that evolved from a small-amplitude random perturbation are sometimes similar to patterns of the fastest growing infinitesimal disturbance. This is often the case for free-shear turbulent flows, which are strongly affected by the inviscid instability of the inflectional average flow profile (Gaster, Kit & Wygnanski Reference Gaster, Kit and Wygnanski1985; Roshko Reference Roshko1993), but not for near-wall turbulent flows where viscosity becomes important, since it is often impossible to find the fastest growing infinitesimal disturbance, as all disturbances eventually decay if their evolution is calculated using the molecular viscosity. It was observed, however, that transiently growing solutions of the linearised Navier–Stokes equations exhibit patterns similar to those seen in developed turbulent flows. To investigate this further, the full Navier–Stokes equations can be rewritten as linearised equations forced by nonlinear terms, and then these nonlinear terms can be modelled as statistically stationary stochastic forcing (Farrell & Ioannou Reference Farrell and Ioannou1993), so that the amplitude of the fluctuations remains time independent. The patterns of the fluctuating motion are then a result of the filtering properties of the linearised Navier–Stokes operator i.e. its selectivity in amplifying or suppressing particular patterns. These filtering, or selectivity, properties can be studied directly using techniques known as input–output analysis, as well as indirectly by considering the pseudospectra of the operator (Trefethen et al. Reference Trefethen, Trefethen, Reddy and Driscoll1993) or optimal perturbations with maximum transient growth (Butler & Farrell Reference Butler and Farrell1993). The development of this philosophy proved fruitful, with results including elucidation of how streak spacing depends on wall distance (Chernyshenko & Baig Reference Chernyshenko and Baig2005), how turbulent drag reduction due to spanwise wall oscillations depends on the frequency of the oscillations (Moarref & Jovanović Reference Moarref and Jovanović2012), how the angle of near-wall streaks depends on time in flows with drag reduction caused by wall oscillations (Blesbois et al. Reference Blesbois, Chernyshenko, Touber and Leschziner2013) and how drag reduction by in-plane wavy motion of the wall depends qualitatively (although not quantitatively) on the frequency and streamwise wavenumber of this motion (Duque-Daza et al. Reference Duque-Daza, Baig, Lockerby, Chernyshenko and Davies2012). Further progress, during which the above-described paradigm became known as a resolvent framework, was made when nonlinear effects in the form of triadic interactions were considered (see the review by McKeon (Reference McKeon2017)). Another way of including nonlinear effects was proposed via a statistical state dynamics approach, in which they are restricted to the interaction of the streamwise average flow and perturbations (see the review by Farrell, Gayme & Ioannou (Reference Farrell, Gayme and Ioannou2017)). The above references serve as an entry point into this thriving area of research. However, we note that it is only indirectly related to the problem considered in the present study.
An alternative line of research stemming from the seminal work of Malkus (Reference Malkus1956) has focused on the behaviour of averaged small-amplitude perturbations to averaged base flows. This is directly related to the problem considered in the present study. Following the observation that average turbulent flow profiles are stable with a laminar viscosity, Hussain & Reynolds (Reference Hussain and Reynolds1970) introduced the now widely accepted triple decomposition, leading to the unclosed system (1.18). Importantly, it remains unclosed even after linearisation under the assumption of a small coherent component. Davis (Reference Davis1974) investigated deriving turbulent closures for averaged small-amplitude perturbations directly from the Navier–Stokes equations, and Gritsun & Branstator (Reference Gritsun and Branstator2007) utilised the general fluctuation-dissipation theorem to gain additional insight. However, a full theoretical solution for the evolution of averaged small-amplitude perturbations is yet to be found. This leaves only three routes for further progress: the use of semi-empirical closures, experiments and DNS. Reynolds & Hussain (Reference Reynolds and Hussain1972) themselves used a simple eddy-viscosity closure, and achieved good agreement with associated experimental data. However, more recent studies by Sen & Veeravalli (Reference Sen and Veeravalli1998, Reference Sen and Veeravalli2000), Sen et al. (Reference Sen, Veeravalli, Carpenter and Joshi2007), which employed more complicated closures with anisotropic Reynolds stresses, produced very different results. In particular they observed growth as opposed to decay of averaged small-amplitude perturbations, although these results, too, were found to agree with their own experimental data. Such a contradiction highlights the challenges associated with making progress using semi-empirical closures and experiments. Finally, in terms of relevant DNS, Luchini, Quadrio & Zuccher (Reference Luchini, Quadrio and Zuccher2006) studied the behaviour of a time-dependent channel flow subject to an impulse force, and more recently Russo & Luchini (Reference Russo and Luchini2016) investigated a time-independent channel flow, where small perturbations were maintained by a constant body force. In the later study DNS results were found to disagree with those obtained using a turbulent closure, highlighting the fundamental difficulty of identifying the correct closure.
2 Methodology
2.1 Overview
Our approach was based on performing ensembles of turbulent channel flow DNS in a finite channel. Specifically, ensembles of statistically independent snapshots of a fully developed turbulent channel flow were modified with either anti-symmetric or symmetric net-zero mass flux perturbations to their streamwise velocity, that depended solely on the wall-normal direction. The evolution of the ensemble- and wall-parallel averages of these perturbations were then analysed, and as the averaged perturbations became small their slowest-decaying anti-symmetric and symmetric eigenmodes were identified and extracted.
It was assumed that the averaged perturbations exhibit an initial nonlinear transient, followed by a linear decay phase as their amplitude becomes small. In this linear phase, it was further assumed that averaged perturbations can be represented as a sum of eigenmodes, each decaying at different rates, such that eventually after some time
 $t_{s}$
the slowest-decaying eigenmode dominates. It is clear that in order to identify this slowest-decaying eigenmode one must study the long-time behaviour of the averaged perturbations when
$t_{s}$
the slowest-decaying eigenmode dominates. It is clear that in order to identify this slowest-decaying eigenmode one must study the long-time behaviour of the averaged perturbations when
 $t>t_{s}$
. However, this poses a challenge. Specifically, the averaged perturbations will inherently include averaging errors, which fluctuate irregularly as a function of time, but remain finite. Hence after some time
$t>t_{s}$
. However, this poses a challenge. Specifically, the averaged perturbations will inherently include averaging errors, which fluctuate irregularly as a function of time, but remain finite. Hence after some time
 $t_{e}$
they are of the same order as the averaged perturbation. If the fluctuations are large enough such that
$t_{e}$
they are of the same order as the averaged perturbation. If the fluctuations are large enough such that
 $t_{e}<t_{s}$
i.e. the averaging errors dominate the solution before only a single slowest-decaying eigenmode dominates, then it will be impossible to identify such a slowest-decaying eigenmode, even if it exists. The averaging errors can be reduced by averaging over more data. Hence, to overcome this challenge the ensemble of turbulent channel flows must be made large; such that
$t_{e}<t_{s}$
i.e. the averaging errors dominate the solution before only a single slowest-decaying eigenmode dominates, then it will be impossible to identify such a slowest-decaying eigenmode, even if it exists. The averaging errors can be reduced by averaging over more data. Hence, to overcome this challenge the ensemble of turbulent channel flows must be made large; such that
 $t_{e}\gg t_{s}$
. As will be shown, this requires a significant number of DNS to be undertaken, and indeed the approach has only recently become feasible with the emergence of high-fidelity GPU accelerated solvers.
$t_{e}\gg t_{s}$
. As will be shown, this requires a significant number of DNS to be undertaken, and indeed the approach has only recently become feasible with the emergence of high-fidelity GPU accelerated solvers.
The solver used to undertake the DNS here is described in § 2.2, the set-up for a single channel is described in § 2.3, the ensemble and averaging approach is described in § 2.4 and finally the procedure for identifying the slowest-decaying eigenmode is described in § 2.5.
2.2 Solver
All DNS were undertaken using PyFR (Witherden, Farrington & Vincent Reference Witherden, Farrington and Vincent2014; Witherden, Vermeire & Vincent Reference Witherden, Vermeire and Vincent2015), which is based on the high-order flux reconstruction method of Huynh (Reference Huynh2007), and can efficiently leverage the capabilities of modern massively parallel GPU platforms (Vincent et al.
Reference Vincent, Witherden, Vermeire, Park and Iyer2016). The compressible Navier–Stokes equations were solved at a Mach number of
 $0.1$
to approximate incompressible conditions. A Rusanov Riemann solver was employed to calculate the inter-element fluxes, an explicit RK45[2R+] scheme (Kennedy, Carpenter & Lewis Reference Kennedy, Carpenter and Lewis2000) was used to advance the solution in time and all runs were performed using double precision arithmetic. Specifically, a patched version of commit ebf386bf4f30e9caaf1cbe8546169f6f200875a1 to the PyFR Git repository (e.g. https://github.com/vincentlab/PyFR) was employed. The patch, and the full version of the code, are provided as electronic supplementary material, available at https://doi.org/10.1017/jfm.2019.520.
$0.1$
to approximate incompressible conditions. A Rusanov Riemann solver was employed to calculate the inter-element fluxes, an explicit RK45[2R+] scheme (Kennedy, Carpenter & Lewis Reference Kennedy, Carpenter and Lewis2000) was used to advance the solution in time and all runs were performed using double precision arithmetic. Specifically, a patched version of commit ebf386bf4f30e9caaf1cbe8546169f6f200875a1 to the PyFR Git repository (e.g. https://github.com/vincentlab/PyFR) was employed. The patch, and the full version of the code, are provided as electronic supplementary material, available at https://doi.org/10.1017/jfm.2019.520.
2.3 Set-up
A schematic of the computational domain is shown in figure 1. It has a length of
 $8\unicode[STIX]{x03C0}$
in the
$8\unicode[STIX]{x03C0}$
in the
 $x$
-direction, a height of
$x$
-direction, a height of
 $2$
in the
$2$
in the
 $y$
-direction and a width of
$y$
-direction and a width of
 $4\unicode[STIX]{x03C0}$
in the
$4\unicode[STIX]{x03C0}$
in the
 $z$
-direction. The origin is located at the centre of the domain. Periodic boundary conditions were applied in the
$z$
-direction. The origin is located at the centre of the domain. Periodic boundary conditions were applied in the
 $x$
- and
$x$
- and
 $z$
-directions, and an adiabatic no-slip condition was applied at
$z$
-directions, and an adiabatic no-slip condition was applied at
 $y=\pm 1$
. Flow was driven through the domain via a volumetric momentum source, coupled with a feedback controller to ensure a constant bulk velocity of
$y=\pm 1$
. Flow was driven through the domain via a volumetric momentum source, coupled with a feedback controller to ensure a constant bulk velocity of
 $1$
in the
$1$
in the
 $x$
-direction. The viscosity was set to achieve a target friction Reynolds number of
$x$
-direction. The viscosity was set to achieve a target friction Reynolds number of
 $Re_{\unicode[STIX]{x1D70F}}=180$
, which corresponds to a bulk Reynolds number based on the bulk velocity and channel half-height of
$Re_{\unicode[STIX]{x1D70F}}=180$
, which corresponds to a bulk Reynolds number based on the bulk velocity and channel half-height of
 $Re=2767$
. Time units were based on the bulk velocity and channel half-height.
$Re=2767$
. Time units were based on the bulk velocity and channel half-height.

Figure 1. Schematic of channel domain.
The domain was meshed with a structured grid of
 $62\times 19\times 60$
hexahedral elements along the
$62\times 19\times 60$
hexahedral elements along the
 $x$
-,
$x$
-,
 $y$
- and
$y$
- and
 $z$
-directions respectively. The mesh was uniform in the
$z$
-directions respectively. The mesh was uniform in the
 $x$
- and
$x$
- and
 $z$
-directions, but non-uniform in the
$z$
-directions, but non-uniform in the
 $y$
direction, with resolution increased towards the channel walls. The flow solution within each element was represented using a fourth-order polynomial. Mesh independence, and comparisons with published direct numerical simulation data, are shown in appendix A and appendix B, respectively. The mesh is provided as electronic supplementary material.
$y$
direction, with resolution increased towards the channel walls. The flow solution within each element was represented using a fourth-order polynomial. Mesh independence, and comparisons with published direct numerical simulation data, are shown in appendix A and appendix B, respectively. The mesh is provided as electronic supplementary material.
2.4 Ensembles and averages
Consider an ensemble
 $\unicode[STIX]{x1D6F1}$
of statistically independent snapshots of a fully developed channel flow solution, obtained in the domain defined in § 2.3. The
$\unicode[STIX]{x1D6F1}$
of statistically independent snapshots of a fully developed channel flow solution, obtained in the domain defined in § 2.3. The
 $x$
-velocities
$x$
-velocities
 $u(x,y,z)_{e}$
from each instance
$u(x,y,z)_{e}$
from each instance
 $e$
of
$e$
of
 $\unicode[STIX]{x1D6F1}$
can be averaged as follows to obtain
$\unicode[STIX]{x1D6F1}$
can be averaged as follows to obtain
 $$\begin{eqnarray}\displaystyle \overline{U}(y)={\displaystyle \frac{1}{N\times 8\unicode[STIX]{x03C0}\times 4\unicode[STIX]{x03C0}}}\mathop{\sum }_{e=0}^{N}\int _{-4\unicode[STIX]{x03C0}}^{4\unicode[STIX]{x03C0}}\int _{-2\unicode[STIX]{x03C0}}^{2\unicode[STIX]{x03C0}}u(x,y,z)_{e}\,\text{d}x\,\text{d}z, & & \displaystyle\end{eqnarray}$$
which in the limit
 $N\rightarrow \infty$
recovers the exact averaged
$N\rightarrow \infty$
recovers the exact averaged
 $x$
-velocity of the fully developed base flow. In the present study
$x$
-velocity of the fully developed base flow. In the present study
 $\overline{U}(y)$
was calculated using
$\overline{U}(y)$
was calculated using
 $N=768$
snapshots. These were obtained by running a series of independent statistically stationary channel flow simulations, from which solutions were extracted and stored every
$N=768$
snapshots. These were obtained by running a series of independent statistically stationary channel flow simulations, from which solutions were extracted and stored every
 $4$
time units.
$4$
time units.
Now consider that each snapshot in
 $\unicode[STIX]{x1D6F1}$
is perturbed with either an anti-symmetric function
$\unicode[STIX]{x1D6F1}$
is perturbed with either an anti-symmetric function
 $$\begin{eqnarray}\displaystyle \bar{u}_{a\mathit{IN}}^{\prime }(y)=0.3\sin (\unicode[STIX]{x03C0}y), & & \displaystyle\end{eqnarray}$$
to create an ensemble
 $\unicode[STIX]{x1D6F1}_{a}$
of initial conditions with a purely anti-symmetric initial perturbation, or a symmetric function
$\unicode[STIX]{x1D6F1}_{a}$
of initial conditions with a purely anti-symmetric initial perturbation, or a symmetric function
 $$\begin{eqnarray}\displaystyle \bar{u}_{s\mathit{IN}}^{\prime }(y)=(0.3-0.3297y^{2})\cos (3\unicode[STIX]{x03C0}y/2), & & \displaystyle\end{eqnarray}$$
to create an ensemble
 $\unicode[STIX]{x1D6F1}_{s}$
of initial conditions with a purely symmetric initial perturbation, where we note that both
$\unicode[STIX]{x1D6F1}_{s}$
of initial conditions with a purely symmetric initial perturbation, where we note that both
 $\bar{u}_{a\mathit{IN}}^{\prime }(y)$
and
$\bar{u}_{a\mathit{IN}}^{\prime }(y)$
and
 $\bar{u}_{s\mathit{IN}}^{\prime }(y)$
have net-zero mass flux, depend solely on the wall-normal direction, are zero at the walls, but are otherwise arbitrary.
$\bar{u}_{s\mathit{IN}}^{\prime }(y)$
have net-zero mass flux, depend solely on the wall-normal direction, are zero at the walls, but are otherwise arbitrary.
Finally consider restarting new simulations at
 $t=0$
from the initial conditions in each ensemble
$t=0$
from the initial conditions in each ensemble
 $\unicode[STIX]{x1D6F1}_{a/s}$
. The resulting
$\unicode[STIX]{x1D6F1}_{a/s}$
. The resulting
 $x$
-velocities
$x$
-velocities
 $u_{a/s}(x,y,z,t)_{e}$
obtained from each instance
$u_{a/s}(x,y,z,t)_{e}$
obtained from each instance
 $e$
of
$e$
of
 $\unicode[STIX]{x1D6F1}_{a/s}$
can be recorded, and their perturbations from the fully developed base flow
$\unicode[STIX]{x1D6F1}_{a/s}$
can be recorded, and their perturbations from the fully developed base flow
 $\overline{U}(y)$
can be averaged as follows to obtain
$\overline{U}(y)$
can be averaged as follows to obtain
 $$\begin{eqnarray}\displaystyle \bar{u}_{a/s}^{\prime }(y,t)={\displaystyle \frac{1}{N\times 8\unicode[STIX]{x03C0}\times 4\unicode[STIX]{x03C0}}}\mathop{\sum }_{e=0}^{N}\int _{-4\unicode[STIX]{x03C0}}^{4\unicode[STIX]{x03C0}}\int _{-2\unicode[STIX]{x03C0}}^{2\unicode[STIX]{x03C0}}u_{a/s}(x,y,z,t)_{e}-\overline{U}(y)\,\text{d}x\,\text{d}z, & & \displaystyle\end{eqnarray}$$
which in the limit
 $N\rightarrow \infty$
recovers the exact averaged
$N\rightarrow \infty$
recovers the exact averaged
 $x$
-velocity perturbation after a purely anti-symmetric/symmetric initial perturbation. In the present study
$x$
-velocity perturbation after a purely anti-symmetric/symmetric initial perturbation. In the present study
 $\bar{u}_{a/s}^{\prime }(y,t)$
were each calculated using simulation results from
$\bar{u}_{a/s}^{\prime }(y,t)$
were each calculated using simulation results from
 $N=768$
initial conditions.
$N=768$
initial conditions.
It will be demonstrated a posteriori that use of
 $N=768$
snapshots to calculate
$N=768$
snapshots to calculate
 $\overline{U}(y)$
, and use of simulation results from
$\overline{U}(y)$
, and use of simulation results from
 $N=768$
initial conditions to calculate
$N=768$
initial conditions to calculate
 $\bar{u}_{a/s}^{\prime }(y,t)$
, is sufficient to suppress averaging errors to the extent that single and hence slowest-decaying anti-symmetric/symmetric eigenmodes can be identified.
$\bar{u}_{a/s}^{\prime }(y,t)$
, is sufficient to suppress averaging errors to the extent that single and hence slowest-decaying anti-symmetric/symmetric eigenmodes can be identified.
2.5 Identification of the slowest-decaying eigenmodes
We sought to identify the eigenvalue
 $\unicode[STIX]{x1D706}_{a}$
and eigenfunction
$\unicode[STIX]{x1D706}_{a}$
and eigenfunction
 $u_{a}(y)$
associated with the slowest-decaying anti-symmetric eigenmode by studying
$u_{a}(y)$
associated with the slowest-decaying anti-symmetric eigenmode by studying
 $\bar{u}_{a}^{\prime }(y,t)$
, since it was generated from a purely anti-symmetric initial perturbation. Similarly, we sought to identify the eigenvalue
$\bar{u}_{a}^{\prime }(y,t)$
, since it was generated from a purely anti-symmetric initial perturbation. Similarly, we sought to identify the eigenvalue
 $\unicode[STIX]{x1D706}_{s}$
and eigenfunction
$\unicode[STIX]{x1D706}_{s}$
and eigenfunction
 $u_{s}(y)$
associated with the slowest-decaying symmetric eigenmode by studying
$u_{s}(y)$
associated with the slowest-decaying symmetric eigenmode by studying
 $\bar{u}_{s}^{\prime }(y,t)$
, since it was generated from a purely symmetric initial perturbation. To begin, the anti-symmetric component of
$\bar{u}_{s}^{\prime }(y,t)$
, since it was generated from a purely symmetric initial perturbation. To begin, the anti-symmetric component of
 $\bar{u}_{a}^{\prime }(y,t)$
, denoted
$\bar{u}_{a}^{\prime }(y,t)$
, denoted
 $\bar{u}_{aa}^{\prime }(y,t)$
, was extracted. This filtered out any symmetric components possibly generated during the nonlinear transient, and thus facilitated identification of the slowest-decaying anti-symmetric eigenmode. Similarly the symmetric component of
$\bar{u}_{aa}^{\prime }(y,t)$
, was extracted. This filtered out any symmetric components possibly generated during the nonlinear transient, and thus facilitated identification of the slowest-decaying anti-symmetric eigenmode. Similarly the symmetric component of
 $\bar{u}_{s}^{\prime }(y,t)$
, denoted
$\bar{u}_{s}^{\prime }(y,t)$
, denoted
 $\bar{u}_{ss}^{\prime }(y,t)$
, was extracted. This filtered out any anti-symmetric components possibly generated during the nonlinear transient, and thus facilitated identification of the slowest-decaying symmetric eigenmode. Subsequently, a single anti-symmetric/symmetric eigenmode was fitted to a series of time-windowed sections of
$\bar{u}_{ss}^{\prime }(y,t)$
, was extracted. This filtered out any anti-symmetric components possibly generated during the nonlinear transient, and thus facilitated identification of the slowest-decaying symmetric eigenmode. Subsequently, a single anti-symmetric/symmetric eigenmode was fitted to a series of time-windowed sections of
 $\bar{u}_{aa/ss}^{\prime }(y,t)$
, with a view to identifying if sections of
$\bar{u}_{aa/ss}^{\prime }(y,t)$
, with a view to identifying if sections of
 $\bar{u}_{aa/ss}^{\prime }(y,t)$
existed after the nonlinear transient phase, and after all but one of the eigenmodes had decayed, but before averaging errors became significant, where it could be well approximated by a single, and hence slowest-decaying anti-symmetric/symmetric eigenmode. Specifically, fitting was attempted in a series of windows
$\bar{u}_{aa/ss}^{\prime }(y,t)$
existed after the nonlinear transient phase, and after all but one of the eigenmodes had decayed, but before averaging errors became significant, where it could be well approximated by a single, and hence slowest-decaying anti-symmetric/symmetric eigenmode. Specifically, fitting was attempted in a series of windows
 $t\in [t^{\ast },t^{\ast }+\unicode[STIX]{x0394}t^{\ast }]$
, for an equispaced distribution of window start times
$t\in [t^{\ast },t^{\ast }+\unicode[STIX]{x0394}t^{\ast }]$
, for an equispaced distribution of window start times
 $t^{\ast }$
in the range
$t^{\ast }$
in the range
 $0$
to
$0$
to
 $120$
, with candidate eigenvalues
$120$
, with candidate eigenvalues
 $\unicode[STIX]{x1D706}_{a/s}^{\ast }(t^{\ast })$
and ‘shifted’ candidate eigenfunctions
$\unicode[STIX]{x1D706}_{a/s}^{\ast }(t^{\ast })$
and ‘shifted’ candidate eigenfunctions
 $\hat{u} _{a/s}^{\ast }(y,t^{\ast })$
associated with a single slowest-decaying anti-symmetric/symmetric eigenmode identified as solutions to the optimisation problem
$\hat{u} _{a/s}^{\ast }(y,t^{\ast })$
associated with a single slowest-decaying anti-symmetric/symmetric eigenmode identified as solutions to the optimisation problem
 $$\begin{eqnarray}\displaystyle & \displaystyle \unicode[STIX]{x1D706}_{a/s}^{\ast }(t^{\ast }),\hat{u} _{a/s}^{\ast }(y,t^{\ast })=\mathop{\text{argmin}}_{\unicode[STIX]{x1D706},\hat{u} (y)}\unicode[STIX]{x1D716}_{a/s}(t^{\ast }), & \displaystyle\end{eqnarray}$$
 $$\begin{eqnarray}\displaystyle & \displaystyle \unicode[STIX]{x1D716}_{a/s}(t^{\ast })=\sqrt{\int _{-1}^{1}\int _{t^{\ast }}^{t^{\ast }+\unicode[STIX]{x0394}t^{\ast }}(\text{Re}\{\hat{u} (y)\text{e}^{\unicode[STIX]{x1D706}(t-t^{\ast })}\}-\bar{u}_{aa/ss}^{\prime }(y,t))^{2}\,\text{d}t\,\text{d}y}, & \displaystyle\end{eqnarray}$$
and associated relative errors
 $R_{a/s}^{\ast }(t^{\ast })$
obtained as
$R_{a/s}^{\ast }(t^{\ast })$
obtained as
 $$\begin{eqnarray}\displaystyle R_{a/s}^{\ast }(t^{\ast })=\displaystyle \frac{\displaystyle \min _{\unicode[STIX]{x1D706},\hat{u} (y)}\unicode[STIX]{x1D716}_{a/s}(t^{\ast })}{\displaystyle \sqrt{\int _{-1}^{1}\int _{t^{\ast }}^{t^{\ast }+\unicode[STIX]{x0394}t^{\ast }}\bar{u}_{aa/ss}^{\prime }(y,t)^{2}\,\text{d}t\,\text{d}y}}, & & \displaystyle\end{eqnarray}$$
where the ‘shifted’ candidate eigenfunctions were represented by 95 degrees of freedom, using the same piecewise polynomial discretisation as for the DNS simulations, and minimisation was performed using the Levenberg–Marquardt algorithm via the LMFIT package (Newville et al.
Reference Newville, Stensitzki, Allen and Ingargiola2014). Note that for technical reasons the time origin of the eigenmode in (2.6) was shifted by
 $t^{\ast }$
prior to fitting, hence why
$t^{\ast }$
prior to fitting, hence why
 $\hat{u} _{a/s}^{\ast }(y,t^{\ast })$
are referred to as ‘shifted’ candidate eigenfunctions. Once obtained, these can be ‘unshifted’ to obtain candidate eigenfunctions
$\hat{u} _{a/s}^{\ast }(y,t^{\ast })$
are referred to as ‘shifted’ candidate eigenfunctions. Once obtained, these can be ‘unshifted’ to obtain candidate eigenfunctions
 $$\begin{eqnarray}\displaystyle u_{a/s}^{\ast }(y,t^{\ast })=\text{e}^{-\unicode[STIX]{x1D706}_{a/s}t^{\ast }}\hat{u} _{a/s}^{\ast }(y,t^{\ast }), & & \displaystyle\end{eqnarray}$$
that can be directly compared.
If a single slowest-decaying anti-symmetric/symmetric eigenmode is identifiable then there should exist a range of
 $t^{\ast }$
where:
$t^{\ast }$
where:
(i) The candidate eigenvalues
 $\unicode[STIX]{x1D706}_{a/s}^{\ast }(t^{\ast })$
are approximately independent of
$t^{\ast }$
, with a value that can be ascribed to the true eigenvalue
$\unicode[STIX]{x1D706}_{a/s}$
.
$\unicode[STIX]{x1D706}_{a/s}^{\ast }(t^{\ast })$
are approximately independent of
$t^{\ast }$
, with a value that can be ascribed to the true eigenvalue
$\unicode[STIX]{x1D706}_{a/s}$
.(ii) The relative errors
$R_{a/s}^{\ast }(t^{\ast })$
are small.(iii) The candidate eigenfunctions
$u_{a/s}^{\ast }(y,t^{\ast })$
are approximately independent of
$t^{\ast }$
, with a form that can be ascribed to the true eigenfunction
$u_{a/s}(y)$
.


We note that, strictly, the above approach will identify slowest-decaying anti-symmetric/symmetric eigenmodes excited by the initial perturbations (2.2) and (2.3), respectively. It is highly likely that these are also indeed the slowest-decaying anti-symmetric/symmetric eigenmodes per se. However, to confirm, it would be necessary to repeat the procedure using data from additional ensembles with various initial perturbations, and check that the eigenmodes all agree. Given the cost associated with DNS, such a check was not feasible here.
Finally, we comment that by applying a control volume approach in the normal way to the full Navier–Stokes (1.1) and continuity equations (1.2), averaging over the
 $x$
- and
$x$
- and
 $z$
-directions, and using the fact that the bulk velocity is constant, one can obtain an expression for the averaged pressure gradient perturbation associated with each eigenmode
$z$
-directions, and using the fact that the bulk velocity is constant, one can obtain an expression for the averaged pressure gradient perturbation associated with each eigenmode
 $$\begin{eqnarray}\displaystyle {\displaystyle \frac{\text{d}\bar{p}_{a/s}}{\text{d}x}}(t)=\text{Re}\left\{{\displaystyle \frac{\text{e}^{\unicode[STIX]{x1D706}_{a/s}t}}{2Re}}\left.\displaystyle \frac{\text{d}u_{a/s}(y)}{\text{d}y}\right|_{-1}^{+1}\right\}. & & \displaystyle\end{eqnarray}$$
3 Results
3.1 Base flow
Figure 2 plots the averaged
 $x$
-velocity of the unperturbed base flow
$x$
-velocity of the unperturbed base flow
 $\overline{U}(y)$
, along with an analytical fit
$\overline{U}(y)$
, along with an analytical fit
 $$\begin{eqnarray}\displaystyle \overline{U}_{b}(y)=(1-y)(1+y)\left({\displaystyle \frac{0.36y^{4}-1.37y^{2}+1.16}{0.90y^{4}-1.87y^{2}+1}}\right), & & \displaystyle\end{eqnarray}$$
which was obtained by nonlinear least squares fitting of a rational polynomial to
 $\overline{U}(y)$
.
$\overline{U}(y)$
.

Figure 2. Plots of
 $\overline{U}(y)$
, the averaged
$\overline{U}(y)$
, the averaged
 $x$
-velocity of the unperturbed base flow (black line), and
$x$
-velocity of the unperturbed base flow (black line), and
 $\overline{U}_{b}(y)$
, obtained by nonlinear least squares fitting of a rational polynomial to
$\overline{U}_{b}(y)$
, obtained by nonlinear least squares fitting of a rational polynomial to
 $\overline{U}(y)$
(dashed white line).
$\overline{U}(y)$
(dashed white line).
3.2 Slowest-decaying anti-symmetric eigenmode
Figure 3 plots
 $\bar{u}_{aa}^{\prime }(0.76,t)$
, the anti-symmetric component of the averaged
$\bar{u}_{aa}^{\prime }(0.76,t)$
, the anti-symmetric component of the averaged
 $x$
-velocity perturbation, after a purely anti-symmetric initial perturbation, at
$x$
-velocity perturbation, after a purely anti-symmetric initial perturbation, at
 $y=0.76$
. The evolution is non-oscillatory, which suggests that the slowest-decaying anti-symmetric eigenmode is real valued. Therefore, we assume that the corresponding eigenvalue
$y=0.76$
. The evolution is non-oscillatory, which suggests that the slowest-decaying anti-symmetric eigenmode is real valued. Therefore, we assume that the corresponding eigenvalue
 $\unicode[STIX]{x1D706}_{a}$
and eigenfunction
$\unicode[STIX]{x1D706}_{a}$
and eigenfunction
 $u_{a}(y)$
are real valued before proceeding with the analysis.
$u_{a}(y)$
are real valued before proceeding with the analysis.

Figure 3. Plot of
 $\bar{u}_{aa}^{\prime }(0.76,t)$
, the anti-symmetric component of the averaged
$\bar{u}_{aa}^{\prime }(0.76,t)$
, the anti-symmetric component of the averaged
 $x$
-velocity perturbation, after a purely anti-symmetric initial perturbation, at
$x$
-velocity perturbation, after a purely anti-symmetric initial perturbation, at
 $y=0.76$
.
$y=0.76$
.
Figure 4 plots candidate eigenvalues
 $\unicode[STIX]{x1D706}_{a}^{\ast }(t^{\ast })$
and relative fitting errors
$\unicode[STIX]{x1D706}_{a}^{\ast }(t^{\ast })$
and relative fitting errors
 $R_{a}^{\ast }(t^{\ast })$
as a function of window start time
$R_{a}^{\ast }(t^{\ast })$
as a function of window start time
 $t^{\ast }$
, obtained using the procedure outlined in § 2.5 with a window size of
$t^{\ast }$
, obtained using the procedure outlined in § 2.5 with a window size of
 $\unicode[STIX]{x0394}t^{\ast }=30$
. Within
$\unicode[STIX]{x0394}t^{\ast }=30$
. Within
 $30\leqslant t^{\ast }\leqslant 75$
the candidate eigenvalues
$30\leqslant t^{\ast }\leqslant 75$
the candidate eigenvalues
 $\unicode[STIX]{x1D706}_{a}^{\ast }(t^{\ast })$
are approximately constant and the relative fitting errors
$\unicode[STIX]{x1D706}_{a}^{\ast }(t^{\ast })$
are approximately constant and the relative fitting errors
 $R_{a}^{\ast }(t^{\ast })$
are small. Figure 5 plots
$R_{a}^{\ast }(t^{\ast })$
are small. Figure 5 plots
 $$\begin{eqnarray}\displaystyle \tilde{u} _{a}^{\ast }(y)={\displaystyle \frac{1}{4}}\mathop{\sum }_{n=0}^{3}{\displaystyle \frac{u_{a}^{\ast }(y,30+15n)}{\text{max}_{y}\{u_{a}^{\ast }(y,30+15n)\}}}, & & \displaystyle\end{eqnarray}$$
the average of four normalised candidate eigenfunctions within
 $30\leqslant t^{\ast }\leqslant 75$
, obtained using the procedure outlined in § 2.5, and a window size of
$30\leqslant t^{\ast }\leqslant 75$
, obtained using the procedure outlined in § 2.5, and a window size of
 $\unicode[STIX]{x0394}t^{\ast }=30$
. Figure 5 also plots their associated standard deviation, which is seen to be small.
$\unicode[STIX]{x0394}t^{\ast }=30$
. Figure 5 also plots their associated standard deviation, which is seen to be small.

Figure 4. Plots of candidate eigenvalues
 $\unicode[STIX]{x1D706}_{a}^{\ast }(t^{\ast })$
and relative fitting errors
$\unicode[STIX]{x1D706}_{a}^{\ast }(t^{\ast })$
and relative fitting errors
 $R_{a}^{\ast }(t^{\ast })$
as a function of window start time
$R_{a}^{\ast }(t^{\ast })$
as a function of window start time
 $t^{\ast }$
, obtained using the procedure outlined in § 2.5 with a window size of
$t^{\ast }$
, obtained using the procedure outlined in § 2.5 with a window size of
 $\unicode[STIX]{x0394}t^{\ast }=30$
.
$\unicode[STIX]{x0394}t^{\ast }=30$
.

Figure 5. Plots of
 $\tilde{u} _{a}^{\ast }(y)$
, the average of four normalised candidate eigenfunctions within
$\tilde{u} _{a}^{\ast }(y)$
, the average of four normalised candidate eigenfunctions within
 $30\leqslant t^{\ast }\leqslant 75$
, obtained using the procedure outlined in § 2.5, and a window size of
$30\leqslant t^{\ast }\leqslant 75$
, obtained using the procedure outlined in § 2.5, and a window size of
 $\unicode[STIX]{x0394}t^{\ast }=30$
(black line), along with their standard deviation (grey shaded region), and
$\unicode[STIX]{x0394}t^{\ast }=30$
(black line), along with their standard deviation (grey shaded region), and
 $u_{a}(y)$
, obtained by least squares fitting of a rational polynomial to
$u_{a}(y)$
, obtained by least squares fitting of a rational polynomial to
 $\tilde{u} _{a}^{\ast }(y)$
(dashed white line). Note that
$\tilde{u} _{a}^{\ast }(y)$
(dashed white line). Note that
 $\tilde{u} _{a}^{\ast }(y)$
(black line) and
$\tilde{u} _{a}^{\ast }(y)$
(black line) and
 $u_{a}(y)$
(dashed white line) are almost exactly superposed.
$u_{a}(y)$
(dashed white line) are almost exactly superposed.
We therefore conclude that within the interval
 $30\leqslant t^{\ast }\leqslant 75$
the anti-symmetric component of the averaged
$30\leqslant t^{\ast }\leqslant 75$
the anti-symmetric component of the averaged
 $x$
-velocity perturbation after a purely anti-symmetric initial perturbation can be described by a single, and hence slowest-decaying, anti-symmetric eigenmode. The associated eigenvalue can be approximated as
$x$
-velocity perturbation after a purely anti-symmetric initial perturbation can be described by a single, and hence slowest-decaying, anti-symmetric eigenmode. The associated eigenvalue can be approximated as
 $$\begin{eqnarray}\displaystyle \unicode[STIX]{x1D706}_{a}=-0.042, & & \displaystyle\end{eqnarray}$$
obtained from the average of
 $\unicode[STIX]{x1D706}_{a}^{\ast }(t^{\ast })$
within the interval
$\unicode[STIX]{x1D706}_{a}^{\ast }(t^{\ast })$
within the interval
 $30\leqslant t^{\ast }\leqslant 75$
, which has a standard deviation of
$30\leqslant t^{\ast }\leqslant 75$
, which has a standard deviation of
 $0.001$
. The associated eigenfunction
$0.001$
. The associated eigenfunction
 $u_{a}(y)$
can be approximated as
$u_{a}(y)$
can be approximated as
 $$\begin{eqnarray}\displaystyle u_{a}(y)=(1-y)(1+y)\left({\displaystyle \frac{-5.52y^{7}+11.81y^{5}-9.77y^{3}+3.52y}{0.50y^{4}-1.47y^{2}+1}}\right), & & \displaystyle\end{eqnarray}$$
which is also plotted in figure 5, and was obtained by nonlinear least squares fitting of a rational polynomial to
 $\tilde{u} _{a}^{\ast }(y)$
.
$\tilde{u} _{a}^{\ast }(y)$
.
As a check, figure 6 compares
 $\bar{u}_{aa}^{\prime }(y,t)$
, the anti-symmetric component of the averaged
$\bar{u}_{aa}^{\prime }(y,t)$
, the anti-symmetric component of the averaged
 $x$
-velocity perturbation after a purely anti-symmetric initial perturbation with the eigenmode
$x$
-velocity perturbation after a purely anti-symmetric initial perturbation with the eigenmode
 $C_{a}u_{a}(y)\text{e}^{\unicode[STIX]{x1D706}_{a}t}$
within
$C_{a}u_{a}(y)\text{e}^{\unicode[STIX]{x1D706}_{a}t}$
within
 $30\leqslant t\leqslant 75$
, where
$30\leqslant t\leqslant 75$
, where
 $C_{a}$
is real and depends on the initial condition, and is chosen here via a nonlinear least squares fit. The contour plots are similar, providing further confidence that a single, and hence slowest-decaying, anti-symmetric eigenmode has been identified.
$C_{a}$
is real and depends on the initial condition, and is chosen here via a nonlinear least squares fit. The contour plots are similar, providing further confidence that a single, and hence slowest-decaying, anti-symmetric eigenmode has been identified.

Figure 6. Contours of
 $\bar{u}_{aa}^{\prime }(y,t)$
, the anti-symmetric component of the averaged
$\bar{u}_{aa}^{\prime }(y,t)$
, the anti-symmetric component of the averaged
 $x$
-velocity perturbation, after a purely anti-symmetric initial perturbation (a) and the eigenmode
$x$
-velocity perturbation, after a purely anti-symmetric initial perturbation (a) and the eigenmode
 $C_{a}u_{a}(y)\text{e}^{\unicode[STIX]{x1D706}_{a}t}$
(b).
$C_{a}u_{a}(y)\text{e}^{\unicode[STIX]{x1D706}_{a}t}$
(b).
We note that the shape of the eigenfunction is similar to that of a sine curve, which is the corresponding anti-symmetric laminar solution defined by (1.10). However, the eigenvalue
 $\unicode[STIX]{x1D706}_{a}$
is found to be
$\unicode[STIX]{x1D706}_{a}$
is found to be
 $11.8$
times bigger than the analogous laminar value obtained from (1.10) with
$11.8$
times bigger than the analogous laminar value obtained from (1.10) with
 $Re=2767$
. This is in line with expectations since eddy viscosity is typically greater than molecular viscosity.
$Re=2767$
. This is in line with expectations since eddy viscosity is typically greater than molecular viscosity.
Figure 7 plots
 $\bar{u}_{as}^{\prime }(0,t)$
, the symmetric component of the averaged
$\bar{u}_{as}^{\prime }(0,t)$
, the symmetric component of the averaged
 $x$
-velocity perturbation, after a purely anti-symmetric initial perturbation, at
$x$
-velocity perturbation, after a purely anti-symmetric initial perturbation, at
 $y=0$
. We note that it is non-zero, with a maximum value that is of the same order as the square of the amplitude of
$y=0$
. We note that it is non-zero, with a maximum value that is of the same order as the square of the amplitude of
 $\bar{u}_{aa}^{\prime }(0.76,t)$
shown in figure 3, i.e. the initial purely anti-symmetric perturbation generates a symmetric component. This is in contrast to the laminar case, where an anti-symmetric perturbation will always remain purely anti-symmetric, since the governing equation for a unidirectional laminar flow is linear. It can be shown (see appendix C) that if the evolution of the averaged perturbation is governed by a symmetric linear operator, and the initial perturbation is anti-symmetric, then the averaged perturbation must remain purely anti-symmetric for all time. Our observation of the counter indicates that the full governing equations for the averaged perturbation must be nonlinear, even for a uni-directional channel flow case. Consequently, any turbulence models should remain nonlinear even for a uni-directional flow, a corollary of which is the requirement that for models employing eddy viscosity, such viscosity cannot be independent of the flow. The well-known Prandtl model, in which the eddy viscosity
$\bar{u}_{aa}^{\prime }(0.76,t)$
shown in figure 3, i.e. the initial purely anti-symmetric perturbation generates a symmetric component. This is in contrast to the laminar case, where an anti-symmetric perturbation will always remain purely anti-symmetric, since the governing equation for a unidirectional laminar flow is linear. It can be shown (see appendix C) that if the evolution of the averaged perturbation is governed by a symmetric linear operator, and the initial perturbation is anti-symmetric, then the averaged perturbation must remain purely anti-symmetric for all time. Our observation of the counter indicates that the full governing equations for the averaged perturbation must be nonlinear, even for a uni-directional channel flow case. Consequently, any turbulence models should remain nonlinear even for a uni-directional flow, a corollary of which is the requirement that for models employing eddy viscosity, such viscosity cannot be independent of the flow. The well-known Prandtl model, in which the eddy viscosity
 $$\begin{eqnarray}\displaystyle \unicode[STIX]{x1D708}_{t}=l(y){\displaystyle \frac{\text{d}(\overline{U}+\overline{u}^{\prime })}{\text{d}y}}, & & \displaystyle\end{eqnarray}$$
where
 $l(y)$
is the mixing length, satisfies this requirement. However, the assumption that
$l(y)$
is the mixing length, satisfies this requirement. However, the assumption that
 $\unicode[STIX]{x1D708}_{t}=\unicode[STIX]{x1D708}_{t}(y)$
, often used in studies of small averaged perturbations, does not. This finding is in line with results from previous studies into the response of turbulent flow to constant forcing (Russo & Luchini Reference Russo and Luchini2016; Luchini Reference Luchini2018).
$\unicode[STIX]{x1D708}_{t}=\unicode[STIX]{x1D708}_{t}(y)$
, often used in studies of small averaged perturbations, does not. This finding is in line with results from previous studies into the response of turbulent flow to constant forcing (Russo & Luchini Reference Russo and Luchini2016; Luchini Reference Luchini2018).

Figure 7. Plot of
 $\bar{u}_{as}^{\prime }(0,t)$
, the symmetric component of the averaged
$\bar{u}_{as}^{\prime }(0,t)$
, the symmetric component of the averaged
 $x$
-velocity perturbation, after a purely anti-symmetric initial perturbation, at
$x$
-velocity perturbation, after a purely anti-symmetric initial perturbation, at
 $y=0$
.
$y=0$
.
Finally, we note that in accordance with (2.9) the averaged pressure gradient perturbation associated with the anti-symmetric eigenmode is zero, since the eigenfunction
 $u_{a}(y)$
is anti-symmetric.
$u_{a}(y)$
is anti-symmetric.
3.3 Slowest-decaying symmetric eigenmode
Figure 8 plots
 $\bar{u}_{ss}^{\prime }(0,t)$
, the symmetric component of the averaged
$\bar{u}_{ss}^{\prime }(0,t)$
, the symmetric component of the averaged
 $x$
-velocity perturbation, after a purely symmetric initial perturbation, at
$x$
-velocity perturbation, after a purely symmetric initial perturbation, at
 $y=0$
. The evolution is oscillatory, which suggests that the slowest-decaying symmetric eigenmode is complex valued. Therefore, we assume that the corresponding eigenvalue
$y=0$
. The evolution is oscillatory, which suggests that the slowest-decaying symmetric eigenmode is complex valued. Therefore, we assume that the corresponding eigenvalue
 $\unicode[STIX]{x1D706}_{s}$
and eigenfunction
$\unicode[STIX]{x1D706}_{s}$
and eigenfunction
 $u_{s}(y)$
are complex valued before proceeding with the analysis.
$u_{s}(y)$
are complex valued before proceeding with the analysis.

Figure 8. Plot of
 $\bar{u}_{ss}^{\prime }(0,t)$
, the symmetric component of the averaged
$\bar{u}_{ss}^{\prime }(0,t)$
, the symmetric component of the averaged
 $x$
-velocity perturbation, after a purely symmetric initial perturbation, at
$x$
-velocity perturbation, after a purely symmetric initial perturbation, at
 $y=0$
.
$y=0$
.
Figure 9 plots the real and imaginary parts of candidate eigenvalues
 $\unicode[STIX]{x1D706}_{s}^{\ast }(t^{\ast })$
and relative fitting errors
$\unicode[STIX]{x1D706}_{s}^{\ast }(t^{\ast })$
and relative fitting errors
 $R_{s}^{\ast }(t^{\ast })$
as a function of window start time
$R_{s}^{\ast }(t^{\ast })$
as a function of window start time
 $t^{\ast }$
, obtained using the procedure outlined in § 2.5 with a window size of
$t^{\ast }$
, obtained using the procedure outlined in § 2.5 with a window size of
 $\unicode[STIX]{x0394}t^{\ast }=30$
. Within
$\unicode[STIX]{x0394}t^{\ast }=30$
. Within
 $30\leqslant t^{\ast }\leqslant 75$
the real and imaginary parts of candidate eigenvalues
$30\leqslant t^{\ast }\leqslant 75$
the real and imaginary parts of candidate eigenvalues
 $\unicode[STIX]{x1D706}_{s}^{\ast }(t^{\ast })$
are approximately constant and the relative fitting errors
$\unicode[STIX]{x1D706}_{s}^{\ast }(t^{\ast })$
are approximately constant and the relative fitting errors
 $R_{a}^{\ast }(t^{\ast })$
are small. Figure 10 plots the real and imaginary parts of
$R_{a}^{\ast }(t^{\ast })$
are small. Figure 10 plots the real and imaginary parts of
 $$\begin{eqnarray}\displaystyle \tilde{u} _{s}^{\ast }(y)={\displaystyle \frac{1}{4}}\mathop{\sum }_{n=0}^{3}{\displaystyle \frac{u_{s}^{\ast }(y,30+15n)}{|u_{s}^{\ast }(0,30+15n)|}}, & & \displaystyle\end{eqnarray}$$
the average of four normalised candidate eigenfunctions within
 $30\leqslant t^{\ast }\leqslant 75$
, obtained using the procedure outlined in § 2.5, and a window size of
$30\leqslant t^{\ast }\leqslant 75$
, obtained using the procedure outlined in § 2.5, and a window size of
 $\unicode[STIX]{x0394}t^{\ast }=30$
. Figure 10 also plots their associated standard deviations, which is seen to be small.
$\unicode[STIX]{x0394}t^{\ast }=30$
. Figure 10 also plots their associated standard deviations, which is seen to be small.

Figure 9. Plots the real and imaginary parts of candidate eigenvalues
 $\unicode[STIX]{x1D706}_{s}^{\ast }(t^{\ast })$
and relative fitting errors
$\unicode[STIX]{x1D706}_{s}^{\ast }(t^{\ast })$
and relative fitting errors
 $R_{s}^{\ast }(t^{\ast })$
as a function of window start time
$R_{s}^{\ast }(t^{\ast })$
as a function of window start time
 $t^{\ast }$
, obtained using the procedure outlined in § 2.5 with a window size of
$t^{\ast }$
, obtained using the procedure outlined in § 2.5 with a window size of
 $\unicode[STIX]{x0394}t^{\ast }=30$
.
$\unicode[STIX]{x0394}t^{\ast }=30$
.

Figure 10. Plots of the real and imaginary parts of
 $\tilde{u} _{s}^{\ast }(y)$
, the average of four normalised candidate eigenfunctions within
$\tilde{u} _{s}^{\ast }(y)$
, the average of four normalised candidate eigenfunctions within
 $30\leqslant t^{\ast }\leqslant 75$
, obtained using the procedure outlined in § 2.5, and a window size of
$30\leqslant t^{\ast }\leqslant 75$
, obtained using the procedure outlined in § 2.5, and a window size of
 $\unicode[STIX]{x0394}t^{\ast }=30$
(black lines), along with their standard deviations (grey shaded regions), and the real and imaginary parts of
$\unicode[STIX]{x0394}t^{\ast }=30$
(black lines), along with their standard deviations (grey shaded regions), and the real and imaginary parts of
 $u_{s}(y)$
, obtained by least squares fitting of rational polynomials to the real and imaginary parts of
$u_{s}(y)$
, obtained by least squares fitting of rational polynomials to the real and imaginary parts of
 $\tilde{u} _{s}^{\ast }(y)$
, respectively (dashed white lines). Note that the real and imaginary parts of
$\tilde{u} _{s}^{\ast }(y)$
, respectively (dashed white lines). Note that the real and imaginary parts of
 $\tilde{u} _{s}^{\ast }(y)$
(black lines) and the real and imaginary parts of
$\tilde{u} _{s}^{\ast }(y)$
(black lines) and the real and imaginary parts of
 $u_{s}(y)$
(dashed white lines) are almost exactly superposed.
$u_{s}(y)$
(dashed white lines) are almost exactly superposed.
We therefore conclude that within the interval
 $30\leqslant t^{\ast }\leqslant 75$
the symmetric component of the averaged
$30\leqslant t^{\ast }\leqslant 75$
the symmetric component of the averaged
 $x$
-velocity perturbation after a purely symmetric initial perturbation can be described by a single, and hence slowest-decaying, symmetric eigenmode. The associated eigenvalue can be approximated as
$x$
-velocity perturbation after a purely symmetric initial perturbation can be described by a single, and hence slowest-decaying, symmetric eigenmode. The associated eigenvalue can be approximated as
 $$\begin{eqnarray}\displaystyle \unicode[STIX]{x1D706}_{s}=-0.049-i0.069, & & \displaystyle\end{eqnarray}$$
obtained from the average of
 $\unicode[STIX]{x1D706}_{s}^{\ast }(t^{\ast })$
within the interval
$\unicode[STIX]{x1D706}_{s}^{\ast }(t^{\ast })$
within the interval
 $30\leqslant t^{\ast }\leqslant 75$
, which has a standard deviation of
$30\leqslant t^{\ast }\leqslant 75$
, which has a standard deviation of
 $0.003+i0.004$
. The real and imaginary parts of the associated eigenfunction
$0.003+i0.004$
. The real and imaginary parts of the associated eigenfunction
 $u_{s}(y)$
can be approximated as
$u_{s}(y)$
can be approximated as
 $$\begin{eqnarray}\displaystyle & \displaystyle \text{Re}\{u_{s}(y)\}=(1-y)(1+y)\left({\displaystyle \frac{-0.19y^{6}+6.20y^{4}-6.56y^{2}+0.96}{2.75y^{6}-4.23y^{4}+0.60y^{2}+1}}\right), & \displaystyle\end{eqnarray}$$
 $$\begin{eqnarray}\displaystyle & \displaystyle \text{Im}\{u_{s}(y)\}=(1-y)(1+y)\left({\displaystyle \frac{3.66y^{8}-8.72y^{6}+7.44y^{4}-1.41y^{2}-0.25}{1.64y^{6}-2.11y^{4}-0.48y^{2}+1}}\right), & \displaystyle\end{eqnarray}$$
which are also plotted in figure 10, and were obtained by nonlinear least squares fitting of rational polynomials to
 $\text{Re}\{\tilde{u} _{s}^{\ast }(y)\}$
and
$\text{Re}\{\tilde{u} _{s}^{\ast }(y)\}$
and
 $\text{Im}\{\tilde{u} _{s}^{\ast }(y)\}$
, respectively. We note that since the problem is real valued, the complex conjugate of
$\text{Im}\{\tilde{u} _{s}^{\ast }(y)\}$
, respectively. We note that since the problem is real valued, the complex conjugate of
 $\unicode[STIX]{x1D706}_{s}$
and
$\unicode[STIX]{x1D706}_{s}$
and
 $u_{s}(y)$
will also form a valid eigenmode.
$u_{s}(y)$
will also form a valid eigenmode.
As a check, figure 11 compares
 $\bar{u}_{ss}^{\prime }(y,t)$
, the symmetric component of the averaged
$\bar{u}_{ss}^{\prime }(y,t)$
, the symmetric component of the averaged
 $x$
-velocity perturbation after a purely symmetric initial perturbation with the real part of the eigenmode
$x$
-velocity perturbation after a purely symmetric initial perturbation with the real part of the eigenmode
 $\text{Re}\{C_{s}u_{s}(y)\text{e}^{\unicode[STIX]{x1D706}_{s}t}\}$
within
$\text{Re}\{C_{s}u_{s}(y)\text{e}^{\unicode[STIX]{x1D706}_{s}t}\}$
within
 $30\leqslant t\leqslant 75$
, where
$30\leqslant t\leqslant 75$
, where
 $C_{s}$
is complex and depends on the initial condition, and is chosen here via a nonlinear least squares fit. The contour plots are similar, providing further confidence that a single, and hence slowest-decaying, symmetric eigenmode has been identified.
$C_{s}$
is complex and depends on the initial condition, and is chosen here via a nonlinear least squares fit. The contour plots are similar, providing further confidence that a single, and hence slowest-decaying, symmetric eigenmode has been identified.

Figure 11. Contours of
 $\bar{u}_{ss}^{\prime }(y,t)$
, the symmetric component of the averaged
$\bar{u}_{ss}^{\prime }(y,t)$
, the symmetric component of the averaged
 $x$
-velocity perturbation after a purely symmetric initial perturbation (a) and the real part of the eigenmode
$x$
-velocity perturbation after a purely symmetric initial perturbation (a) and the real part of the eigenmode
 $\text{Re}\{C_{s}u_{s}(y)\text{e}^{\unicode[STIX]{x1D706}_{s}t}\}$
(b).
$\text{Re}\{C_{s}u_{s}(y)\text{e}^{\unicode[STIX]{x1D706}_{s}t}\}$
(b).
We note that in contrast to the corresponding symmetric laminar solution defined by (1.11), the eigenvalue and eigenfunction are complex. This implies that the corresponding linear operator cannot be self-adjoint, even in the case of a uni-directional flow. Moreover, unlike for the anti-symmetric perturbation, the shape of the eigenfunctions differ substantially between the laminar and turbulent cases. In particular, the symmetric eigenfunction has a large magnitude approximately 12 wall units from the wall, in a region where turbulent fluctuations are known to attain their maximum value. We can hypothesise that the complex eigenvalue is a result of an interplay between two physical processes, one occurring in the bulk of the flow, and another associated with turbulent fluctuations concentrated near the walls. Also, the real part of the eigenvalue
 $\text{Re}\{\unicode[STIX]{x1D706}_{s}\}$
is found to be
$\text{Re}\{\unicode[STIX]{x1D706}_{s}\}$
is found to be
 $6.72$
times bigger than the analogous laminar value obtained from (1.11) with
$6.72$
times bigger than the analogous laminar value obtained from (1.11) with
 $Re=2767$
. This is in line with expectations since eddy viscosity is typically greater than molecular viscosity.
$Re=2767$
. This is in line with expectations since eddy viscosity is typically greater than molecular viscosity.
Figure 12 plots
 $\bar{u}_{sa}^{\prime }(0.76,t)$
, the anti-symmetric component of the averaged
$\bar{u}_{sa}^{\prime }(0.76,t)$
, the anti-symmetric component of the averaged
 $x$
-velocity perturbation, after a purely symmetric initial perturbation, at
$x$
-velocity perturbation, after a purely symmetric initial perturbation, at
 $y=0.76$
. We note that it is zero i.e. the initial purely symmetric perturbation does not generate an anti-symmetric component. This is expected since the mean flow, the initial perturbation, and the boundary conditions are all symmetric.
$y=0.76$
. We note that it is zero i.e. the initial purely symmetric perturbation does not generate an anti-symmetric component. This is expected since the mean flow, the initial perturbation, and the boundary conditions are all symmetric.

Figure 12. Plot of
 $\bar{u}_{sa}^{\prime }(0.76,t)$
, the anti-symmetric component of the averaged
$\bar{u}_{sa}^{\prime }(0.76,t)$
, the anti-symmetric component of the averaged
 $x$
-velocity perturbation, after a purely symmetric initial perturbation, at
$x$
-velocity perturbation, after a purely symmetric initial perturbation, at
 $y=0.76$
.
$y=0.76$
.
Finally, we note that in accordance with (2.9) the averaged pressure gradient perturbation associated with the symmetric eigenmode is
 $$\begin{eqnarray}\displaystyle {\displaystyle \frac{\text{d}\overline{p}_{s}}{\text{d}x}}(t) & = & \displaystyle \text{Re}\{\text{e}^{\unicode[STIX]{x1D706}_{s}t}(0.00247+i0.0104)\}\nonumber\\ \displaystyle & = & \displaystyle \text{e}^{-0.049t}(0.0104\sin (0.069t)+0.00247\cos (0.069t)).\end{eqnarray}$$
4 Conclusion
Eigenmodes of averaged small-amplitude perturbations to a turbulent channel flow – which is one of the most fundamental canonical flows – have been identified for the first time via an extensive set of high-fidelity GPU accelerated DNS. Specifically, for a turbulent channel flow with
 $Re_{\unicode[STIX]{x1D70F}}=180$
and a constant bulk velocity, the slowest-decaying anti-symmetric eigenmode was found to have an eigenvalue
$Re_{\unicode[STIX]{x1D70F}}=180$
and a constant bulk velocity, the slowest-decaying anti-symmetric eigenmode was found to have an eigenvalue
 $\unicode[STIX]{x1D706}_{a}=-0.042$
and an eigenfunction
$\unicode[STIX]{x1D706}_{a}=-0.042$
and an eigenfunction
 $u_{a}(y)$
approximated by the analytical expression (3.4), and the slowest-decaying symmetric eigenmode was found to have an eigenvalue
$u_{a}(y)$
approximated by the analytical expression (3.4), and the slowest-decaying symmetric eigenmode was found to have an eigenvalue
 $\unicode[STIX]{x1D706}_{s}=-0.049-i0.069$
and an eigenfunction
$\unicode[STIX]{x1D706}_{s}=-0.049-i0.069$
and an eigenfunction
 $u_{s}(y)$
approximated by the analytical expressions (3.8) and (3.9). While the system governing averaged small-amplitude perturbations to turbulent channel flow remains unknown, the fact such eigenmodes could be extracted constitutes direct evidence that it is linear. Moreover, given
$u_{s}(y)$
approximated by the analytical expressions (3.8) and (3.9). While the system governing averaged small-amplitude perturbations to turbulent channel flow remains unknown, the fact such eigenmodes could be extracted constitutes direct evidence that it is linear. Moreover, given
 $\unicode[STIX]{x1D706}_{s}$
and
$\unicode[STIX]{x1D706}_{s}$
and
 $u_{s}(y)$
were found to be complex this unknown linear system cannot be self-adjoint, even for the case of a uni-directional flow. In addition to elucidating aspects of the flow physics, the findings provide guidance for development of new unsteady Reynolds-averaged Navier–Stokes turbulence models, and constitute a new and accessible benchmark problem for assessing the performance of existing models, which are used widely throughout industry.
$u_{s}(y)$
were found to be complex this unknown linear system cannot be self-adjoint, even for the case of a uni-directional flow. In addition to elucidating aspects of the flow physics, the findings provide guidance for development of new unsteady Reynolds-averaged Navier–Stokes turbulence models, and constitute a new and accessible benchmark problem for assessing the performance of existing models, which are used widely throughout industry.
Future studies can employ the approach adopted here to identify further eigenmodes of averaged small-amplitude perturbations to turbulent channel flow. These could include e.g. those associated with higher Reynolds numbers, and those associated with perturbations that vary in wall-parallel directions; with the objective of obtaining a more extensive set of eigenmodes analogous to those given by the Orr–Sommerfeld equation for laminar channel flow.
Acknowledgements
The authors would like to thank the Engineering and Physical Sciences Research Council for their support via an Early Career Fellowship (EP/K027379/1 and EP/R030340/1), the Swiss National Supercomputing Centre for access to Piz Daint and Cambridge University for access to Wilkes.
Supplementary material
Supplementary material is available at https://doi.org/10.1017/jfm.2019.520.
Appendix A. Mesh independence
A.1 Overview
Simulations were performed on various meshes, and using various polynomials orders to represent the solution in each element. Full details of each configuration are provided in table 1, where
 $n_{x}$
,
$n_{x}$
,
 $n_{y}$
and
$n_{y}$
and
 $n_{z}$
are the number of mesh elements in the
$n_{z}$
are the number of mesh elements in the
 $x$
,
$x$
,
 $y$
and
$y$
and
 $z$
directions respectively, and
$z$
directions respectively, and
 $p$
is the polynomial order used to represent the solution in each element. All meshes were uniform in the
$p$
is the polynomial order used to represent the solution in each element. All meshes were uniform in the
 $x$
- and
$x$
- and
 $z$
-directions, but non-uniform in the
$z$
-directions, but non-uniform in the
 $y$
-direction, with resolution skewed towards the channel walls.
$y$
-direction, with resolution skewed towards the channel walls.
Table 1. Configurations.

A.2 Velocity
Figures 13 and 14 show plots of normalised time-averaged
 $x$
-velocity
$x$
-velocity
 $$\begin{eqnarray}\displaystyle u^{+}=u\sqrt{{\displaystyle \frac{\unicode[STIX]{x1D70C}}{\unicode[STIX]{x1D70F}_{w}}}}, & & \displaystyle\end{eqnarray}$$
where
 $\unicode[STIX]{x1D70C}$
is fluid density and
$\unicode[STIX]{x1D70C}$
is fluid density and
 $\unicode[STIX]{x1D70F}_{w}$
is mean wall shear stress, as a function of normalised wall-normal distance
$\unicode[STIX]{x1D70F}_{w}$
is mean wall shear stress, as a function of normalised wall-normal distance
 $$\begin{eqnarray}\displaystyle y^{+}={\displaystyle \frac{\unicode[STIX]{x0394}y}{\unicode[STIX]{x1D708}}}\sqrt{{\displaystyle \frac{\unicode[STIX]{x1D70F}_{w}}{\unicode[STIX]{x1D70C}}}}, & & \displaystyle\end{eqnarray}$$
where
 $\unicode[STIX]{x1D708}$
is fluid kinematic viscosity and
$\unicode[STIX]{x1D708}$
is fluid kinematic viscosity and
 $\unicode[STIX]{x0394}y$
is wall-normal distance. Figure 13 shows variation with
$\unicode[STIX]{x0394}y$
is wall-normal distance. Figure 13 shows variation with
 $n_{x}$
,
$n_{x}$
,
 $n_{y}$
and
$n_{y}$
and
 $n_{z}$
for fixed
$n_{z}$
for fixed
 $p$
. The three finest meshes (52-16-50-p4, 62-19-60-p4, 82-25-80-p4) produce visually identical results, indicating mesh independence has been achieved. Figure 14 shows variation with
$p$
. The three finest meshes (52-16-50-p4, 62-19-60-p4, 82-25-80-p4) produce visually identical results, indicating mesh independence has been achieved. Figure 14 shows variation with
 $p$
for fixed
$p$
for fixed
 $n_{x}$
,
$n_{x}$
,
 $n_{z}$
and
$n_{z}$
and
 $n_{z}$
. The two highest polynomial orders (62-19-60-p4, 62-19-60-p5) also produce visually identical results, also indicating that mesh independence has been achieved. One can conclude that the 62-19-60-p4 configuration is sufficient to achieve mesh independence of the velocity.
$n_{z}$
. The two highest polynomial orders (62-19-60-p4, 62-19-60-p5) also produce visually identical results, also indicating that mesh independence has been achieved. One can conclude that the 62-19-60-p4 configuration is sufficient to achieve mesh independence of the velocity.

Figure 13. Plots of
 $u^{+}$
for configuration 42-13-40-p4 (solid line), 52-16-50-p4 (dashed line), 62-19-60-p4 (dotted line) and 82-25-80-p4 (dash-dotted line).
$u^{+}$
for configuration 42-13-40-p4 (solid line), 52-16-50-p4 (dashed line), 62-19-60-p4 (dotted line) and 82-25-80-p4 (dash-dotted line).

Figure 14. Plots of
 $u^{+}$
for configuration 62-19-60-p3 (solid line), 62-19-60-p4 (dashed line) and 62-19-60-p5 (dotted line).
$u^{+}$
for configuration 62-19-60-p3 (solid line), 62-19-60-p4 (dashed line) and 62-19-60-p5 (dotted line).
A.3 Velocity fluctuations
Figures 15 and 16 show plots of
 $x$
-velocity fluctuations
$x$
-velocity fluctuations
 $u_{rms}$
,
$u_{rms}$
,
 $y$
-velocity fluctuations
$y$
-velocity fluctuations
 $v_{rms}$
and
$v_{rms}$
and
 $z$
-velocity fluctuations
$z$
-velocity fluctuations
 $w_{rms}$
, as a function of
$w_{rms}$
, as a function of
 $y$
. Figure 15 shows variation with
$y$
. Figure 15 shows variation with
 $n_{x}$
,
$n_{x}$
,
 $n_{y}$
and
$n_{y}$
and
 $n_{z}$
for fixed
$n_{z}$
for fixed
 $p$
. The three finest meshes (52-16-50-p4, 62-19-60-p4, 82-25-80-p4) produce visually identical results, indicating mesh independence has been achieved. Figure 16 shows variation with
$p$
. The three finest meshes (52-16-50-p4, 62-19-60-p4, 82-25-80-p4) produce visually identical results, indicating mesh independence has been achieved. Figure 16 shows variation with
 $p$
for fixed
$p$
for fixed
 $n_{x}$
,
$n_{x}$
,
 $n_{z}$
and
$n_{z}$
and
 $n_{z}$
. The two highest polynomial orders (62-19-60-p4, 62-19-60-p5) also produce visually identical results, also indicating that mesh independence has been achieved. One can conclude that the 62-19-60-p4 configuration is sufficient to achieve mesh independence of the velocity fluctuations.
$n_{z}$
. The two highest polynomial orders (62-19-60-p4, 62-19-60-p5) also produce visually identical results, also indicating that mesh independence has been achieved. One can conclude that the 62-19-60-p4 configuration is sufficient to achieve mesh independence of the velocity fluctuations.

Figure 15. Plots of
 $u_{rms}$
,
$u_{rms}$
,
 $v_{rms}$
and
$v_{rms}$
and
 $w_{rms}$
for configuration 42-13-40-p4 (solid lines), 52-16-50-p4 (dashed lines), 62-19-60-p4 (dotted lines) and 82-25-80-p4 (dash-dotted lines).
$w_{rms}$
for configuration 42-13-40-p4 (solid lines), 52-16-50-p4 (dashed lines), 62-19-60-p4 (dotted lines) and 82-25-80-p4 (dash-dotted lines).

Figure 16. Plots of
 $u_{rms}$
,
$u_{rms}$
,
 $v_{rms}$
and
$v_{rms}$
and
 $w_{rms}$
for configuration 62-19-60-p3 (solid lines), 62-19-60-p4 (dashed lines) and 62-19-60-p5 (dotted lines).
$w_{rms}$
for configuration 62-19-60-p3 (solid lines), 62-19-60-p4 (dashed lines) and 62-19-60-p5 (dotted lines).
Appendix B. Comparison with published DNS data
Results obtained using the 62-19-60-p4 configuration were compared with DNS results at the same
 $Re_{\unicode[STIX]{x1D70F}}$
obtained by Kim, Moin & Moser (Reference Kim, Moin and Moser1987). Figure 17 compares plots of
$Re_{\unicode[STIX]{x1D70F}}$
obtained by Kim, Moin & Moser (Reference Kim, Moin and Moser1987). Figure 17 compares plots of
 $u^{+}$
as a function of
$u^{+}$
as a function of
 $y^{+}$
, and
$y^{+}$
, and
 $u_{rms}$
,
$u_{rms}$
,
 $v_{rms}$
and
$v_{rms}$
and
 $w_{rms}$
as a function of
$w_{rms}$
as a function of
 $y$
. There is good agreement in the inner, transition and outer layers. This provides further evidence that the 62-19-60-p4 configuration effectively resolves the flow physics.
$y$
. There is good agreement in the inner, transition and outer layers. This provides further evidence that the 62-19-60-p4 configuration effectively resolves the flow physics.

Figure 17. Plots of
 $u^{+}$
,
$u^{+}$
,
 $u_{rms}$
,
$u_{rms}$
,
 $v_{rms}$
and
$v_{rms}$
and
 $w_{rms}$
obtained using the 62-19-60-p4 configuration (solid lines) and from previous DNS by Kim et al. (Reference Kim, Moin and Moser1987) (dashed lines).
$w_{rms}$
obtained using the 62-19-60-p4 configuration (solid lines) and from previous DNS by Kim et al. (Reference Kim, Moin and Moser1987) (dashed lines).
Appendix C. Persistence of anti-symmetry for linear evolution operators
Consider defining an evolution operator
 $E_{t}$
for an ensemble- and
$E_{t}$
for an ensemble- and
 $x$
–
$x$
–
 $z$
-averaged perturbation such that
$z$
-averaged perturbation such that
 $$\begin{eqnarray}\displaystyle \bar{u}^{\prime }(t,y)=E_{t}[\bar{u}_{0}^{\prime }(y)], & & \displaystyle\end{eqnarray}$$
where
 $\bar{u}_{0}^{\prime }(y)$
is the initial perturbation, and
$\bar{u}_{0}^{\prime }(y)$
is the initial perturbation, and
 $\bar{u}^{\prime }(t,y)$
is the ensemble-
$\bar{u}^{\prime }(t,y)$
is the ensemble-
 $x$
–
$x$
–
 $z$
averaged perturbation at time
$z$
averaged perturbation at time
 $t$
. Given the symmetry of the problem one can reason that
$t$
. Given the symmetry of the problem one can reason that
 $$\begin{eqnarray}\displaystyle \bar{u}^{\prime }(t,-y)=E_{t}[\bar{u}_{0}^{\prime }(-y)], & & \displaystyle\end{eqnarray}$$
and thus
 $$\begin{eqnarray}\displaystyle \bar{u}^{\prime }(t,y)+\bar{u}^{\prime }(t,-y)=E_{t}[\bar{u}_{0}^{\prime }(y)]+E_{t}[\bar{u}_{0}^{\prime }(-y)]. & & \displaystyle\end{eqnarray}$$
If the evolution operator
 $E_{t}$
is linear then
$E_{t}$
is linear then
 $$\begin{eqnarray}\displaystyle \bar{u}^{\prime }(t,y)+\bar{u}^{\prime }(t,-y)=E_{t}[\bar{u}_{0}^{\prime }(y)+\bar{u}_{0}^{\prime }(-y)], & & \displaystyle\end{eqnarray}$$
and further, if the initial perturbation is anti-symmetric,
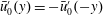 $\bar{u}_{0}^{\prime }(y)=-\bar{u}_{0}^{\prime }(-y)$
, then
$\bar{u}_{0}^{\prime }(y)=-\bar{u}_{0}^{\prime }(-y)$
, then
 $$\begin{eqnarray}\displaystyle \bar{u}^{\prime }(t,y)+\bar{u}^{\prime }(t,-y)=E_{t}[\bar{u}_{0}^{\prime }(y)-\bar{u}_{0}^{\prime }(y)]=E_{t}[0], & & \displaystyle\end{eqnarray}$$
and thus since
 $E_{t}[0]=0$
one obtains
$E_{t}[0]=0$
one obtains
 $$\begin{eqnarray}\displaystyle \bar{u}^{\prime }(t,y)=-\bar{u}^{\prime }(t,-y). & & \displaystyle\end{eqnarray}$$
Therefore, if
 $E_{t}$
is a symmetric linear operator, and the initial perturbation is anti-symmetric, then the ensemble- and
$E_{t}$
is a symmetric linear operator, and the initial perturbation is anti-symmetric, then the ensemble- and
 $x$
–
$x$
–
 $z$
-averaged perturbation must remain purely anti-symmetric for all time.
$z$
-averaged perturbation must remain purely anti-symmetric for all time.


 Open access