


1. Introduction
Glaciers contribute significantly to the current global sea-level rise and are expected to remain important contributors in the twenty-first century (e.g. Hock and others, Reference Hock2019; Marzeion and others, Reference Marzeion2020; Siegert and others, Reference Siegert, Alley, Rignot, Englander and Corell2020). Therefore, accurate estimation of changes in glacier elevation and volume is crucial. These changes can be assessed by in situ glaciological measurements or by the geodetic method by means of digital elevation model (DEM) differencing (Cogley and others, Reference Cogley2011; Berthier and others, Reference Berthier2023). Glaciological measurements are laborious and limited to small glacier samples (WGMS, 2021). The multi-temporal differencing of DEMs acquired by remote sensing is a common technique to measure glacier surface elevation changes of larger and/or remote regions (e.g. Dussaillant and others, Reference Dussaillant2019; Huber and others, Reference Huber, McNabb and Zemp2020; Shean and others, Reference Shean2020; Sommer and others, Reference Sommer2020) or even globally (Hugonnet and others, Reference Hugonnet2021) at multi-annual to decadal resolution.
Bistatic single-pass interferometric synthetic aperture radar (InSAR) is an efficient technique for determining geodetic glacier mass balances as it is not affected by variations in the atmospheric phase delay, ice motion and temporal decorrelation (Rott, Reference Rott2009). The German Aerospace Center launched the two satellites TerraSAR-X and TanDEM-X in 2007 and 2010, respectively, each equipped with an X-band (9.65 GHz) microwave sensor. The bistatic InSAR formation, known as TanDEM-X mission, allows the derivation of high-resolution (typically 12 m) DEMs, which hold a large potential for glacier elevation change assessments and monitoring. They have already been used for numerous glaciological applications (e.g. Rott and others, Reference Rott2014; Rankl and Braun, Reference Rankl and Braun2016; Braun and others, Reference Braun2019; Huber and others, Reference Huber, McNabb and Zemp2020; Sommer and others, Reference Sommer2020). Nevertheless, besides the advantages of this technique, a bias is potentially introduced through the penetration of the X-band into snow and firn due to radar volume scattering (Dall, Reference Dall2007). Studies using data from X-band microwave sensors for glaciological applications in the Alps (e.g. Dehecq and others, Reference Dehecq2016; Sommer and others, Reference Sommer2020; Leinss and Bernhard, Reference Leinss and Bernhard2021), the Andes (e.g. Ruiz and others, Reference Ruiz, Berthier, Viale, Pitte and Masiokas2017; Braun and others, Reference Braun2019; Seehaus and others, Reference Seehaus2019) or High Mountain Asia (e.g. Lambrecht and others, Reference Lambrecht, Mayer, Wendt, Floricioiu and Völksen2018) deal differently with radar penetration; depending on the glacier type and dataset used, it is either neglected or seen as one of the main sources of uncertainty when estimating geodetic mass balances.
Radar penetration is neglected, for example, during summer when it is assumed that the presence of liquid water in the snow pack or bare ice reduces the X-band penetration depth to a minimum (e.g. Ruiz and others, Reference Ruiz, Berthier, Viale, Pitte and Masiokas2017; Seehaus and others, Reference Seehaus2020). A similar assumption of negligible X-band penetration has been made in several studies to identify and correct Shuttle Radar Topography Mission (SRTM) C-band penetration by comparing SRTMC/X-band DEMs on glacier areas in High-Mountain Asia (e.g. Gardelle and others, Reference Gardelle, Berthier and Arnaud2012; Zhou and others, Reference Zhou, Li, Li, Zhao and Ding2019). Neglecting radar penetration can be appropriate, depending on the prevailing surface conditions and the specific case in question, yet it is often insufficiently validated. Various studies comparing InSAR DEMs from TanDEM-X with elevations from quasi-concurrent optical, laser or Global Navigation Satellite System (GNSS) data have shown that X-band penetration varies over glacier surfaces and can be substantial, especially when using radar scenes from winter or dry snow conditions (e.g. Rott and others, Reference Rott, Sturm and Miller1993; Dehecq and others, Reference Dehecq2016; Abdullahi and others, Reference Abdullahi2019; Li and others, Reference Li, Jiang, Liu and Wang2021a). However, knowledge about the magnitude of X-band penetration of TanDEM-X in the Alps in winter is limited.
In this study, we investigated the unique situation of almost synchronous acquisitions of TanDEM-X and Pléiades DEMs, complemented with in situ observations from Grosser Aletschgletscher, all within a 4 d period. All measurements are from late winter 2021; there was no snowfall or melting during this period. These datasets allow us to quantify the glacier elevation bias due to radar penetration, to better understand the governing processes and to put the corresponding bias into context with geodetic mass-change results. Therefore, we first performed a co-registration and uncertainty assessment of the DEMs based on the elevation differences over stable areas that were (almost) free from snow and ice, and based on the comparison with differential GNSS (dGNSS) measurements. Second, we compared the optical and radar DEMs to estimate the elevation bias introduced by radar penetration into snow and firn and describe the corresponding spatial patterns. Third, we compared the elevation bias due to radar penetration with ground-penetrating radar (GPR) profiles as well as with point snow measurements, to identify how snow characteristics and layers impact the propagation of the radar signal. Fourth, we discuss potential influences on the elevation bias due to radar penetration as well as the potential impact of this bias on geodetic mass-balance estimates.
2. Study area, data and methods
2.1 Study area
Grosser Aletschgletscher is the largest glacier in the European Alps (Windnagel and others, Reference Windnagel2022). It has a length of more than 22 km, an area of ~80 km2, a thickness of up to 800 m and its volume corresponds to 24% of the total ice volume in the Swiss Alps (Farinotti and others, Reference Farinotti, Huss, Bauder and Funk2009; GLAMOS, 2018; Jouvet and Huss, Reference Jouvet and Huss2019; Linsbauer and others, Reference Linsbauer2021). It currently spans from ~1700 to 4200 m. Three main tributary glaciers merge at Konkordiaplatz: Grosser Aletschfirn from the west, Jungfraufirn from the north and Ewigschneefeld from the northwest (Fig. 1). They form a common tongue flowing ~15 km to the southwest. At the weather station on Jungfraujoch (3580 m), the mean annual temperature (1991–2020) is −6.7°C and the mean daily temperatures are below 0°C from September until June (MeteoSchweiz, 2022).

Figure 1. Overview of Grosser Aletschgletscher, including the locations of data acquired for this study: snow measurements (red and red/black squares, labelled 1–4), GPR and dGNSS measurements (blue lines), accumulation stake (blue pin), snow depth measurements (blue circles; two of the measuring sites used in this study are not illustrated as they are located 6 and 12 km further west). The outline of Grosser Aletschgletscher was manually adjusted based on the GLIMS outlines from 2015 (Paul and others, Reference Paul2019) and the Pléiades orthophoto. Background: Pléiades orthophoto (copyright CNES 2021, Distribution Airbus Defense and Space) and hillshade of the swissALTI3D DEM.
In 1918, an ablation stake was installed at 3390 m, resulting in more than 100 years of almost continuous glaciological measurements (GLAMOS, 2018). This glacier has also been the focus of a vast number of studies. Already in the 1940s, extensive fieldwork was performed mainly to assess the temperature structure of the glacier (e.g. Hughes and Seligman, Reference Hughes and Seligman1939; Seligman, Reference Seligman1941). Since 2011, Grosser Aletschgletscher has been observed by the TanDEM-X bistatic InSAR formation and has been defined by the DLR as an Alpine super-test site for glaciological applications; about 159 experimental repeat pass scenes have been acquired over the glacier. Therefore, many studies have used this TanDEM-X dataset already to investigate different glaciological processes, such as glacier elevation change or flow velocity (e.g. Leinss and Hajnsek, Reference Leinss and Hajnsek2018; Leinss and Bernhard, Reference Leinss and Bernhard2021; Li and others, Reference Li, Leinss and Hajnsek2021c).
2.2 In situ data
To get an insight on the interaction of the TanDEM-X radar signal with snow and firn, we acquired information about the internal snow structure and layering in order to compare these data with the elevation difference due to signal penetration. We performed all field measurements from 29 March until 1 April 2021, with parallel imaging of TanDEM-X and Pléiades, requested from corresponding space agencies. The in situ measurements consisted of GPR, dGNSS as well as snow-pit and coring measurements.
GPR provides spatially distributed information about the internal layering of the snow and firn and is widely used (e.g. Kohler and others, Reference Kohler, Moore, Kennett, Engeset and Elvehøy1997; Machguth and others, Reference Machguth, Eisen, Paul and Hoelzle2006; Sold and others, Reference Sold2013; Kronenberg and others, Reference Kronenberg, Machguth, Eichler, Schwikowski and Hoelzle2021). The radar signal is reflected at boundaries with a change in dielectric permittivity; this can be related to changes in material properties such as density contrasts, water content, dust, etc. (Plewes and Hubbard, Reference Plewes and Hubbard2001). Density contrasts usually result from ice layers and crusts formed at the snow surface during melting events, mainly during summer months (Kohler and others, Reference Kohler, Moore, Kennett, Engeset and Elvehøy1997).
We complemented our GPR surveys with snow-pits and drilling of snow cores (core diameter of 9 cm). These measurements can aid the interpretation of the GPR data and might contribute to the explanation of radar penetration. Snow-pit measurements are a common way to investigate snow and firn density, structure, layering and other attributes. Coring, using a barrel corer, allows us to measure the same parameters and is less labour-intensive. However, because of the rather small core diameters compared to a snow-pit wall, the latter is better suited for detailed observations of stratigraphy (Cogley and others, Reference Cogley2011). Hence, we combined snow-pit and snow-core measurements.
Further, we used dGNSS to measure the glacier surface elevation with centimetre accuracy. The absolute height of the dGNSS measurements serves as a reference for the Pléiades DEM.
2.2.1 Ground-penetrating radar
We measured GPR profiles of the snow and firn pack of the upper accumulation area of Grosser Aletschgletscher. We used a MALÅ ProEx GPR system with an 800 MHz shielded antenna that was mounted on a pulka and pulled over the snow surface, resulting in a spacing of ~0.3 m along-track. Figure 1 shows the location of the GPR profiles. The measurements on top of the Jungfraufirn were performed on 30 March 2021, the ones on Ewigschneefeld on 31 March 2021, resulting in four individual radargrams: two from Jungfraufirn and two from Ewigschneefeld with a total length of 11.1 km. At the given frequency and snow/firn properties, the penetration depth of the GPR signal is ~15 m. The data were processed using the commercial software ReflexW (Sandmeier Scientific Software) following Sold and others (Reference Sold2013). The processing included the following consecutive steps: static correction, frequency band-pass filtering, background removal, trace interpolation to make equidistant traces and gain function. To convert from time to depth, an assumption for the radar wave velocity is necessary, which can be calculated based on relative permittivity (cf. Sold and others, Reference Sold2013). We calculated the relative permittivity using the mean densities from our snow cores. We computed a mean radar velocity of 0.216 m ns−1, similar to Machguth and others (Reference Machguth, Eisen, Paul and Hoelzle2006). As a result of these processing steps, we obtained four processed GPR radargrams from which we could identify numerous layers at different depths (see section 3.2.1 in results). Following Sold and others (Reference Sold2013), we assume a 5% uncertainty in our GPR-derived depths.
2.2.2 Snow pits and coring
We performed measurements at two different locations on Jungfraufirn (Fig. 1): one snow core down to 5.8 m depth (location 1), one snow core down to 9 m depth and a 2.4 m deep snow pit (location 2). Likewise, we performed measurements at two different locations on Ewigschneefeld: one snow core down to 8.2 m and a 2.6 m deep snow pit (location 3) and one snow core down to 9 m (location 4). The cores were analysed on site directly after drilling. We documented the occurrence of visible ice layers with thicknesses of at least half a centimetre. We then cut the cores into segments of 20. We measured the temperature using a rod thermometer and weighed each sample to determine density. In the snow pits (at location 2 and 3, Fig. 1), we established a vertical surface facing away from the sun. First, we documented the occurrence of visible ice layers and dust layers. We then measured the temperature and the density of 20 cm depth segments. Following Lambrecht and others (Reference Lambrecht, Mayer, Bohleber and Aizen2020), we assume an uncertainty in all density measurements (from pit and core) of 5%.
2.2.3 Differential Global Navigation Satellite System
We used a dual-frequency Trimble GNSS device (Trimble TSC2 controller with Trimble R7 receiver and Zephyr 2 antenna) to observe the glacier surface elevation using GLONASS and GPS satellites. The GNSS antenna was attached onto the pulka next to the GPR antenna and pulled over the glacier surface. This gave us 12.3 km of GNSS profiles as kinematic tracks with a sampling interval of 0.05 s, resulting in a point density of around 20 points per metre along-track. We used the post-processing kinematic method using a virtual reference station and the GrafNav software. The fixed reference station was provided by the automated GNSS network in Switzerland (AGNES, Brockmann and others, Reference Brockmann2019). The accuracy is calculated to be 1–2 cm horizontally and 2–6 cm vertically. The latter accuracy is about 2–3 times worse due to the geometry of the satellite constellation. Further, external effects (e.g. potential sinking of the sledge) might exceed the vertical accuracy. Therefore, we assume a vertical accuracy of around 10 cm.
2.3. Satellite data
2.3.1 TanDEM-X elevation model
We used an InSAR DEM generated from TanDEM-X Coregistered Single look Slant range Complex (CoSSC) data provided by the German Aerospace Center (DLR). The DEM originates from a single bistatic X-band (9.65 GHz) InSAR acquisition in the polarizations VV and HH from 30 March 2021 (5:45 Central Europe Time).
The Integrated TanDEM-X Processor (ITP) system was used to produce a DEM from the HH polarization channel (Rossi and others, Reference Rossi, Eineder, Fritz and Breit2010). During the interferometric processing with ITP, a simulated phase was calculated from the swissALTI3D airborne DEM (see 2.4.1) to calibrate the elevation measurements and facilitate the phase unwrapping process (Schweisshelm and others, Reference Schweisshelm, Lachaise and Fritz2021). To reduce the phase noise a multilooking was performed with an equivalent number of looks of 9 in range and 7 in azimuth, which leads to a spatial resolution slightly larger than 12 m. Additionally, a flag mask (FLM) shows suspected shadow and layover areas as well as areas of difficult phase unwrapping due to steep topography. A height error map (HEM) also comes with the DEM, providing the standard error of the corresponding elevation value but disregarding any systematic elevation offsets depending on the accuracy of the co-registration (Wessel, Reference Wessel2018). All final gridded layers have a posting of 0.2 × 0.2 arcsec (~4 m × 6 m).
Table 1 details the interferometric parameters of the TanDEM-X scene. For the radar wavelength λ of 0.031 m (as for X-band), this geometry results in a height of ambiguity H a given by

where θ i is the incidence angle in the centre of the scene, B ⊥ is the perpendicular baseline and r 0 the slant range distance.
Table 1. Interferometric parameters of the TanDEM-X DEM

θ i is the incidence angle in the centre of the scene; it varies from 30.64° to 32.61° in near and far ranges, respectively. B⊥ is the perpendicular baseline and r 0 the slant range distance. The height of ambiguity Ha describes the elevation offset at which ambiguous elevation bands are found in the interferogram.
The values in the height error map range from 0 to 9.1 m within the study area, indicating the precision of the DEM, while the absolute vertical accuracy is dependent on the co-registration process described and evaluated in sections 2.5 and 3.1.
Affected regions as indicated in the flag mask were removed from the DEM prior to further analysis. Further, the height error map was used to additionally remove visible artefacts, resulting primarily in data voids outside the glacier along steep slopes. In addition, it also caused some voids on the western part of the accumulation area and the tongue.
For the comparison with the in situ measurements, which were taken on rather flat terrain, local slopes in range direction were not considered for the local incidence angle map. However, we considered local incidence angles – which are varying with elevation and range distance – for the calculation of the elevation difference map and related results. The elevation-dependent local incidence angle was calculated from the radar geometry and the swissALTI3D airborne DEM.
Assuming the same mean radar velocity of 0.216 m ns−1 as for the GPR measurements, the refractive index for the snow and ice medium n is 1.39 and the permittivity Ɛ is n 2. Following Rott and others (Reference Rott2021), a height of ambiguity for the snow/firn volume $H_{{\rm a}_{{\rm vol}}}$ can be calculated. This height of ambiguity is then valid for the phase contributions below the snow surface.
2.3.2 Pléiades elevation model
A Pléiades stereo pair was acquired on 31 March 2021 (10:40 Central Europe Time), 29 h after the TanDEM-X acquisition. The Pléiades 1A and 1B twin satellites, launched in 2011 and 2012, respectively, provide 0.5 m panchromatic and 2 m 4-band multispectral (blue, green, red, NIR) images. The stereopair was processed using the NASA Ames Stereo Pipeline (ASP, Beyer and others, Reference Beyer, Alexandrov and McMichael2018) to derive a DEM with a ground-sampling distance of 2 m and an 0.5 m resolution orthoimage, using the Semi-Global-Matching algorithm and the set of processing parameters from Deschamps-Berger and others (Reference Deschamps-Berger2020) without ground control points (GCPs). This processing follows the standards of the Pléiades Glacier Observatory programme (www.legos.omp.eu/pgo/). Without GCPs, Pléiades-derived DEMs are located within ~10 m (90% circular error) and have an altimetric precision of ~1 m over gentle terrain (Berthier and others, Reference Berthier2014). The 12-bit high-resolution Pléiades sensor ensures contrast in the images, even in the snow-covered areas of glaciers, which strongly limits the fraction of data gaps in the DEMs (here about 0.04%).
2.4 Airborne data
2.4.1 Airborne elevation model swissALTI3D
Complementary to the satellite data, we employed the high-precision swissALTI3D elevation model, derived from airborne data (Federal Office of Topography, 2021b). It originates from LiDAR (light detection and ranging) and optical stereo-correlation, and is updated at least every 6 years. We used the version published in 2019, which is a composite from photogrammetry acquired from July to September 2017. The vertical and horizontal precision is 0.5 m below 2000 m a.s.l. and 1–3 m above (Federal Office of Topography, 2021b). This DEM served as a reference DEM for (a) the co-registration of the Pléiades DEM, and (b) the generation of the TanDEM-X DEM (i.e. phase unwrapping). The provided airborne DEM was in orthometric heights and therefore converted to ellipsoidal heights (EPSG:32632, difference in absolute height of ~53 m) using the Swiss geoid model provided by swisstopo (Federal Office of Topography, 2021a). Hereinafter, the elevations refer to ellipsoidal heights, unless otherwise stated (using a.s.l.).
2.5 Co-registration
It is important to co-register the DEMs before DEM differencing to ensure the pixels represent the same location on the earth's surface (Nuth and Kääb, Reference Nuth and Kääb2011). Hence, they need to be aligned horizontally and vertically based on areas where no change is expected (i.e. stable terrain) between the DEMs. We followed the co-registration approach by Berthier and others (Reference Berthier2007) which is minimizing the std dev. of the differences between the DEMs over stable terrain by correction of shifts in x, y and z directions.
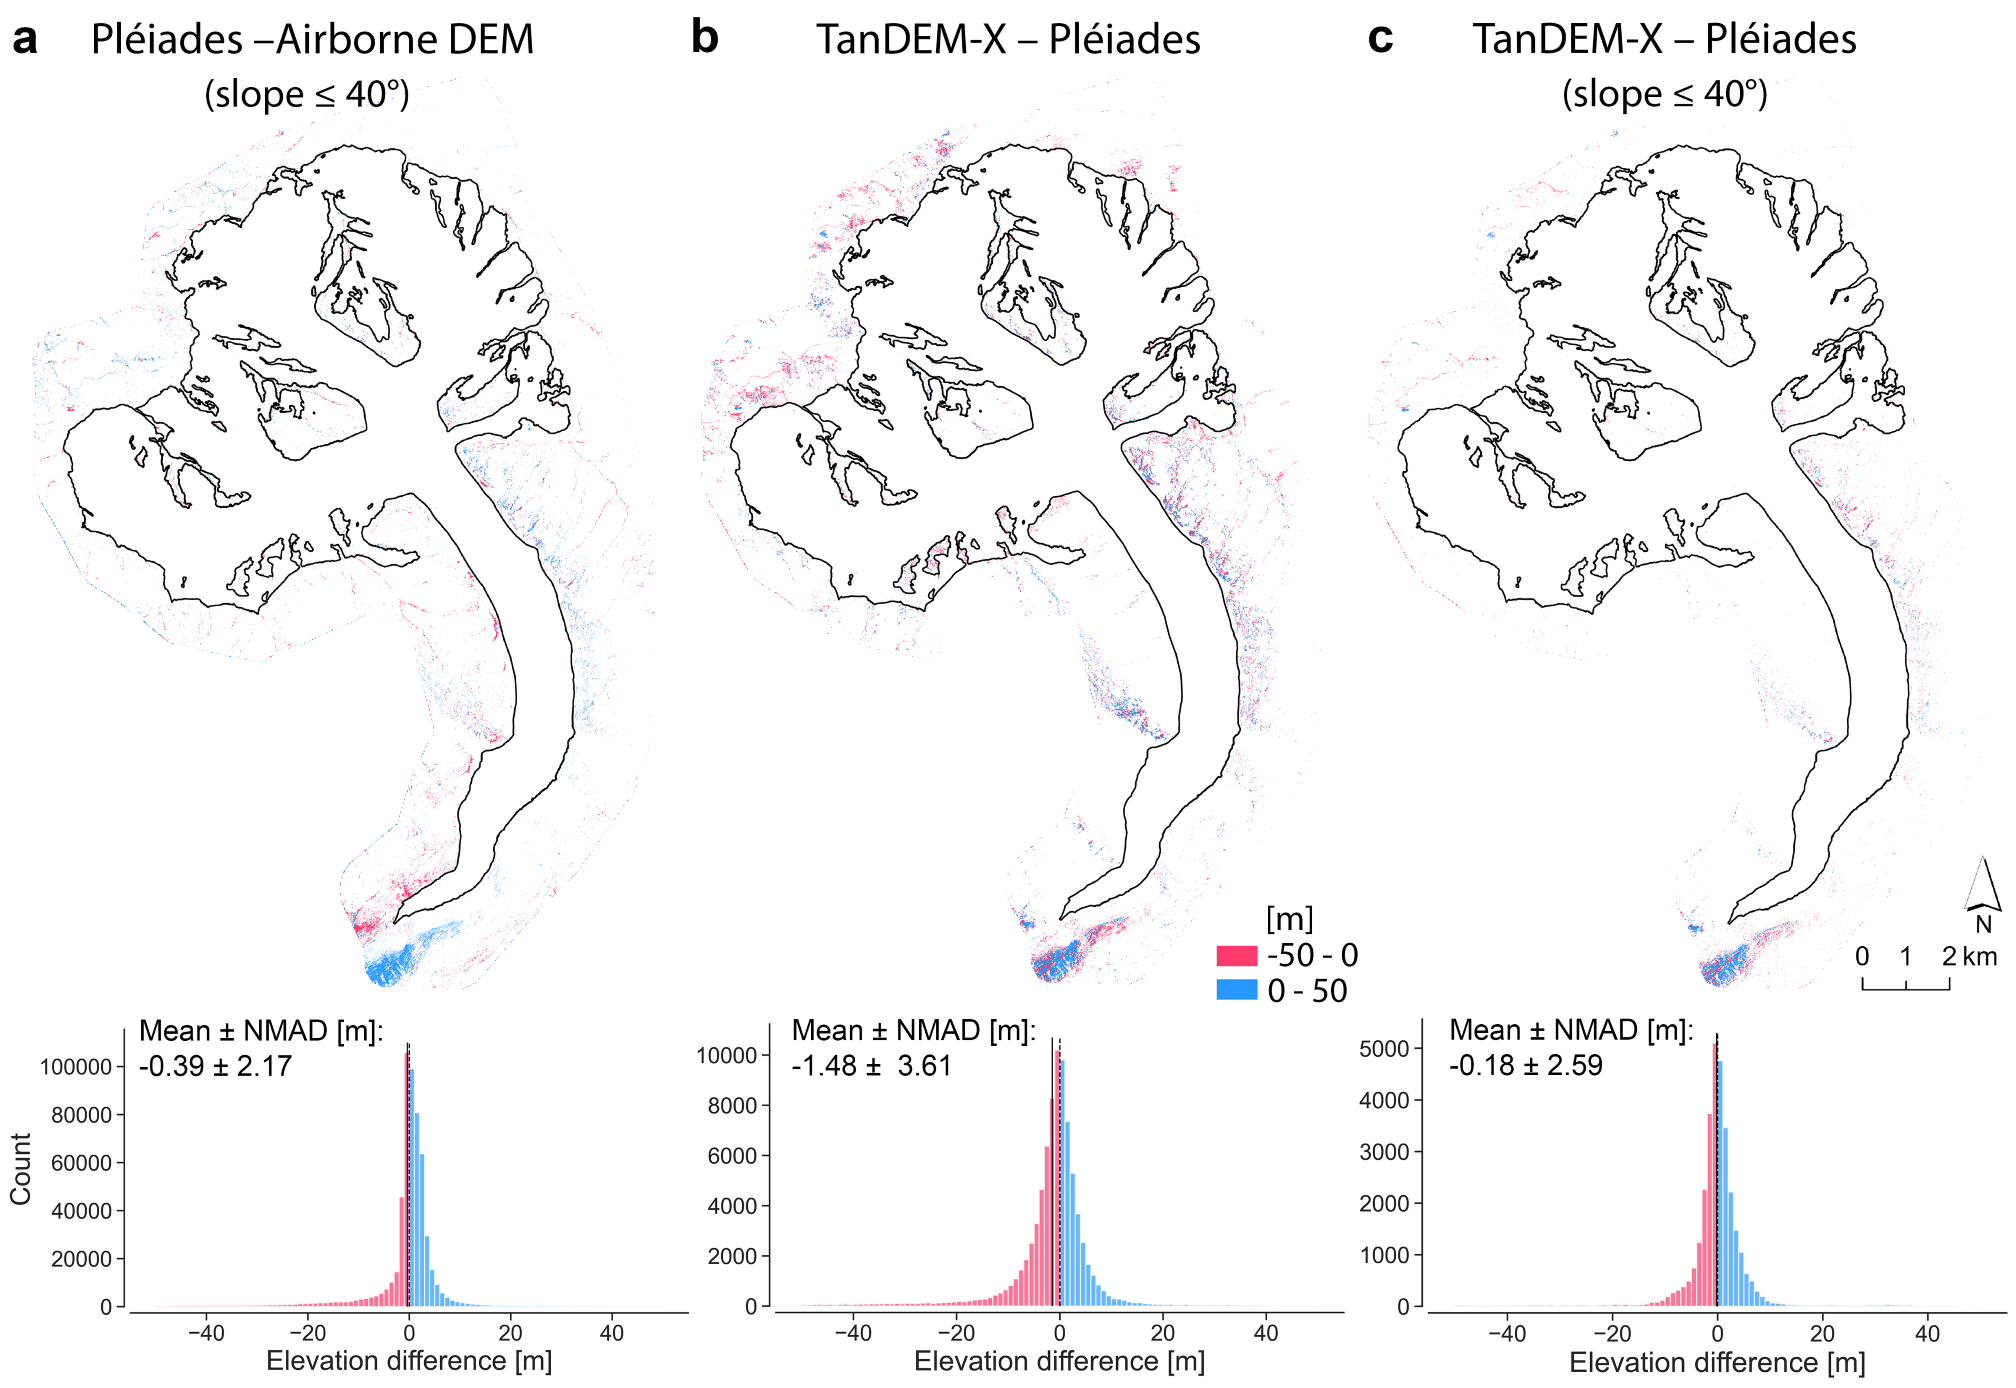
We first co-registered the Pléiades DEM to the airborne DEM. This would allow us a comparison with the GNSS data. The selection of stable terrain areas required some attention as most areas outside glaciers were covered by snow at the time of data acquisition. It was extracted with a land-cover supervised classification from the Pléiades multispectral images (Deschamps-Berger and others, Reference Deschamps-Berger2020) based on training data on snow-free pixels, resulting in ~3 000 000 pixels covering ~12.38 km2. Error-prone areas steeper than 40° were excluded from the stable terrain mask (~80% of the pixels) resulting in ~2.27 km2 remaining for the co-registration between Pléiades and the airborne DEM (Figs S1, S2).
We then co-registered the TanDEM-X DEM with the (co-registered) Pléiades DEM. These DEMs were acquired within 29 h of each other in winter conditions, with no change in snow cover. However, due to additional data voids outside the glacier along the steep slopes in the TanDEM-X DEM, we kept areas steeper than 40° in the stable terrain mask to ensure reliable co-registration. This resulted in ~130 000 pixels covering an area of ~4.64 km2 (Fig. S1). We tested various stable terrain masks, but excluding steep areas would remove more than half of the (almost) snow-free common area suitable for co-registration. It is worth noting that the stable mask contains limited pixels in the northeast and east directions (Fig. S2), but a good coverage and distribution in the west direction. Therefore, a potential east-west shift should be detected and minimized by co-registration.
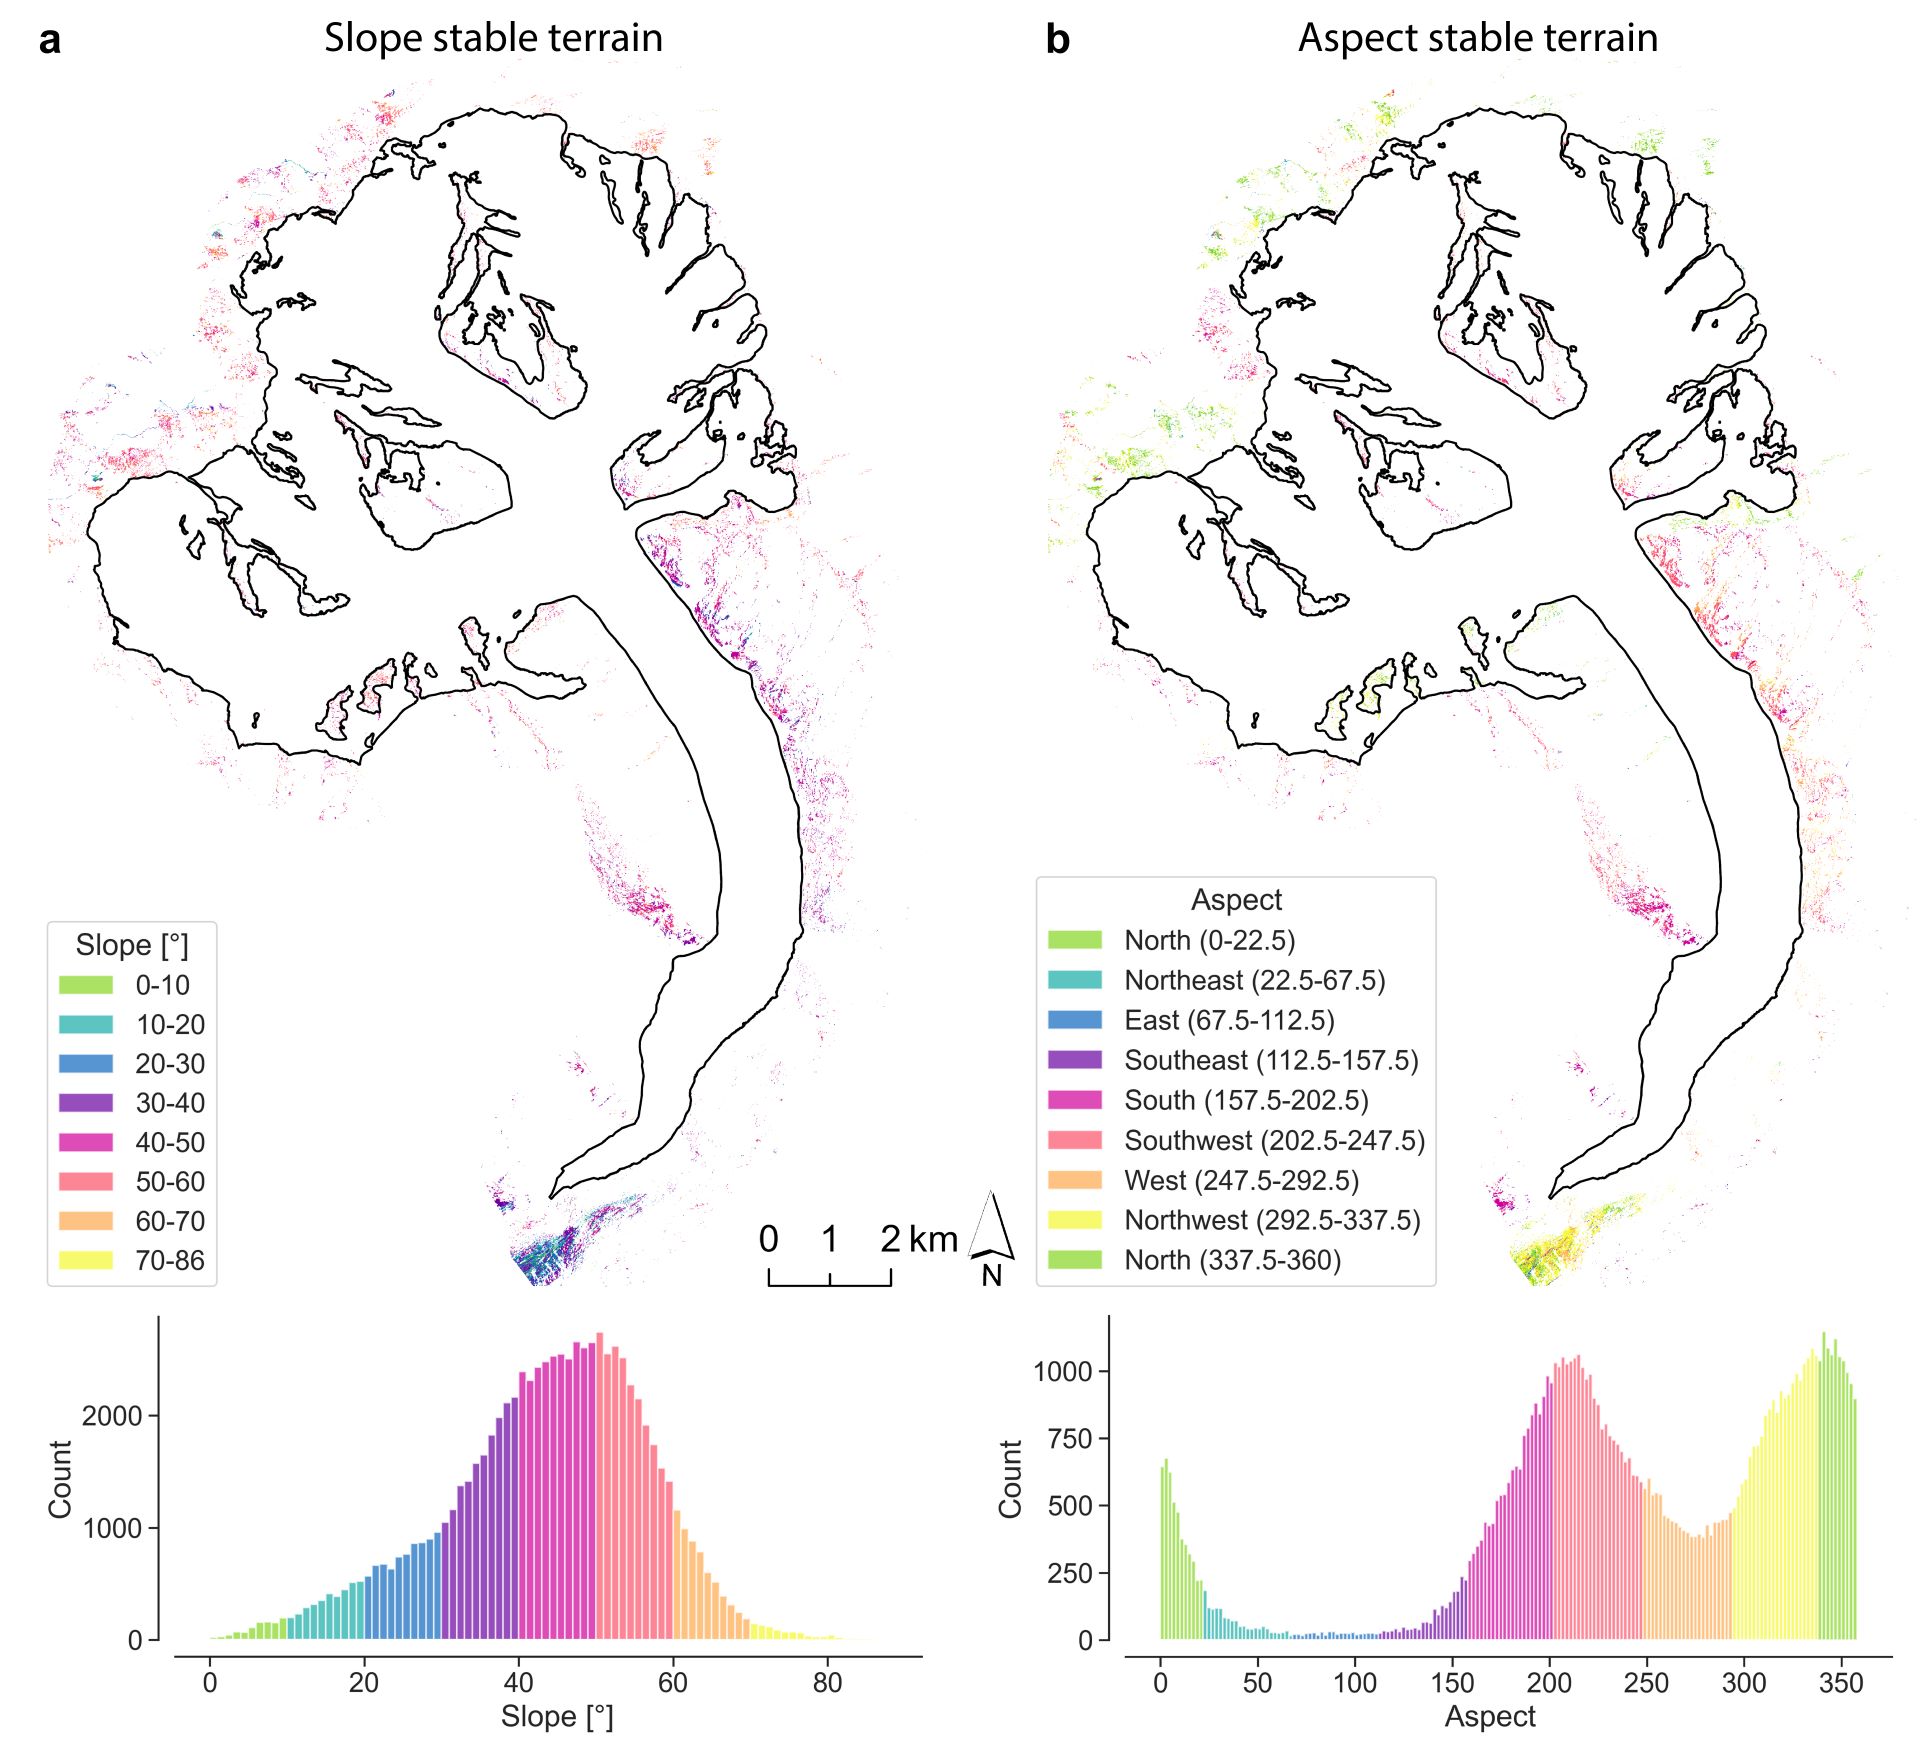
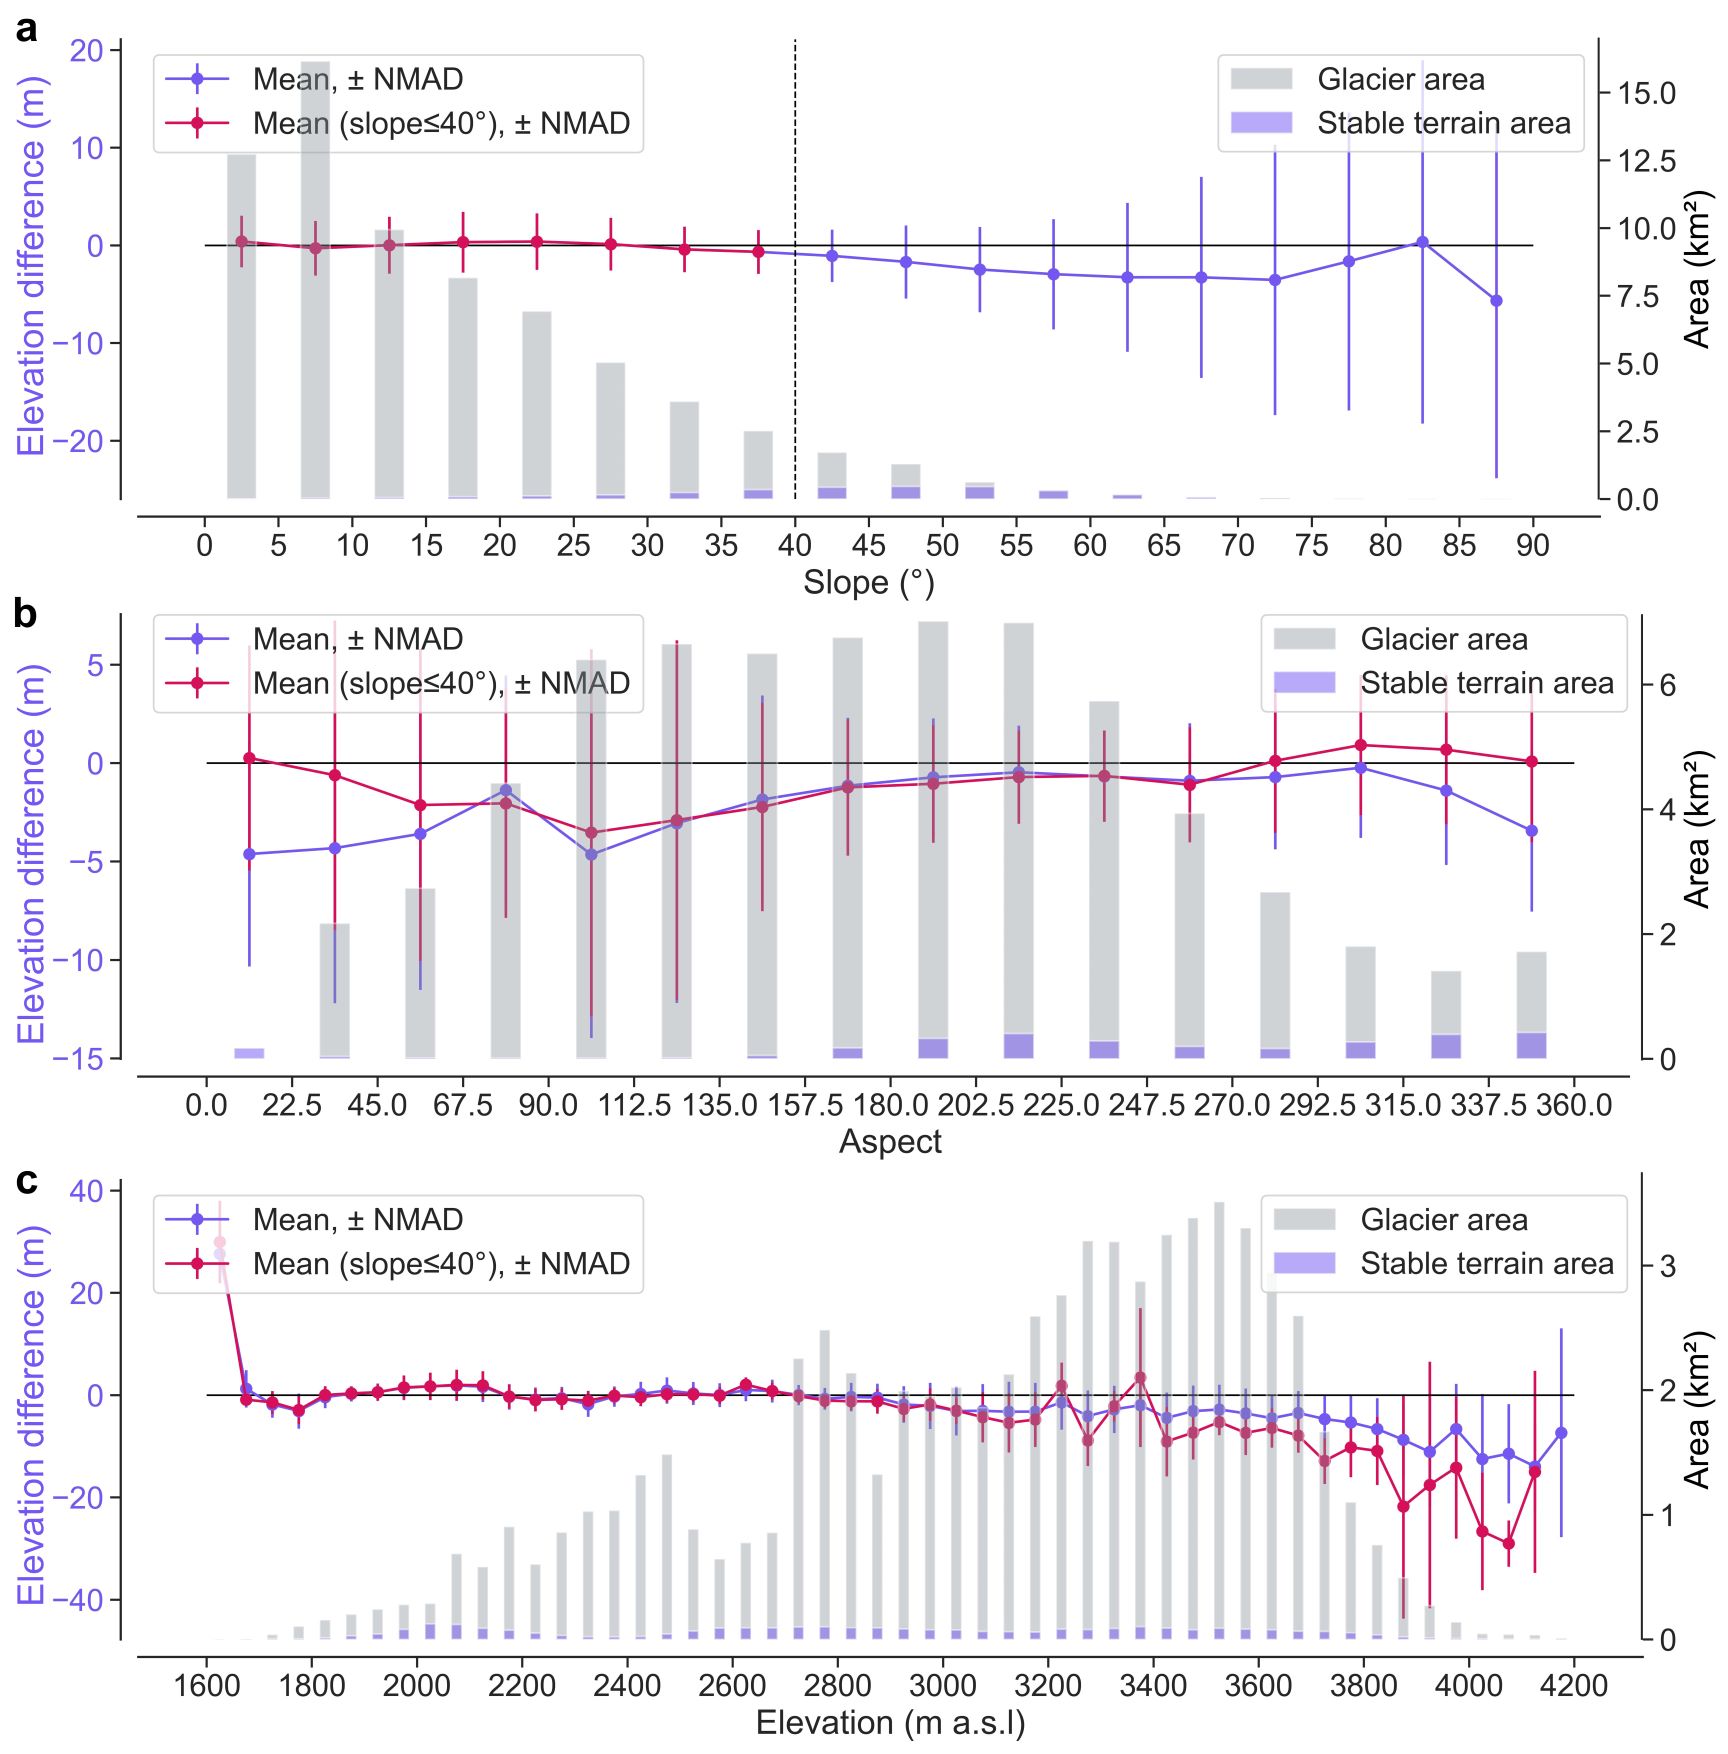
After co-registration, we decided against a further correction with respect to slope, aspect or elevation. The elevation differences over stable terrain show no significant bias with respect to slope or aspect (Figs S3a, b). With respect to elevation (Fig. S3c), there is no bias up to 2900 m, followed by a non-significant negative bias, which is increasing from zero to a few meters up to 3800. In the highest elevation ranges between 3800 and 4200 m, the negative bias is increasing with deviations from zero beyond error bars but based on a very limited number of stable terrain pixels with average slopes between 45 and 60° (Fig. S4). In addition, we note that a part of the negative bias on the stable terrain can be explained by misclassified pixels with snow and/or ice cover in shadow.
To estimate the sensitivity of our results to co-registration, we carried out a small intercomparison exercise. First, we created a modified mask of stable terrain (Fig. S5) by removing pixels of lower confidence due to their location in sparse forest and dark shadow areas, based on visual inspection of the orthophoto from Pléiades. Second, we used the two masks of stable terrain to compare different co-registration methods (Figs S6, S7). We applied the algorithm from Berthier and others (Reference Berthier2007) and from Nuth and Kääb (Reference Nuth and Kääb2011) as implemented in ‘demcoreg’ by Shean and others (Reference Shean2023). The results of our intercomparison study are discussed in section 4.1.
2.6 DEM differencing and uncertainty assessment
The uncertainty of the Pléiades DEM was estimated after the co-registration by computing the difference of (a) dGNSS elevations minus the Pléiades DEM, and (b) Pléiades DEM minus the airborne DEM over stable terrain. For the calculation of the statistics, absolute elevation differences larger than 50 m are considered to be outliers and, hence, 0.03 km2 of terrain was excluded.
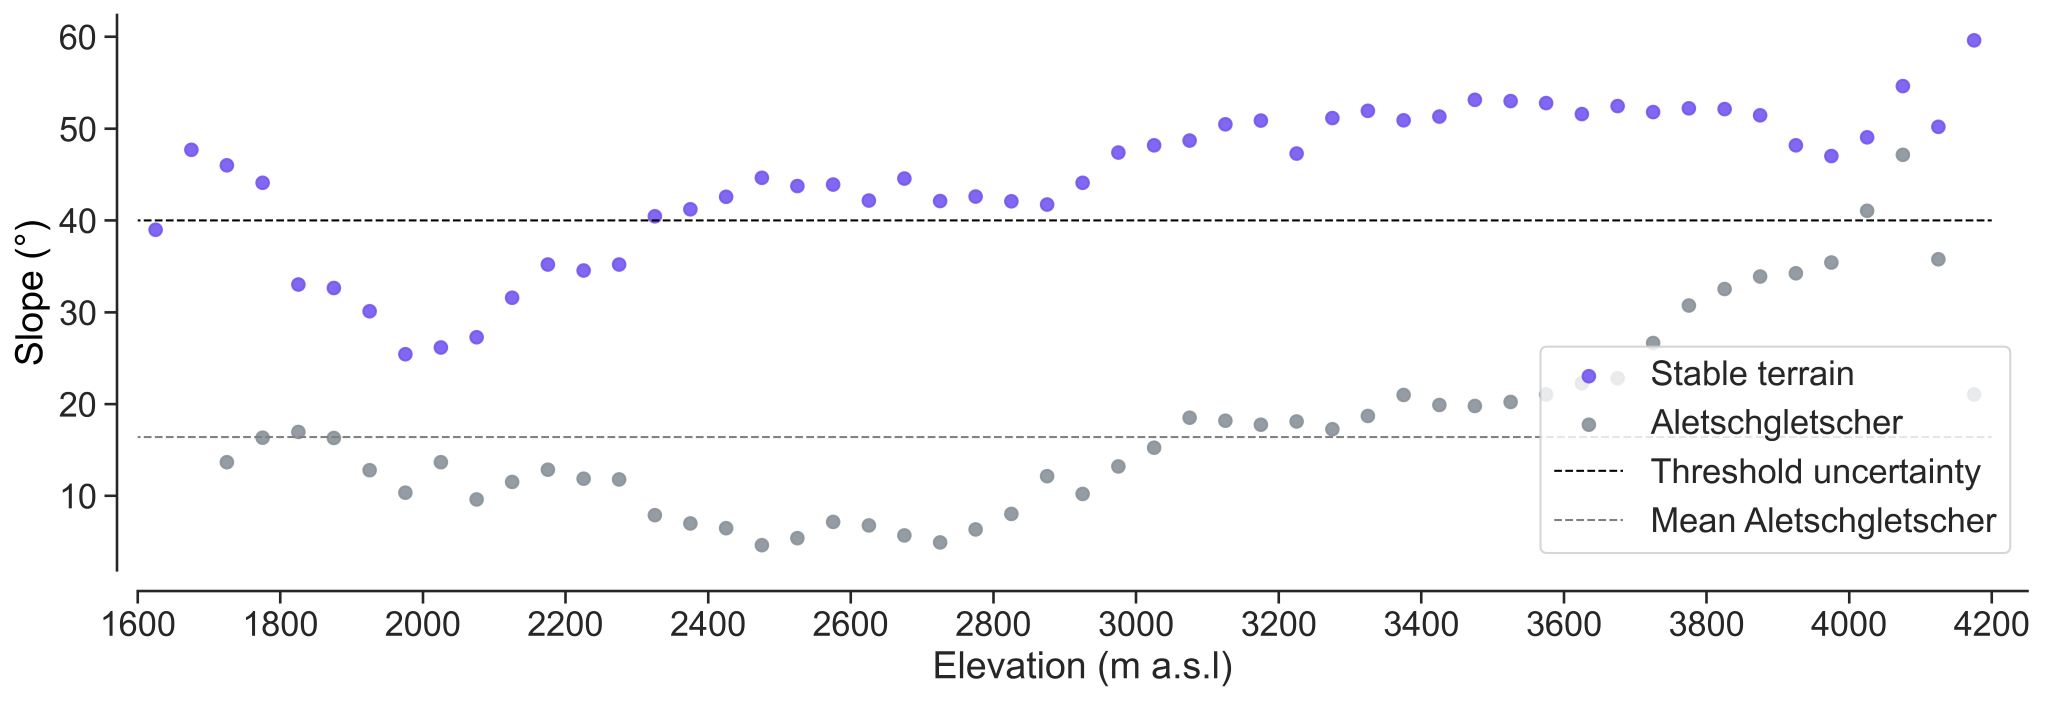
Similarly, after the co-registration of the TanDEM-X DEM to the co-registered Pléiades DEM, we estimated the uncertainty of the TanDEM-X DEM by computing the differences between the TanDEM-X DEM and the Pléiades DEM (i.e. TanDEM-X minus Pléiades) over stable terrain. For the purpose of uncertainty estimation, we excluded stable terrain areas steeper than 40°, as these areas are not representative of the on-glacier error given that the mean glacier slope is ~16° (Fig. S4). Moreover, we excluded absolute elevation differences larger than 50 m (~3.5 km2, Fig. S1).
To describe the precision and accuracy of the DEMs, we used different statistics on the elevation differences between the survey DEMs, i.e. Pléiades and TanDEM-X, and the reference data, i.e. airborne DEM, dGNSS and the co-registered Pléiades DEM: (a) their mean and median to evaluate the vertical accuracy of the DEMs and (b) their std dev. (SD) and the normalized median absolute deviation (NMAD) to assess their vertical precision. The NMAD is a metric for the dispersion of the data (also at the 1σ confidence level), which is less sensitive to outliers than the SD, and is recommended for use in DEM precision assessments (Höhle and Höhle, Reference Höhle and Höhle2009).

where Δh j denotes the individual elevation differences and m Δh is the median of all Δh j. All these metrics describe the uncertainty of the elevation difference at the individual pixel scale (e.g. Li and others, Reference Li2021b). However, for spatially averaged elevation differences, the spatial autocorrelation of the elevation differences should be considered (Rolstad and others, Reference Rolstad, Haug and Denby2009; Hugonnet and others, Reference Hugonnet2022). Using the NMAD from the TanDEM-X–Pléiades differences over snow-free stable terrain would assume fully correlated errors. Even for this conservative assumption, the signal of the radar penetration is still larger than the error and thus significant. Nevertheless, we decided to provide estimates by using the formula below from Li and others (Reference Li2021b), following Rolstad and others (Reference Rolstad, Haug and Denby2009) for the uncertainty of the average elevation difference (σ average) over a specific area (i.e. glacier, elevation bin, etc.), which considers the spatial auto-correlation and, hence, better reflects the (zonal) uncertainty related to the glacier-wide average:

where σ is the dispersion of the elevation difference at the individual pixel scale (taken here as the NMAD (2.59 m, cf. Table 2) of the elevation difference over stable regions), A is the glacier area and d is the autocorrelation length of the elevation difference over stable regions, which can be derived by fitting a spherical semivariogram model to an empirical semivariogram of the samples (Rolstad and others, Reference Rolstad, Haug and Denby2009). The derived value for d is 43 m. As this formula does not consider spatial correlation of errors at multiple (e.g. longer than 43 m) spatial scales, the glacier-wide uncertainties reported here (σ average = 0.01 m) might be underestimated (Hugonnet and others, Reference Hugonnet2022).
Table 2. Statistics of the elevation differences after the co-registration between the Pléiades DEM and the airborne DEM over stable terrain (Pléiades–swissALTI3D), between the Pléiades DEM and dGNSS measurements (Pléiades–dGNSS), as well as between the TanDEM-X DEM and the Pléiades DEM (i.e. TanDEM-X minus Pléiades)

For our uncertainty assessment, we used the NMAD and excluded slopes >40° and outliers, i.e. pixels for which the absolute elevation difference is larger than ±50 m (Fig. S1).
The total uncertainty (at the 1 σ confidence level) is calculated as:

where σ coreg is the standard error (0.48 m) of the glacier-wide results from the co-registration intercomparison exercise.
2.7 InSAR signal penetration
Penetration of the InSAR signal into snow and firn biases the surface of the TanDEM-X DEM downwards. The estimation of the radar penetration is therefore essential to accurately calculate the glacier mass balance when applying geodetic methods based on a radar-derived DEM. The penetration of the radar signal into the glacier subsurface (snow, firn and ice) depends on the incidence angle and wavelength of the radar pulses, as well as on material properties like surface roughness and permittivity. The terms and definitions of radar penetration and related processes vary across the literature. Here we use DEM differencing to quantify the elevation difference (dh) between the TanDEM-X DEM and the Pléiades DEM, henceforth called elevation bias due to radar penetration. It is of importance that this bias is caused by the elevation offset of the InSAR phase centre when processing only with the height of ambiguity H a assuming signal propagation in air (Table 1). For direct comparison with the GPR, snow pit and snow core measurements, one has to assume a signal propagation velocity within the snow and ice medium, which will lead to a smaller height of ambiguity in the snow volume $H_{{\rm a}_{{\rm vol}}}$ (see section 2.3.1) and a reduced actual penetration depth. We call the depth of the recalculated phase centres the penetration depth. This is different from the penetration length, which is the actual radar penetration in the direction of the signal into snow and firn (Fig. 2). To summarize and clarify, the elevation bias (calculated with H a) is therefore the error of a radar DEM when the penetration is not explicitly accounted for. In contrast, the penetration depth (calculated with $H_{{\rm a}_{{\rm vol}}}$
 ) is medium-dependent and corresponds to the actual depth of the radar DEM below the surface, which allows the comparison to the in situ depth measurements.

Figure 2. Geometrical illustration of the elevation bias due to radar penetration (dhDEM) and the penetration length (L radar), as well as the effect of flat (a) and inclined (b) surfaces on depth measurements. When the surface is inclined, the depth values originating from the GPR (dhGPR, perpendicular to the surface) have to be recalculated (depth||) before comparing with dDEM values. dhsnow = vertical depth from snow measurements, α = incidence angle, β = slope.
An InSAR signal penetrating into snow and firn is prone to volume scattering, i.e. scattering from multiple indeterminable scatterers, resulting in a loss in coherence. The elevation information in an InSAR DEM is determined by the scattering phase centre that results from the coherent combination of all backscattered signals from the snow and firn volume within the same resolution cell of the InSAR scene. For glaciological applications, we are usually interested in the bias determined by the depth of the phase centre, and not the radar signal penetration length along the radar line-of-sight.
To calculate the elevation differences between Pléiades and TanDEM-X, we subtracted the Pléiades DEM from the TanDEM-X DEM, resulting in the difference DEM (dDEM). As there were no significant changes of the glacier surface during the 29 h separating the acquisitions of the Pléiades and TanDEM-X DEMs in this region, negative values mean that the measured TanDEM-X phase centres (i.e. surface of the TanDEM-X DEM) lie below the Pléiades surface. Values larger than ±50 m in the dDEM are considered as outliers and, hence, were removed. Further, on the tongue of Grosser Aletschgletscher we encountered a bias in the dDEM originating from the phase unwrapping during the TanDEM-X DEM production. This resulted in very strong and unrealistic positive elevation differences at the tongue (up to 50 m). Therefore, on-glacier we additionally removed positive differences larger than 5 m. Thereupon, the negative differences can be attributed to the elevation bias due to radar penetration. Next, we calculated the elevation differences in each 50 m elevation bin, as well as the non-void-filled glacier-wide average bias. To compare the bias with glacier-wide elevation differences, it is necessary to calculate a void-filled glacier-wide average bias. Therefore, we filled the voids per 50 m bin by the mean hypsometric method (cf. McNabb and others, Reference McNabb, Nuth, Kääb and Girod2019; Huber and others, Reference Huber, McNabb and Zemp2020). To consider the entire glacier area, we assumed the elevation difference of the bins with <0.1 km2 data coverage below 2125 m to be the same as of the respective bin off-glacier and for the single bin above 3925 m to be the same as of the adjacent elevation bin on-glacier.
As a measure for the actual radar penetration depth, the previously calculated elevation bias due to signal penetration is scaled proportionally with $( H_{{\rm a}_{{\rm vol}}}/H_{\rm a})$ (~78%).
2.8 Combining field data with satellite data
By comparing the dDEM with GPR, temperature and density profiles, we investigated whether there are characteristic discontinuities in the glacier surface explaining the location of the scattering phase centre. This comparison can be made directly in the case of a flat glacier surface (Fig. 2a). However, in sloped areas dh values are still vertical, whereas the GPR always measures perpendicular to the surface. Hence, depth values from the dDEM and the snow profiles describe (geometrically) a different distance than the depths from the GPR (Fig. 2b). This can be solved by using the slope and applying trigonometry to align the depths from the GPR measurements with the elevation differences. Whether this effect becomes significant depends on the slope of the investigated area and the magnitude of the observed signal. In our case, the average slope of the GPR measurements was 7.7° and 75% of the measurements were below 10°. As a result, the deviation of the depth values is within the uncertainties of the GPR and dh measurements, and is thus insignificant.
We first analysed the elevation difference data in the context of the GPR profiles. To compare visible layering in the radargrams with the elevation differences, we extracted the elevation differences from the dDEM along the GPR profiles. We then overlaid the extracted dh values and radargrams to show if the TanDEM-X scattering phase centre coincides with certain layers, i.e. discontinuities of dielectric properties of the snow and firn. Further, we wanted to investigate if the TanDEM-X scattering phase centre is typically above, at, or below the previous year's summer surface.
Next, we combined the elevation difference data with the density and temperature profiles from the individual snow cores and pits. To do so, we extracted the elevation difference from the dDEM by calculating a mean of the nine pixels at and around the location of the point measurements.
3. Results
3.1 Co-registration and remaining uncertainties of the spaceborne data
The statistics after the co-registration of the Pléiades DEM to the airborne DEM and the TanDEM-X DEM to the Pléiades DEM are given in Table 2 and Figure S1. The comparison of the Pléiades DEM with the independent dGNSS measurements confirm the relevance of the co-registration as the bias is reduced from almost 1 m to ~10 cm, indicating a very high accuracy. The metrics for dispersion (SD and NMAD) are reduced to <0.5 m. The co-registration of the TanDEM-X DEM to the Pléiades DEM expectedly reduced the bias from more than a metre to only a few centimetres. The vertical precision of the TanDEM-X, or random error described by the SD and the NMAD, also improved slightly through the co-registration, for example, from 3.73 to 2.59 m for the NMAD. As the remaining biases are much smaller than the random uncertainty of the dGNSS measurements and the DEMs, the resolution of the DEMs and the expected magnitude of the observed signal, we did not additionally shift the DEMs by a few centimetres. Besides, the mean slope of the stable terrain is much steeper (30° or 51° when including slope steeper than 40°) than on glacier terrain (16°). In fact, the metrics have been shown to be of higher precision on-glacier than over stable terrain (Berthier and others, Reference Berthier2014; Hugonnet and others, Reference Hugonnet2022). For further assessments, for example, to quantify the uncertainty of the spatially averaged elevation differences, we used σ total (0.48 m), which combines uncertainties of the DEMs and due to co-registration as described in section 2.6.
3.2 Elevation differences and signal penetration
Figure 3 shows the dDEM between the TanDEM-X (30 March 2021) and the Pléiades (31 March 2021) DEMs for the entire study area. Data voids cover ~30% of the glacier area and result from the removal of (a) artefacts in the TanDEM-X DEM (see 2.3.1) or (b) outliers in the dDEM (see 2.6). We first examined the average elevation differences observed off-glacier, excluding stable terrain and slopes steeper than 40°. Figure 4 shows the elevation difference between the TanDEM-X and the Pleiades DEM for 50 m elevation bins off-glacier from 1825 up to 3975 m. Values from bins outside this range are excluded since their areas are <0.1 km2. Negative elevation differences indicate that the TanDEM-X DEM is below the Pléiades DEM. With increasing elevation, elevation differences become increasingly negative, consistent with greater snow depths at higher elevations, due to increased snowfall with elevation as shown by Grünewald and others (Reference Grünewald, Bühler and Lehning2014). Increasing snow depths with elevation are also visible in the radargram in Figure 5c: the seasonal snow layer as well as snow layers from previous years are building up towards higher altitudes (from left to right in the radargram). We compare these elevation differences with snow depth measurements that were conducted by the Institute of Snow and Avalanche Research (SLF) on 31 March at seven locations in the proximity of Grosser Aletschgletscher. Five of them are indicated in Figure 1, two are ~6 and 12 km further west. These off-glacier snow depth measurements are given in Figure 4 as negative values. They are point measurements; it is known that especially in mountainous terrain, there is large spatial variability in snow thickness as a result of the interaction of wind, precipitation and radiation with the underlying topography (e.g. Luce and others, Reference Luce, Tarboton and Cooley1999). Nevertheless, the snow height measurements are in good agreement with the differences between the DEMs. This suggests that the TanDEM-X radar signal penetrates through the winter snowpack and is reflected at the ground below the snow.

Figure 3. Elevation differences between the TanDEM-X (30 March 2021) and the Pléiades (31 March 2021) DEMs. Negative values indicate that the elevations from TanDEM-X are below the ones from Pléiades. The off-glacier area includes both snow-covered (~87%) and snow-free terrain (~13%). Data voids result from the removal of artefacts in the TanDEM-X DEM or outliers in the dDEM (see methods). Black line in the histogram represents the mean (−5.59 m), dashed line marks 0 m. The 2010 glacier outlines are from Fischer and others (Reference Fischer, Huss and Hoelzle2015), the 2021 outline was manually adjusted based on the GLIMS outlines from 2015 (Paul and others, Reference Paul2019) and the Pléiades orthophoto. Background: Hillshade of the airborne DEM swissALTI3D. Below, extracts of the Pléiades orthophoto and of the dDEM illustrate common snow patterns: (1) the groomed areas in front of Jungfraujoch, the groomed path to Mönchsjoch, and an ice avalanche deposit north of that path, (2) avalanche deposits on the Grosser Aletschfirn, and (3) longitudinal surface undulations. These three particular contexts apparently have an impact on radar penetration.

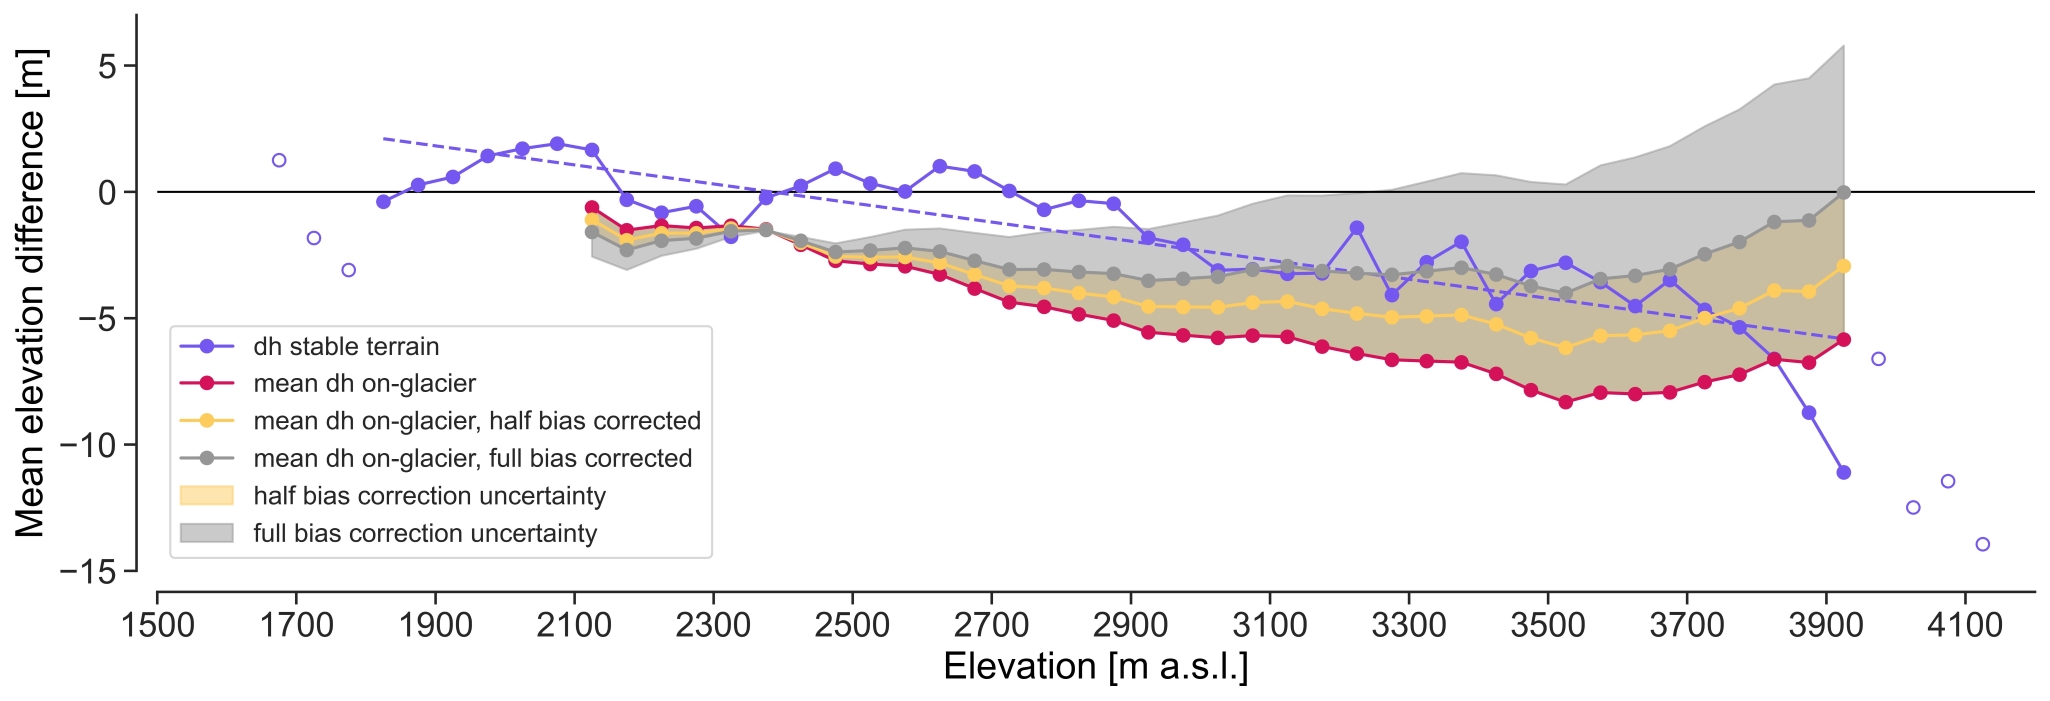
Figure 4. Mean elevation difference (dh) between TanDEM-X and Pléiades DEMs measured on-glacier (red dots) and measured on snow-covered areas off-glacier (cyan dots, stable terrain and slopes steeper than 40° are excluded) per 50 m bin, shading of the line plot refers to the bin-wide uncertainty. Mean elevation differences corrected for half and full of a potential elevation-dependent bias (cf. section 4.1) are shown as dashed and dotted red lines, respectively. Glacier area observed (dark grey bars) and voids (light grey bars) for 50 m bins of Grosser Aletschgletscher. Purple dots refer to snow height measurements (as negative values) from SLF snow stations close to Grosser Aletschgletscher at the time of the DEM acquisitions (source: SLF-Messdaten © 2022, SLF). Blue dots refer to the average coherence on-glacier per 50 m bin. Note the positive elevation differences south of the glacier tongue that are related to forest areas (Fig. S1, Praks and others, Reference Praks, Antropov and Hallikainen2012; Piermattei and others, Reference Piermattei2019).

Figure 5. Combination of the processed GPR profile with the penetration depth (black line). Purple signatures represent different reflectors (e.g. crusts, ice layers). These are the profiles where we walked on the Jungfraufirn westwards towards the Jungfraujoch (a), then eastwards (b), on Ewigschneefeld downwards (c) and upwards (d). The black arrow in (a) points to crevasses visible in the radargram. Stacked-parallel-line artefacts come from the overlay of multiple signals during survey breaks when the device continued to measure on spot.
On ice, the non-void-filled glacier-wide average bias due to radar penetration is −5.59 ± 0.48 m. The corresponding glacier-wide average penetration depth (i.e. depth of the recalculated phase centres, see section 2.7) is −4.39 ± 0.48 m. We observe that the elevation difference gets progressively more negative with elevation (Fig. 4). The differences on-glacier are similar to the elevation differences on snow-covered areas off-glacier up to ~2750 m, which is just below the equilibrium line altitude (ELA), estimated to be at 2965 m in 2020/21 (GLAMOS, 2021). This indicates that the TanDEM-X signal penetrates through the seasonal snow and the scattering phase centre coincides with the ice surface below the snow pack. However, above 2750 m the elevation differences are much more negative on-glacier compared to off-glacier and reach between −7 and −8 m above 3400 m. This indicates that the TanDEM-X radar signal penetrates not only into the seasonal snowpack but also deeper into the firn below the last summer horizon. A potential explanation why the on-glacier penetration bias decreases above 3550 m is given in section 4.3.
Three small-scale patterns are highlighted in Figure 3. First, the elevation differences are smaller at locations where the initial snowpack was disturbed, changed and potentially densified, such as the path or the groomed area in front of the Jungfraujoch or locations of frequent avalanche deposits. Second, due to the convergence of tributaries, several middle moraines and longitudinal undulations from surface runoff are starting at Konkordiaplatz and advancing downwards. These phenomena coincide with striations in the dDEM as a result of the snow accumulated in the troughs, which thereby affects the pattern of radar penetration. However, we note that any residual horizontal offset between the DEMs could also contribute to this feature.
3.2.1 Comparison with in situ data
On 25 May 2021, the winter mass-balance measurements at the mass-balance stake on Jungfraufirn at ~3390 m (location see in Fig. 1) revealed the last summer horizon at a depth of −5.7 m (GLAMOS, 2022). On 30 March, when the summer horizon was certainly less deep than in May, the penetration depth at this location is ~−5.5 m. Based on SLF snow measurements, carried out between our measurements in March and the mass-balance measurement in May, there was ~2–4 m snowfall in the altitude range 2550–2760 m. Assuming a densification of this additional snow from 150 to 350 kg m−3 and of the winter snow pack from 400 to 450 kg m−3 (cf. Fig. 6), we estimate a snow depth at the mass-balance stake on 30 March of <5 m considering for increased snowfall due to the higher elevation. This indicates that the radar penetration depth reached below the last summer horizon.

Figure 6. Snow density (a) and temperature profiles (b) from snow-core and snow-pit measurements, including trendlines, on Jungfraufirn and Ewigschneefeld, in relation to the radar elevation bias. Note that for the trendlines measurements of the first metre are not considered. The locations of the coring and snow pits can be seen in Figure 1. Horizontal lines in panel (b) represent the penetration depths at the location of the respective point measurement.
Figure 5 shows the two radargrams from Jungfraufirn and the two from Ewigschneefeld. They show scattering horizons at various depths in the snow and firn at an altitude of ~3340–3600 m. During summer months, crusts and ice layers form on the snow surface creating the summer horizon. This horizon can cause sharp density contrasts, which are then visible in the radargram (Kohler and others, Reference Kohler, Moore, Kennett, Engeset and Elvehøy1997). Based on the accumulation rate in this area, we consider the first prominent layer in the radargrams between −2.5 and −4 m to be the last summer horizon; several more from earlier years are visible further down in the firn pack to ~−14 m. Plotting the penetration depth into the radargrams (black lines in Fig. 5) shows that the TanDEM-X radar penetration reaches beyond the last summer horizon. Further, the penetration depth does not follow any specific layer in the radargram, especially not on Ewigschneefeld. Where crevasses are present (Fig. 5a), the TanDEM-X signal penetrates even deeper.
Figure 6 shows the density and temperature profiles from the four snow-core and two snow-pit measurements. These profiles are comparable to the ones from earlier studies on Grosser Aletschgletscher (e.g. Hughes and Seligman, Reference Hughes and Seligman1939; Seligman, Reference Seligman1941). The variability in the density profiles is composed of the real signal and measurement uncertainties. Nevertheless, a general increase of densities with depth is evident. A comparison of these densities with the penetration depth at the respective sites is difficult, either because densities are almost the same for all profiles, or the profiles do not reach deep enough for a direct comparison. Regarding the temperature profiles, the uppermost 1–2 m are influenced by recent fluctuations of air temperature. However, below that we see an almost linear increase of the temperature with depth. When adding trendlines to the snow pit and snow core temperature measurements, we found that the observed penetration depths are located between −7 and −1°C.
4. Discussion
4.1 Sensitivity of results to co-registration
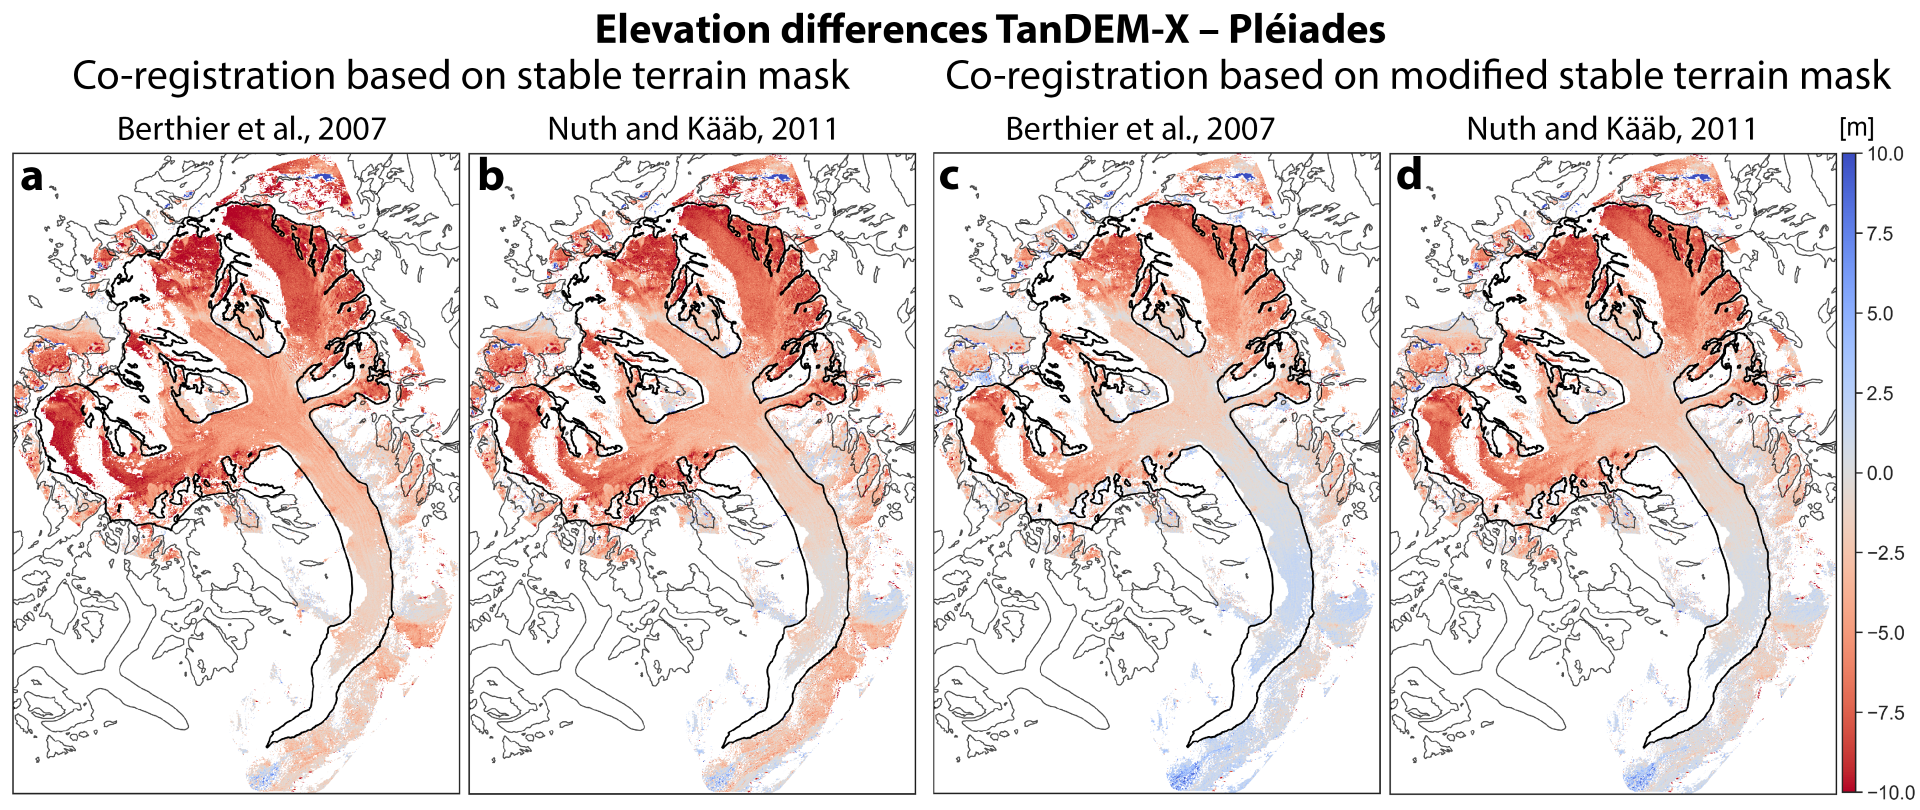
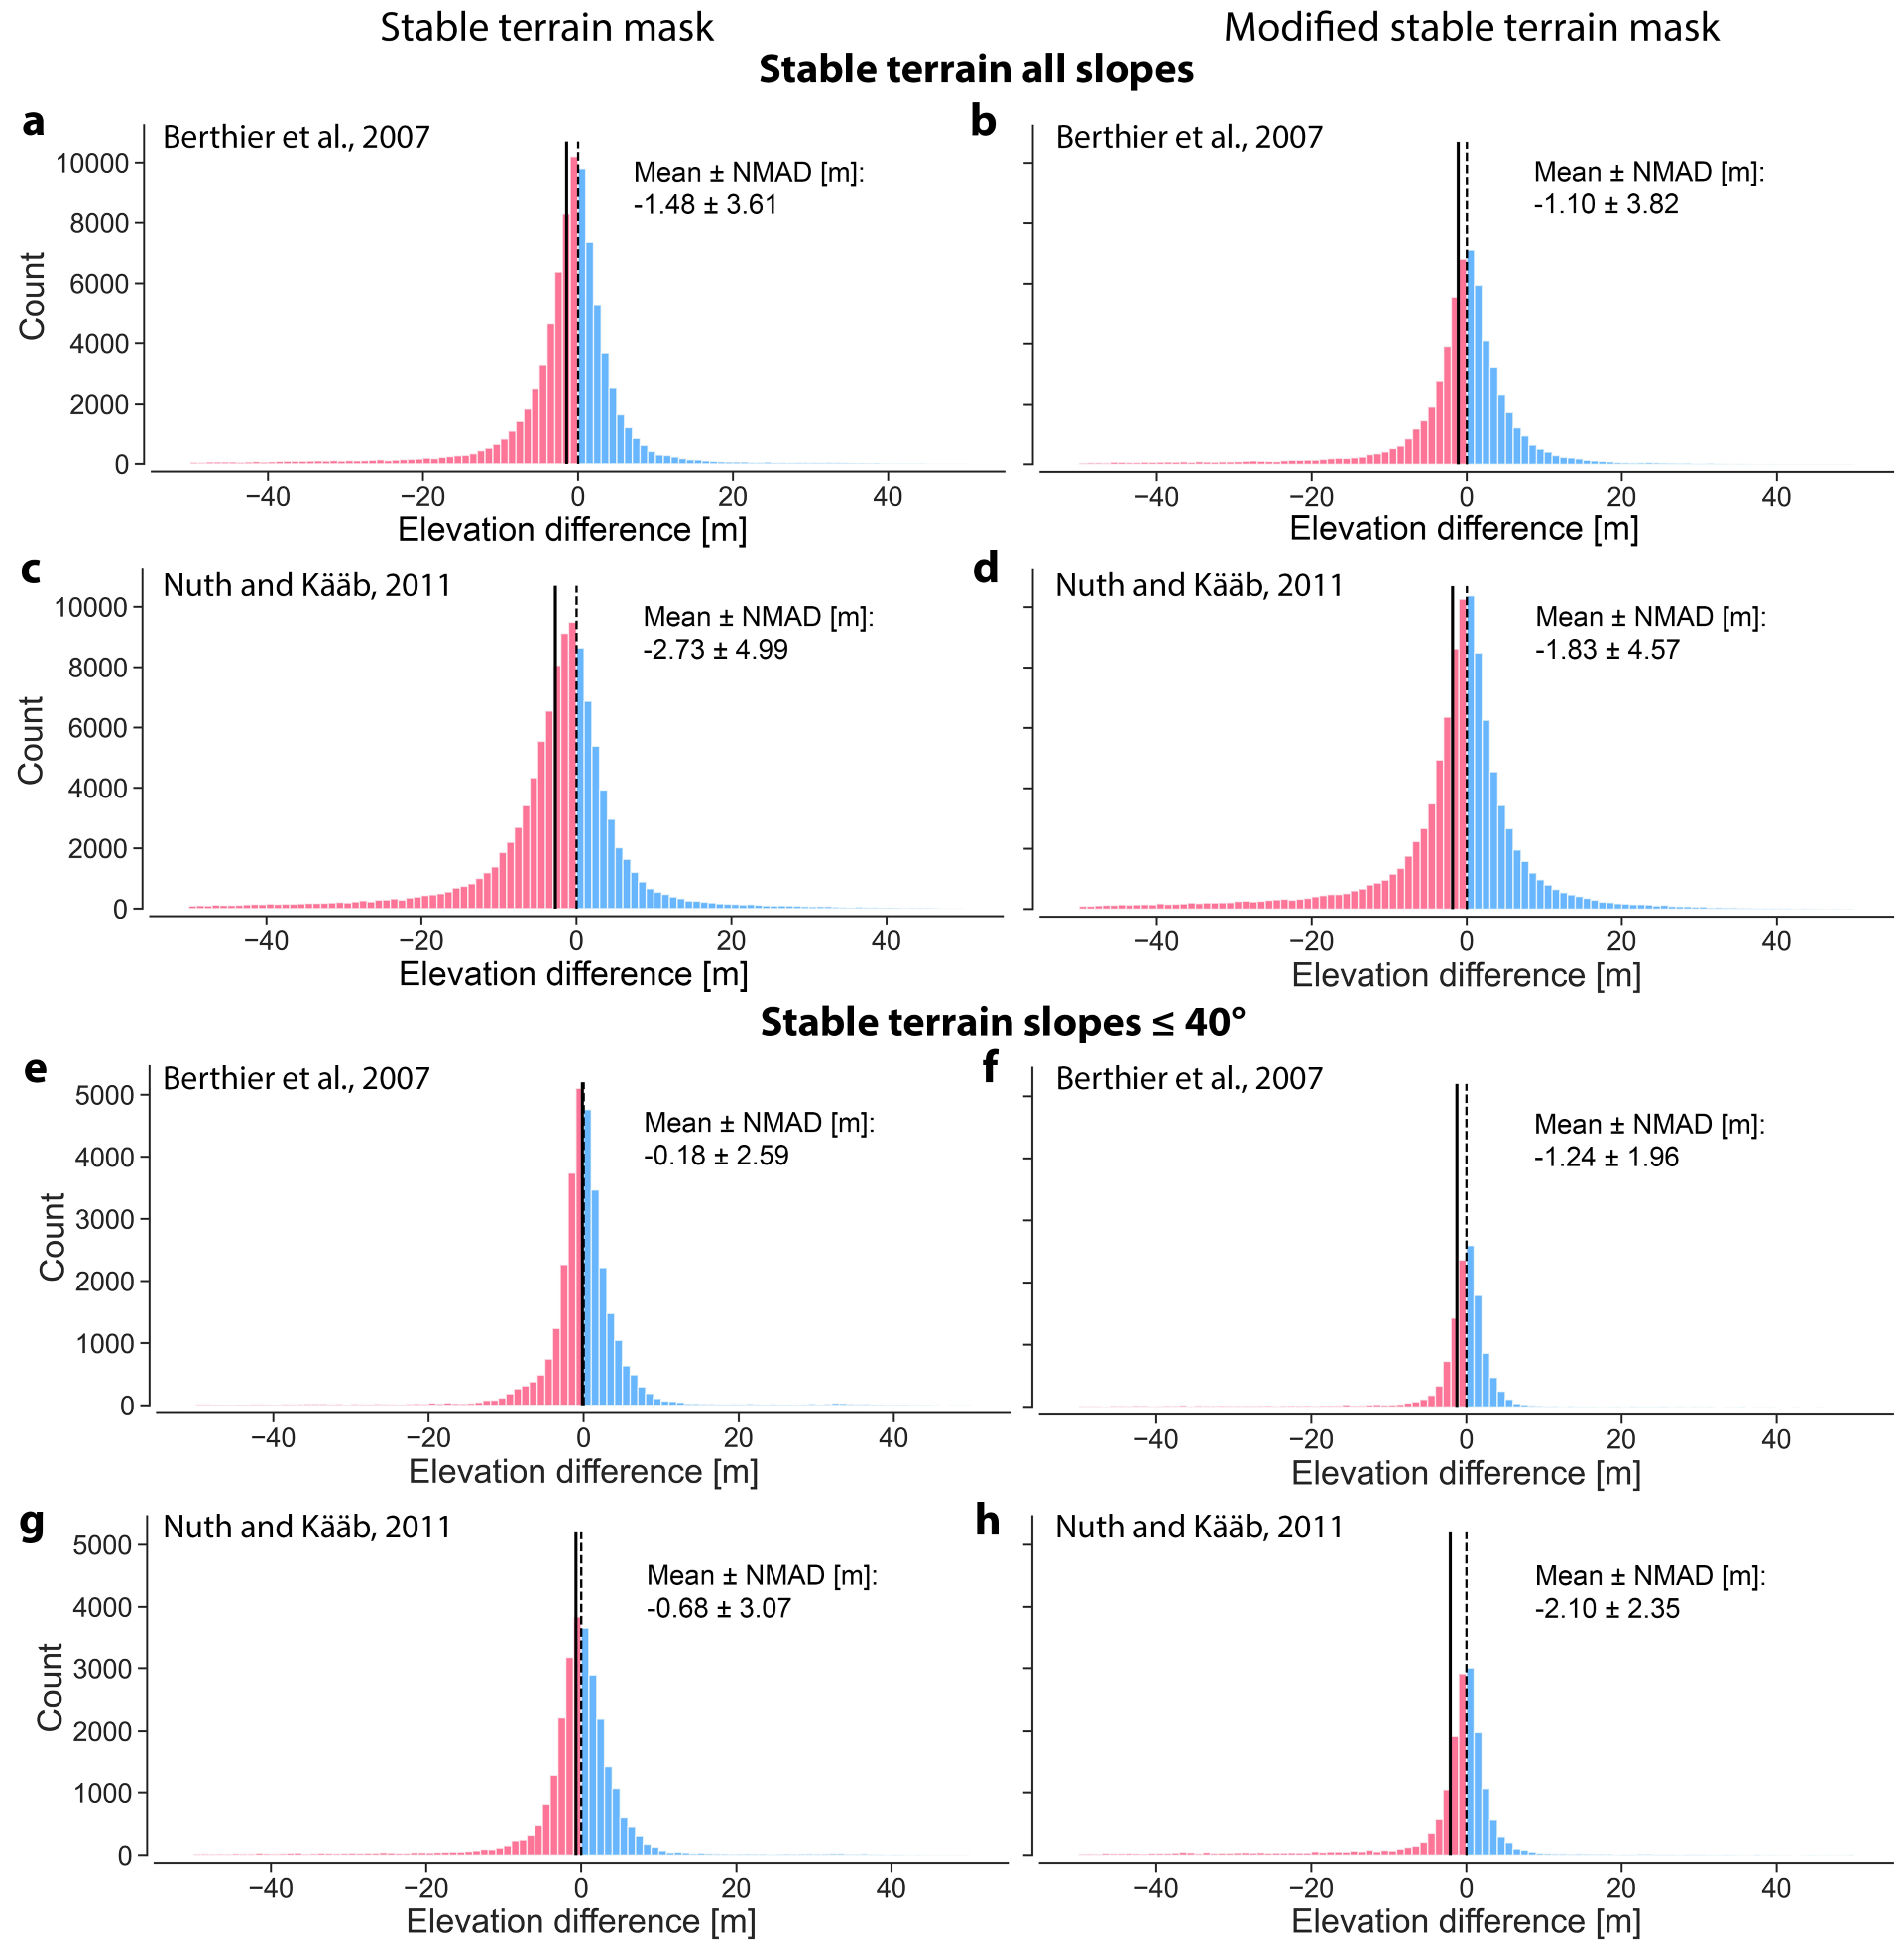
The accuracy of a change assessment depends on the alignment of DEMs (Hugonnet and others, Reference Hugonnet2022; Piermattei and others, Reference Piermattei2023). In our case, this basic step is challenged by the limited availability of stable terrain due to the mountainous terrain and due to the winter scenes with widespread snow cover, which are subject to radar penetration. As a consequence, mapping of stable terrain requires a trade-off between high-confidence elevation values and representative coverage concerning slope, aspect and spatial distribution. We assessed the sensitivity of our results to co-registration with an intercomparison of different stable terrain masks and co-registration methods (Figs S5–S7). This exercise confirmed that both the co-registration method and the selection of stable terrain have an impact on the results. Our solution using well-distributed stable terrain and co-registration following Berthier and others (Reference Berthier2007) performed best with respect to a qualitative assessment of the resulting dh map and related statistics over stable terrain, especially after removing pixels with slopes steeper than 40° (Fig. S6a) and related statistics over stable terrain, especially after removing pixels with slopes steeper than 40° (Fig. S7e), which are not representative for the glacier area (Fig. S4). The corresponding glacier-wide result (−5.59 m; Fig. S6a) is the most negative and differs by 1 and 2.6 m from the results with the alternative co-registration method (Fig. S6c) and modified stable terrain mask (Fig. S6b), respectively (Table S1). The standard error of the four glacier-wide estimates is 0.48 m and represents a first-order estimate of the uncertainty related to co-registration.
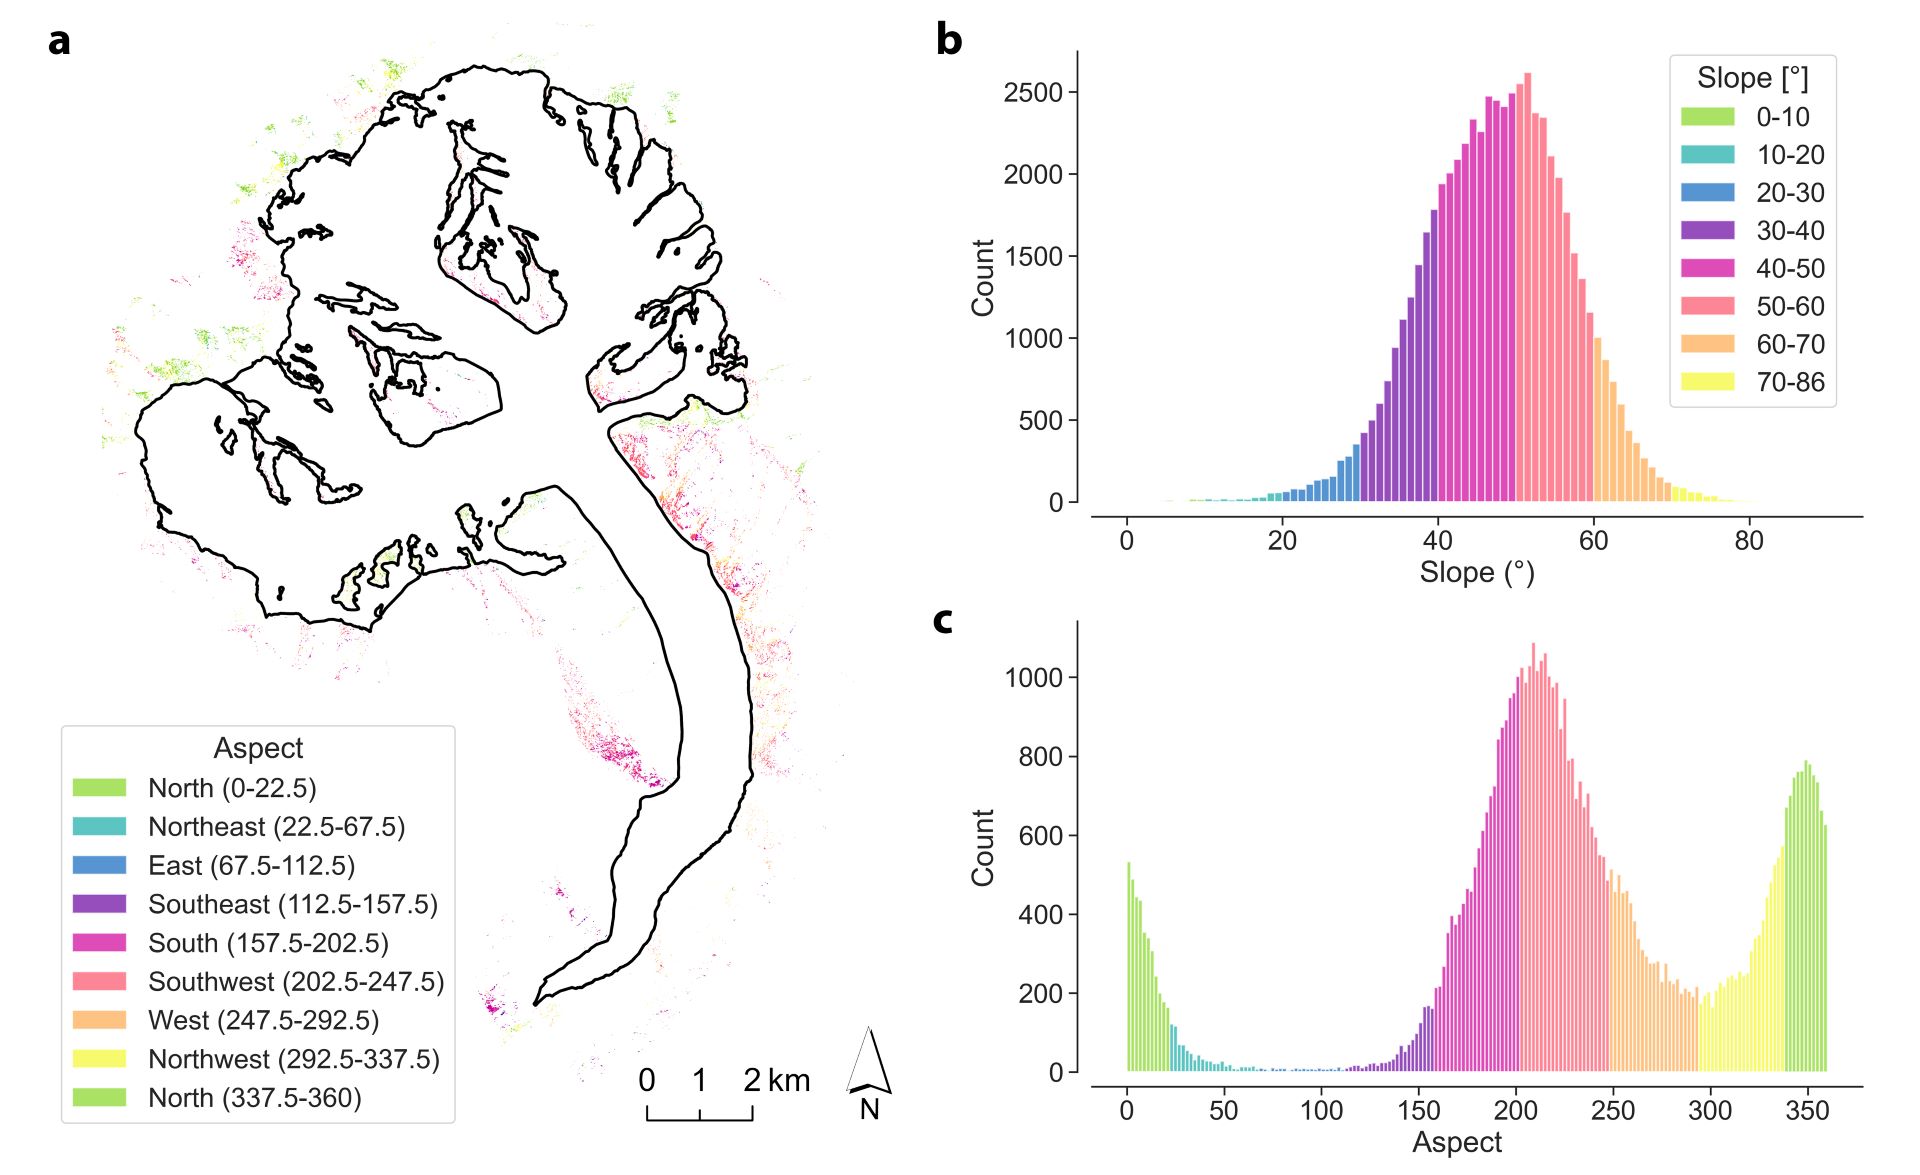
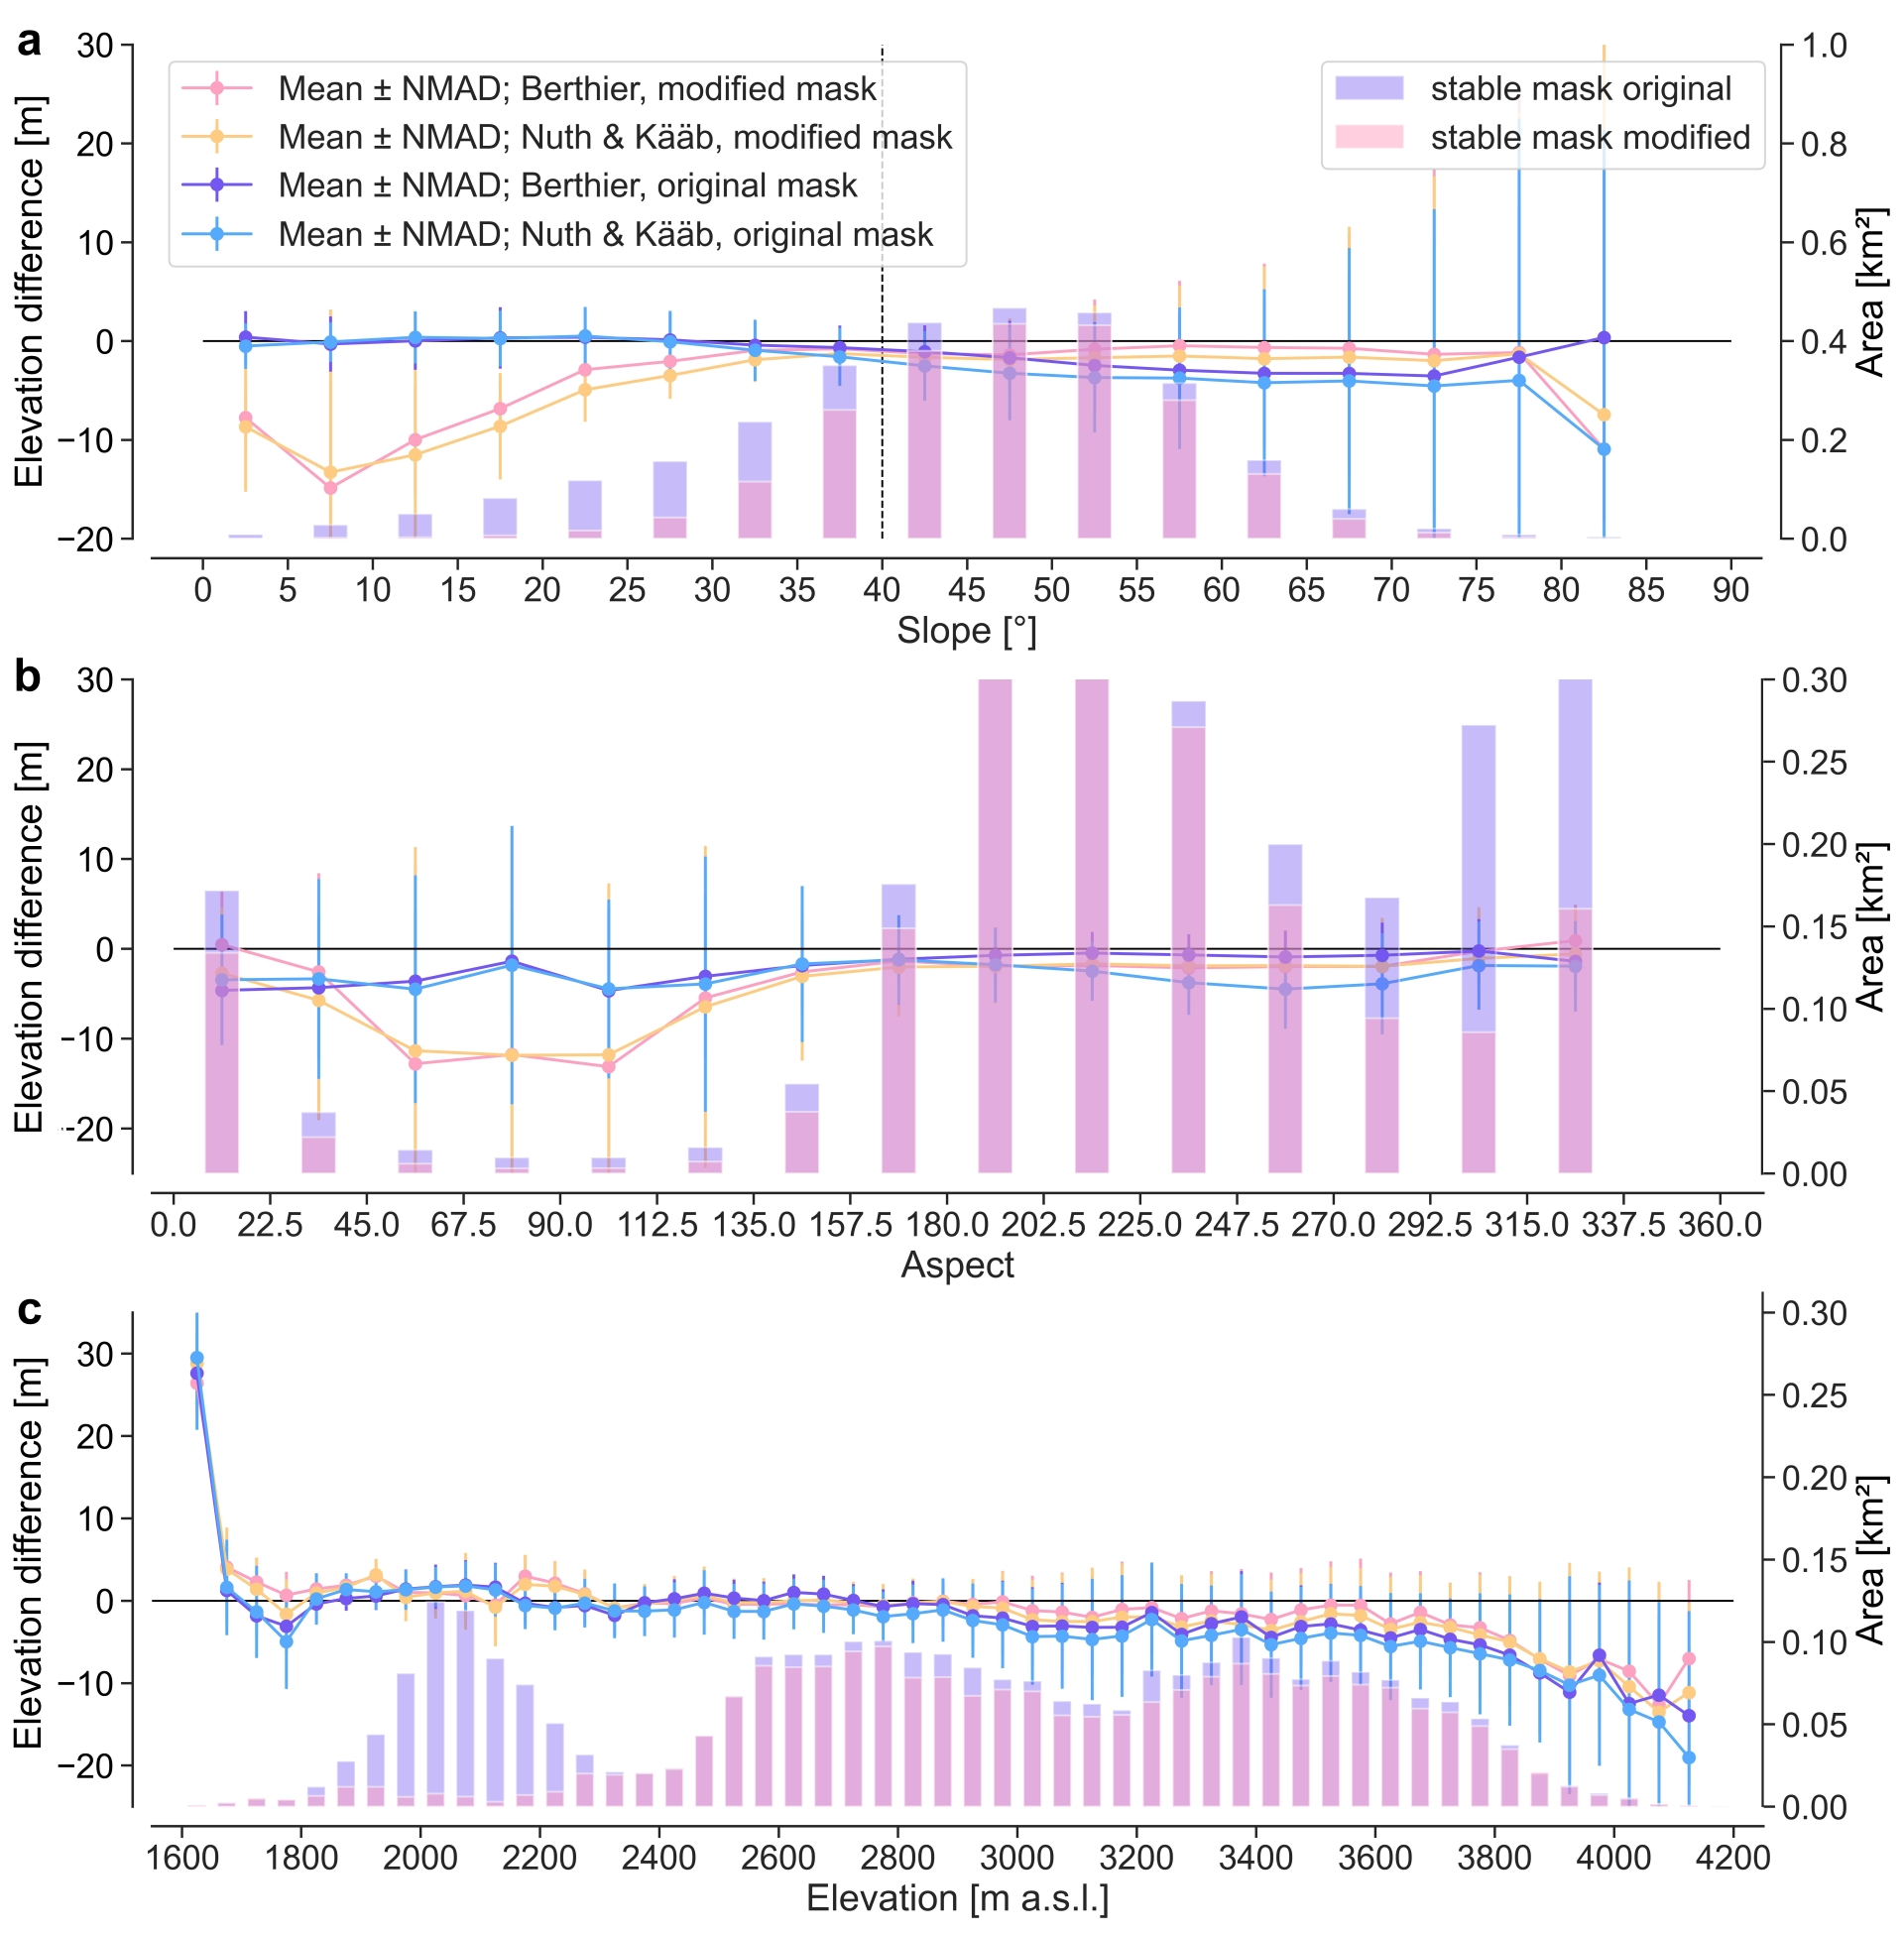
Furthermore, we analysed the stable terrain masks for a potential bias with slope, aspect and elevation (Figs S3, S8). Overall, the mean dh values per elevation bins in general are not significantly different from zero. However, we noticed strong deviations, with large error bars at the lower and upper ranges of slope, aspect and elevation, which are due to the very limited number of pixels in those corresponding elevation bins. An exclusion of pixels with slopes larger than 40° could theoretically improve the statistics for aspect and elevation but in practice resulted in samples that are too small for a proper statistical interpretation (Fig. S4). While not significant, the elevation differences over stable terrain may still indicate potential biases (Fig. S3). In the case of slope, the increasing bias for slopes larger than 40° is not surprising for mountainous terrain. The bias distribution with aspect is partly related to the steep faces in the north-east direction (Fig. S2) but could also indicate a remaining shift in the DEMs. Finally, there is an increasing bias for elevations above 2900 m. Some of the bias can be explained by resolution-dependent scale effects (Paul, Reference Paul2008; Gardelle and others, Reference Gardelle, Berthier and Arnaud2012; Hugonnet and others, Reference Hugonnet2022). This effect is caused by the higher resolution of the Pléiades DEM as compared to TanDEM-X but it should have a limited effect on the glacier area, which has a more gentle terrain. However, we cannot rule out that some of the bias indicates a remaining misalignment of the DEMs, such as tilt, after co-registration. We assessed the impact of such a potential bias correction to the results (Fig. S9). Thereto, we calculated a linear regression through the elevation difference over stable terrain and applied half of the regression values to the dh over the glacier. This approach considers half of the elevation bias to affect the elevation differences over the glacier and half to be due to resolution-dependent scale effects, which are only apparent off glacier. A correction of the full regression bias (Fig. S9, grey line) would substantially reduce the elevation-dependent radar penetration to a few metres and include (within error bars) the possibility of positive elevation differences (i.e. TanDEM-X above Pléiades), which are not considered to be realistic. Applying half (full) of the elevation-dependent bias to the results showed that the mean elevation difference on Grosser Aletschgletscher would be reduced by ~1.30 m (2.60 m) from −5.59 m to −4.29 m (−2.99 m), with a bias correction ranging from ~0.5 m to −2.9 m from the lowest to the highest elevation bin, respectively.
However, we interpret the apparent elevation-dependent bias to be an artefact over the stable terrain but not affecting the elevation differences over the glacier. Hence, we use the uncorrected values in the discussion below. Overall, our intercomparison exercise confirms that co-registration has an important impact on the results (Li and others, Reference Li2023; Piermattei and others, Reference Piermattei2023), especially in cases with limited stable terrain.
4.2. Radar penetration in context
Our results indicate that the TanDEM-X acquisition on Grosser Aletschgletscher from 30 March 2021 significantly underestimates the snow-covered glacier surface resulting in a considerable elevation bias due to signal penetration. The non-void-filled elevation bias due to radar penetration averaged per elevation bin reaches 7–8 m above 3400 m and 5.59 ± 0.48 m on average. The void-filled glacier-wide average, which can be compared to other glacier-wide elevation change values, is 5.75 ± 0.48 m. These values are larger than those from other studies on mountain glaciers. Table 3 gives an overview of previous studies that investigated the elevation bias of TanDEM-X elevations over glacierized regions. Of particular note is that most other studies only report the elevation bias due to signal penetration and not the actual penetration depth because of the strong requirement of having additional height information of actual snow surface at the time of the InSAR acquisition. This requirement could only be met in this study with the quasi-simultaneous acquisitions from Pléiades and TanDEM-X. Dehecq and others (Reference Dehecq2016) indicate the difference can reach 6–7 m at 4800 m a.s.l. at the summit of Mont-Blanc; at 4000 m, the penetration bias was on average 4 m. However, their results were derived from TanDEM-X and Pléiades DEMs (a) with a temporal offset of one month that can, at least partly, explain the differences, and (b) from October and September when penetration is assumed to be less due to a thinner snowpack and the influence of summer melting events. They hypothesize that the bias due to penetration could be larger for radar DEMs acquired in winter, but did not have the necessary reference DEM to support this assumption. Furthermore, they suspected that the radar signal potentially penetrates through the snow accumulated since the last ablation season. The values we found on Grosser Aletschgletscher in spring rather correspond with biases observed in Greenland (Abdullahi and others, Reference Abdullahi2018). Obviously, the penetration is expected to be less during summer. However, operational TanDEM-X DEMs are commonly derived from acquisitions during winter when radar penetration is favoured; in summer, water on the surface results in deficient DEMs.
Table 3. Bias of TanDEM-X elevations over glacierized regions from previous studies

Adapted from Li and others (Reference Li2021b).
The results from this study and from Table 3 indicate that TanDEM-X penetration is highly variable in space and time, and its deduction from other sites or other time periods is very difficult. Recent modelling attempts are trying to close this gap (e.g. Abdullahi and others, Reference Abdullahi2019; Fischer and others, Reference Fischer, Papathanassiou and Hajnsek2020). Here, our dataset could offer an interesting validation opportunity for future studies.
4.3. Governing processes
The capability of the radar signal to penetrate into the glacier surface strongly depends on water content, surface roughness, internal layering, grain size and density of the uppermost snow and firn pack (e.g. Rott and others, Reference Rott, Sturm and Miller1993; Rizzoli and others, Reference Rizzoli, Martone, Rott and Moreira2017; Lambrecht and others, Reference Lambrecht, Mayer, Wendt, Floricioiu and Völksen2018). In general, the snow and firn pack is a highly variable medium and hence the pattern of the radar penetration is spatially as well as temporally highly changeable (e.g. Luce and others, Reference Luce, Tarboton and Cooley1999). Our results show that the bias in DEM difference is smaller off-glacier and at the glacier tongue, where only seasonal snow is present on top of a rough surface consisting of crevassed ice or rock. On the glacier, the bias increases with elevation (see also Dehecq and others, Reference Dehecq2016; Li and others, Reference Li2021b) due to decreasing density, mass heterogeneity, grain size and water content (Li and others, Reference Li2021b). Further, earlier studies (e.g. Dehecq and others, Reference Dehecq2016; Rott and others, Reference Rott2021) suggest that previous summer surfaces could act as strong surface reflectors. We show that crusts and ice layers from the last summer horizons, even from several years back, do not coincide with the surface of the TanDEM-X DEM. This fact, together with the drop in coherence over firn areas at higher altitude (see Fig. 4), also indicates that volume decorrelation occurs. The layers visible in the radargrams or observed ice layers do not reflect the TanDEM-X signals uniformly enough to be considered as the scattering phase centre. In fact, the low coherence suggests a complicated scattering process in which returns can come from various scatterers (e.g. different summer layers, crusts, ice layers) within the InSAR resolution cell. Hence, in the accumulation area of Grosser Aletschgletscher, no individual layer can be identified as the origin of the scattering phase centre. At the same time, favourable conditions for radar penetration do exist in this area, with the TanDEM-X surface being defined by the average of many indeterminable scatterers.
We also investigated if the elevation differences – over the entire glacier – show a tendency to be influenced by slope and/or aspect (e.g. higher differences at northern aspects due to dryer/colder snow). However, we did not find a specific trend due to the small sample of elevation differences per slope and/or aspect. Therefore, we did not remove elevation differences with a specific slope threshold as done by Li and others (Reference Li, Jiang, Liu and Wang2021a).
Figure 4 shows that the on-glacier bias decreases above 3550 m where many very steep slopes are located (Fig. S4). Many studies suggest that the amount of snow is inversely proportional to the slope angle and that no snow accumulates (permanently) above a certain critical angle (e.g. Sommer and others, Reference Sommer, Lehning and Mott2015). Even though we could not identify a slope dependency of the elevation bias, we assume that the reduced accumulation of snow at the steep slopes above 3550 m results in lower biases. In addition, the causing processes such as redistribution of snow by sloughing, avalanching and wind drift also restructure and densify the snow pack potentially resulting in less penetration as also visible in Figure 3. We note that off-glacier, the elevation bias does not show the same decrease above 3550 m. However, this might be due to the small number of off-glacier pixels of the highest elevation bins, which are distributed in the very steep and shady northern slopes of the Jungfrau massif.
Liquid water might also influence TanDEM-X radar penetration in our study area. While at the air/glacier interface the snow was always dry during the measurements, our cores and snow pits revealed neither liquid water nor temperate snow and firn (i.e. temperatures close to 0°C, Fig. 6). Below 2 m depth, all temperature profiles show a roughly linear increase with depth. The temperature trendlines from snow cores and pits show that most of them reach the 0°C line between ~6 and 12 m (Fig. 6). This indicates that there is a high probability of finding small amounts of liquid water at these depths. The penetration depth where we conducted our temperature measurements is ~8 m, a depth where the temperatures range from −7 to−1°C. Hence, the increasing presence of liquid water at depth might have a decisive influence on the signal attenuation, as already shown by Rott and Mätzler (Reference Rott and Mätzler1987). However, how exactly the presence of small amounts of liquid water influences the radar signal needs to be investigated in more detail.
Based on the results presented here, the scattering phase centre of the TanDEM-X lies beyond the seasonal snow pack during winter acquisitions of Grosser Aletschgletscher, as is probably the case in other years. We assume the same would be true for other regions with similar climatic conditions and accumulation rates. Nevertheless, as mentioned before, snow and firn have highly variable characteristics. Therefore, it would be valuable to perform the same analysis throughout the seasons, keeping the locations fixed to see how the pattern of radar penetration changes seasonally and even over several years, not only for Grosser Aletschgletscher but also for other glaciers too.
4.4. Volume change estimates: potential impact and corrections
Comparing the concurrent TanDEM-X and Pléiades DEMs and filling the voids in the dDEM, we calculated a glacier-wide elevation bias due to radar penetration of −5.75 ± 0.48 m in March 2021 on Grosser Aletschgletscher. This value can be compared to other glacier-wide elevation change values. The impact of this bias on calculating the annual geodetic volume change depends on the length of the observation period (i.e. time period between the DEM acquisitions). With a common observation length of 10 years, the absolute bias would be 0.58 m a−1, which is outside the range of elevation change uncertainties proposed in the literature (0.02–0.42 m a−1, e.g. Fischer and others, Reference Fischer, Huss and Hoelzle2015; Rankl and Braun, Reference Rankl and Braun2016).
Based on previous studies, the mean thickness change rate of Grosser Aletschgletscher since 1980 is ~−1 m a−1 (e.g. −0.86 m a−1, Fischer and others, Reference Fischer, Huss and Hoelzle2015; −1.2 m a−1, Sommer and others, Reference Sommer2020; −1.08 m a−1, Kropáček and others, Reference Kropáček, Neckel and Bauder2014). What would be the impact of the bias on the calculation of such geodetic elevation change rates if an uncorrected winter InSAR DEM in combination with a DEM exempt from penetration (i.e. originating from topographic, optical or laser altimetry data) was used? For a 5-year observation period, the bias and the signal would be approximately equal. For a 10-year observation period, the error due to the bias would be 58% of the signal, and for a 30-year period the error would be 19% of the signal.
When performing geodetic elevation and volume change measurements with one radar DEM acquired in winter, the potential error is substantial and needs to be corrected. To minimize this systematic error, our two main recommendations are: (1) use only InSAR DEMs from the same time of the year to favour similar penetration and reduce seasonal elevation changes. However, radar penetration might change over years. Hence, the temporal evolution of radar penetration should be further investigated. (2) Use InSAR DEMs from the end of summer. However, also at the end of summer radar penetration might occur (e.g. Dehecq and others, Reference Dehecq2016). The effectiveness of these measures has to be further investigated. Often winter InSAR DEMs are used due to the limited DEMs available. In this case, we suggest using long observation periods; the signal in elevation change then becomes stronger and eventually dominates over the measurement error. Based on our results, we suggest considering the following criteria for potential X-band bias corrections (i) the bias increases with elevation, (ii) below the ELA, the bias correlates with the snow depth, and (iii) above the ELA, penetration is substantial but depends on a variety of snow properties.
Models have great potential to contribute to a better understanding about the interactions between the radar signal and the glacier surface, as they can combine various in situ and satellite data. Such models already exist (e.g. Fischer and others, Reference Fischer, Papathanassiou and Hajnsek2020; Rott and others, Reference Rott2021), though more data from different locations and seasons might be necessary to improve the understanding of the underlying processes.
5. Conclusions and outlook
The InSAR DEM from TanDEM-X is an alternative to optically derived DEMs. Current elevation can be derived from bistatic acquisitions independently of weather and solar conditions. Time-stamped DEMs from bistatic TanDEM-X data offer great value for calculating geodetic glacier mass balances but require proper co-registration and are challenged by radar penetration into snow and firn, especially in winter conditions. The capability of the X-band radar signal to penetrate depends strongly on the characteristics of the snow and firn, which can vary greatly in space and time. In this study, we used the ideal situation where a TanDEM-X DEM and an optical Pléiades DEM of Grosser Aletschgletscher were acquired in March 2021 within 29 h of each other. Within this time window, we also carried out a variety of concurrent field measurements. This situation enabled us to report the actual penetration depth additional to the commonly reported elevation bias due to signal penetration.
The comparison of the TanDEM-X and Pléiades DEM revealed an elevation bias due to radar penetration of up to 8 m above 3400 m and a penetration depth which is typically 22% less. Averaged over the glacier, we find a mean elevation difference of −5.59 m. We note that post co-registration analysis revealed a potential elevation-dependent bias, which we consider to be an artefact over stable terrain not affecting the elevation differences over the glacier. However, applying half (full) of the apparent elevation-dependent bias would reduce the mean elevation difference to −4.29 m (−2.99 m).
The GPR, snow core and snow pit measurements show that there is no single reflector or discontinuity, such as, for example, buried summer horizons inside the snow and firn pack that can be attributed to the scattering phase centre defined as the surface of the TanDEM-X DEM. However, we found indications that it might be associated with the depth where the snow and firn temperature are warmer than −5°C. The effect is possibly related to the presence of liquid water in temperate snow and firn.
Our study confirms that radar penetration can be a major source of uncertainty when assessing geodetic glacier mass balances from InSAR data. A maximum bias is expected when an uncorrected winter InSAR DEM is used in combination with a DEM exempt from penetration. Over a typical 10-year period, the corresponding error in the example of Grosser Aletschgletscher is ~0.58 m a−1 and can make up more than half of the decadal ice-loss rate. This underlines the importance of comparing InSAR DEMs to coincident elevations from stereoscopic, laser or GNSS data to identify and correct potential radar penetration effects in the context of glaciological research.
Bistatic InSAR missions will remain an important data source for glacier mass-balance assessments due to their high spatial and temporal resolution, and spatial coverage. To measure unbiased glacier mass balance from InSAR DEMs and to minimize the bias due to radar penetration, we suggest combining InSAR DEMs from the same time of the year, using InSAR DEMs from the end of summer, and employing long observation periods if an InSAR DEM is combined with a DEM exempt from penetration (e.g. optical, laser, etc.). Potential empirical model-based corrections should consider that the bias (i) increases with elevation, (ii) correlates with snow depth below the ELA and (iii) can be significant above the ELA but highly depends on the internal snow structure.
Supplementary material
The supplementary material for this article can be found at https://doi.org/10.1017/jog.2024.37.
Data
The DEMs from swissALTI3D, Pléiades and TanDEM-X, as well as the DEM of difference (TanDEM-X minus Pléiades, after co-registration), the stable terrain mask and the glacier outlines are made available on Zenodo: DOI: 10.5281/zenodo.11071899.
Acknowledgements
This study is a contribution to the working group on Regional Assessments of Glacier Mass Change (RAGMAC) of the International Association of Cryospheric Sciences (IASC). It was enabled by support from the Swiss Polar Institute (SPI) and BNP Paribas Swiss Foundation as well as from the Copernicus Climate Change Service (C3S) implemented by the European Centre for Medium-range Weather Forecasts (ECMWF) on behalf of the European Commission. E. B. acknowledges support from the French Space Agency (CNES). L. K. and D. F. were supported by the DLR project ‘Polar Monitor’. The TanDEM-X data were provided by DLR through the project XTI_GLAC7746. The snow depth data were provided by the WSL-Institute for Snow and Avalanche Research (SLF). We thank swisstopo for providing the swissALTI3D. The realization of this study, including fieldwork, was only possible thanks to the many helpers in the field, the assistance regarding, among other things, the access to measuring instruments, the data and their analysis, the choice of the study area, etc., as well as additional financial support from a number of institutes and organizations. Therefore, we would like to express our sincere gratitude to the following individuals and institutions (in alphabetical order): A. Bauder, Y. Bühler, P. Brotzer, T. Busche, C. Deschamps-Berger, M. Hoelzle, A. Kneib-Walter, M. Kronenberg, J. Le Breton, S. Leinss. G. Leysinger-Vieli, E. Meier, K. Naegeli, S. Nussbaumer, Y. Roulet, J. Schindler, A. Vieli, D. Wasser, the International Foundation High Alpine Research Stations Jungfraujoch and Gornergrat (HFSJG), the Jungfraujochbahn, and the Swiss Society for Snow, Ice and Permafrost (SEP). We thank P. Alean-Kirkpatrick for polishing the English. We thank the two reviewers for their constructive comments which helped to improve our study and the quality of the manuscript.
Author contributions
J. B., with support of L. P. and M. Z., initiated and coordinated the study, carried out the data analysis and wrote the manuscript. L. K. and D. F. produced the TanDEM-X DEM and contributed to related content. E. B. generated the Pléiades DEM and contributed to related content. J. B., L. P., I. D. and E. B. performed the co-registration and the DEM differencing. C. R. provided support for the processing of the dGNSS data and contributed to related content. H. M. contributed to the analysis of the in situ measurements. J. B, L. P. and I. D. produced the figures. All authors discussed results and commented on the manuscript.


 Open access