


Introduction
Linear elastic-fracture mechanics LEFM is a branch of continuum mechanics which analyzes material failure through the initiation and propagation of sharp daws (i.e. cracks) in a material. A fundamental parameter in LEFM is the crack-tip stress-intensity factor, K I, which under Conditions of plane strain is given by
where σ is the applied crack-normal tension. Y and c are parameters respectively characterizing the shape and size of the crack, and the subscript I denotes the application of crack-normal tension (i.e. mode I loading; Brock, 1986). For materials that do not exhibit R-curve behavior Brock, 1986), the onset of rapid (rack growth occurs when the stress intensity at the lip of the crack reaches some critical value, K Ic, commonly referred to as the plane-strain fracture toughness. Use K Ic as a measure of rock-fracture strength implicitly assumes that continuum mechanics applies and that any region of inelastic deformation near die crack tip (i.e. process Zone) is small in comparison with other characteristic dimensions of the body (e.g. crack length, specimen dimensions; Reference Ingraffea and AtkinsonIngraffea, 1987).
The use of LEFM m analyze crack initiation in ice is well established (e.g. Reference Miller and MillerMiller, 1984) and much of the past work on ice fracture concentrated on measuring the fracture toughness of ice (e.g. Reference Goodman and TabotiGoodman and Labor. 1978; Reference Liu and MillerLiu and Miller, 1979; Reference Nixon, Schulson, Lunardini, Wang, Ayorinde and SodhiNixon and Schulson. 1986; Reference Parsons, Snellen, B, Lunardini, Wang, Ayorinde and SodhiParsons and Snellen (1986). More recent work on the fracture toughness of ice has concentrated on the standardization of testing techniques and the characterization of experimental variables in fracture-toughness testing. As noted by Reference Dempsey, Wei, DeFranco, Ruben, Frachetti, Sinha, Sodhi and ChungDempsey and others (1989a), many earlier investigations of ice-fracture toughness were hindered by experimental difficulties, resulting in unreliable data. Consequently, laboratory measurements of the fracture toughness of ice made prior to 1989 are often characterized by a wide scatter (e.g. Reference Goodman and TabotiGoodman and Tabor. 1978: Reference Liu and MillerLiu and Miller. 1979; Reference Andrews, McGregor, Miller and MillerAndrews and others. 1984: Reference DanilenkoDanilenko, 1985: Reference Nixon and SchulsonNixon and Schulson. 1987). This scatter is thought to reflect the influence of various testing parameters on experimentally determined values of fracture toughness (Reference Dempsey, Wei, DeFranco, Ruben, Frachetti, Sinha, Sodhi and ChungDempsey and others. 1989a. Reference Dempsey, Y, S, R, R, Axelsson and Franssanb). Standardization of testing techniques and characterization of experimental variables by Reference Dempsey, Wei, DeFranco, Ruben, Frachetti, Sinha, Sodhi and ChungDempsey and others (1989a, Reference Dempsey, Y, S, R, R, Axelsson and Franssanb) has recently resulted in more consistent data. However, test methods currently employed are time-consuming and somewhat tedious in that a careful record of each influential testing parameter (e.g. temperature, loading rate, time between machining and testing must be maintained.
In this paper we present results from fracture-toughness testing of ice and firn using a recently developed modified ring-testing method (Reference Thiercelin, Roegiers and Hartman;Thiercelin and Roegiers, 1987), The purpose of this work is to provide a first-order constraint on the fracture toughness of firn and to introduce the modified ring test to the glaciological community. The utility of the MR test arises, because it does not appear to be influenced by many of lhe experimental parameters currently complicating fracture-toughness testing of ice. Because use of the modified ring-testing method is limited (to our knowledge the only published uses of it are in Reference Thiercelin, Farmer, Dacmen, Desai, Glass and NeumanThiercelin (1987). Reference Thiercelin, Roegiers and Hartman;Thiercelin and Roegiers (1987), Reference Thiercelin, Boone, Roegiers, Ingraffea, Herget and SThiercelin and others (1987), Reference Thiercelin, Farmer, Dacmen, Desai, Glass and NeumanThiercelin (1989)), we present an explanation of the technique and mention some of the parameters which might influence results obtained from it. Advantages of the modified ring test in comparison to notch-based test geometries are discussed.
Experimental Procedure
The modified ring (MR) test first presented by Reference Thiercelin, Farmer, Dacmen, Desai, Glass and NeumanThiercelin and Roegiers 1987 and later utilized by Reference Thiercelin, Farmer, Dacmen, Desai, Glass and NeumanThiercelin (1987, Reference Thiercelin1989) is a variation of the well-known Brazilian test in which a cylinder is compressed across the diameter, resulting in longitudinal splitting of the specimen. For the MR test, two diameterically opposed, flat-loading surfaces are machined along the edges of a cylindrical specimen and a hole is drilled in the center of lhe cylinder
(Fig. 1a). Compression applied to the loading surfaces initiates cracks at the top and bottom of the center hole Which propagate parallel to the loading axis (Fig. 1b). In the MR test, loading across the opposing flat surfaces results in a zone of compressive crack-normal stress near lhe loading surfaces. This zone of compression reduces the size of the process zone at the tip of an approaching crack and thereby facilitates accurate LEFM testing of specimens that were previously considered sub-sized (Reference ThiercelinThiercelin and Roegiers. 1987).

Fig. 1 Geometry of the modified ring-test specimen.
The MR test requires a record of the time variation of compressive axial load during deformation of a specimen and a means to calculate numerically the stress-intensity factors in a model specimen with exactly the same geometry as the test specimen. A typical loading curve recorded during the MR test is shown schematically in Figure 2a. Axial load increases at a constant displacement rate until time t 0, when cracks initiate from the top and bottom of the central hole in the specimen. Between times t 0 and t c, the cracks propagate unstably, during which the axial load decreases from σσ i to σac . Fig. 2b). The decrease in load coincident with crack growth occurs because relative to the ram-head displacement rate, crack propagation is essentially instantaneous, simulating a fixed-grips boundary condition (Reference LawnLawn, 1993). As the cracks grow, the mode I stress-intensity factor at the tips of the cracks increases with crack length from time t 0 to t c as shown in Figure 2c. After time t c interaction between the cracks and the crack-normal compressive stress field near the loading surfaces causes the mode I crack-tip stress-intensity factors to decrease with increasing crack length (Fig. 2c). Thereafter, a continuously increasing load is required to drive the cracks (Fig. 2a, b). The maximum in the K 1 versus time curve (K 1max) defines the fracture toughness (KIc) of the material, because it is this value of K I that marks the transition from Unstable to stable crack growth. Figure 3 shows load vs time and displacement vs time output collected during one of our tests.
The critical stress-intensity factor coincides with a minimum in the axial load recorded in the laboratory, which occurs when the cracks reach the critical length, ac . For crack lengths greater than or equal to ac , the process zone is assured to be small in comparison with the crack length because of the influence of the crack-normal compression near the specimen loading surfaces (Reference Thiercelin, Roegiers and Hartman;Thiercelin and Roegiers. 1987). Because the load minimum occurs at a critical crack length, use of the modified ring test eliminates the need for laboratory measurement of crack lengths in determining the unconfined fracture toughness of materials. One simply takes the value of the load minimum recorded during a test, applies that load to a sample in a numerical simulation and calculates a K I versus the crack-length curve corresponding to that specimen geometry and load. The peak in the resulting curve is the fracture toughness of the tested material.
Two competing behaviors are important to consider when designing a MR specimen. Reliable results require a well-defined minimum in the load curve and a corresponding critical crack length that is sufficiently long lo be resolved in the finite-element model. Accurate constraint on the K 1 versus crack-length curve, and hence, K Imax and K Ic determined from finite-element modeling is most easily attained with longer critical crack lengths. Longer critical crack lengths result when the length of the specimen-loading surfaces is reduced. However, for specimens with short loading surfaces, there is a tendency for the cracks to propagate completely to the loading platens, resulting in a load curve with a poorly defined or absent load minimum. Several iterations of laboratory experiments and finite-element modeling are commonly required to determine a specimen geometry that will produce both a well-defined load minimum and a critical crack length which is long enough to allow accurate resolution of KImax in the numerical model. The samples we used have appropriate-dimensions for ice and firn.
Note that the modified ring test measures by determining K Ic by determining K I at the tip of a propagating crack as it crosses the boundary from unstable to stable propagation (Fig. 2c). The crack does not stop propagating at the point where Κ I = KImax because the axial load on the sample is continuously increasing; crack growth continues because the axial load increases above σac (Fig. 2). Although one would ideally like to halt the experiment exactly at σac and compare the observed crack lengths with the critical crack lengths observed in the numerical models, this is not possible because accurate definition of σac requires that the experiment be continued beyond this load level. In practice, one might he able to halt the experiment very near σac but such experiments would require a very stiff servo-controlled loading apparatus which was not available to us.

Fig. 2 Mechanics of the modified ring test. (a) Typical time-varying record of applied stress during a modified ring test. (b) Variation in stress during crack growth in a modified ring specimen. Stress drop results from unstable crack propagation between times t0 and tc. Stress increases after crack reaches a critical length, ac. (c) Variation in Κ1 with time during a modified ring test. All plots are schematic.

Fig. 3 Load (a) and displacement (b) vs time output from a modified ring test on firn specimen number 12.
Numerical modeling
Because the modified ring test utilizes numerical modeling to determine fracture toughness, it is pertinent to discuss the details of the modeling procedure. In this study, numerical simulation was accomplished with the interactive finite-element program FRANC(FRacture ANalysis Code; Reference Wawrzynek and IngraffeaWawrzynek and Ingraffea, 1987) developed at Cornell University. This program simulates the r½ singularity in the crack-tip stress field, where r is the radial distance away from the crack tip, by surrounding each crack tip with a rosette of eight, triangular, quadratic, isoparametric, quarter-point dements (e.g. Reference BarsoumBarsoum, 1976). The remainder of any model mesh is composed of quadratic, isoparametric elements. FRANC is particularly well-suited for analyses involving sequential crack propagation because of the built-in crack growth and remeshing capabilities of the program (Reference Wawrzynek and IngraffeaWawrzynek and Ingraffea, 1987).
For finite-element modeling of a MR test, the important aspects of the modeling procedure include the model boundary conditions, the fineness of the model mesh and the method of calculation for crack-tip stress-intensity factors (Reference Fischer, Elsworth and AlleyFischer and others, in press). The finite-element mesh and boundary conditions we used are shown in Figure 4. Slip was allowed between the specimen and the loading platen, a modified crack-closure integral (Reference Rybicki and KanninenRybicki and Kanninen, 1977; Reference Bittencourt, Barry, Ingraffea, Atluri, Newman, Raju and EpsteinBittencourt and others, 1992) algorithm was used to calculate the crack-tip stress-intensity factors and the crack-tip mesh was refined to a point where the stress-intensity factors did not change with further refinement. Previous uses of the MR test on rock employed constant-force boundary conditions (Reference Thiercelin, Farmer, Dacmen, Desai, Glass and NeumanThiercelin, 1987; Reference Thiercelin, Roegiers and Hartman;Thiercelin and Roegiers, 1987; Reference Thiercelin, Boone, Roegiers, Ingraffea, Herget and SThiercelin and others, 1987) and yield solutions that are Valid for a given Young’s modulus (E) and Poisson ratio (ν). However, as noted by Reference FischerFischer (1994), application of constant force along the specimen-loading surface results in several complications, including an unrealistic non-uniform displacement distribution along the loading surfaces and a significant influence of slip and no-slip boundary conditions on the KImax determined from the finite-element model.

Fig. 4 Finite-element mesh and boundary conditions used in this study. Model is shortened from the top, fixed in the y direction along the entire bottom-loading surface length, and fixed in x and y at the midpoint of the bottom-loading surface. Note that this specific mesh is used only for the synthetic ice specimens. A similar mesh with different dimensions is used for the fracture-toughness tests on the firn.
Because we feel that constant-displacement boundary conditions more appropriately simulate the action of the loading platen on the specimen, numerical modeling in our study is conducted by applying a uniform displacement to the specimen-loading surfaces. The technique we employ follows that of Reference Fischer, Elsworth and AlleyFischer and others (in press) and yields results that are relatively insensitive to slip between the specimen and the loading platen, and that are independent of Young’s modulus and the Poisson ratio of the specimen. In this approach, a series of finite-element models is conducted wherein a crack is propagated hi a model MR specimen with fixed material properties under different magnitudes of constant displacement or the model material properties are varied under a fixed displacement. In each of these models, axial stress (σ) and mode I stress intensity (K I) are calculated during sequential propagation of axial cracks from the central hole in the model specimen (Fig. 5). Reference Fischer, Elsworth and AlleyFischer and others (in press) showed that, although the absolute magnitudes of Κ I and axial stress (σ) vary between each model after each increment of crack growth, the ratio of axial stress to Κ I at any stage of crack growth is a constant, effectively independent of material elastic properties and displacement. This suggests that the ratio of axial stress at the critical crack length, σac, to maximum stress-intensity factor observed in the finite-element model, KImax, be used to determine the fracture toughness of an identical test specimen using the relationship

The fracture toughness of a specimen subjected to constant displacement-boundary conditions is determined simply by dividing the stress measured in the laboratory at time tc (Fig. 2) by the ratio of σac to K Imax determined from the finite-element model. The ratio σac/K Imax has units of (length)-½ and is essentially a shape factor characterizing the geometry of the particular MR specimen analyzed in the finite-element model. This shape factor is analogous to the term

Sample preparation
Two sets of modified ring experiments were conducted to determine the fracture toughness of granular fresh-water ice and firn. Facilities available allowed for only limited precision in all stages of sample preparation. Right-circular cylinders of granular fresh-water ice Ih were manufactured in a several-step process. Dcionized water was first frozen in ice-cube trays at temperatures, between −20° and −25°C. These ice cubes were crushed into angular fragments ranging in size from 1 to 15 mm. The crushed ice was poured into an 18 cm long section of 76.2 mm diameter PVC pipe with a rubber cap on one end. The PVC pipe filled with crushed ice was then filled with supercooled, deionized water and allowed to freeze at −10° to −15°C for a minimum of 12 h. Water used in all stages of specimen preparation was not degassed, resulting in moderately bubbly, granular ice with an average density of 0.891 Mgm−3 and average porosity of ∼3%.

Fig. 5 Variation in ΚI (a) and axial stress (b) which resulted during crack growth when, a modified ring specimen with normalized dimensions of ri/re = 0.1307, 2L = 0.7843, material properties of E = 9GP a and ν = 0.32 is compressed by 0.1 mm. Crack is allowed to propagate in 2mm increments starting at a = 10 mm. Axial stress at a = 0 shown for reference. Note that axial stress does not increase after σac as shown in Figures 2 and 3, because the model is subjected to a constant displacement and the increase in stress recorded in the laboratory is related to the continuously increasing displacement applied is the laboratory. Also note the difference in the horizontal scales, between the two graphs.
An ice cylinder was removed from the PVC pipe by warming at temperatures from 15° to 30°C until the specimen slid easily out of the PVC jacket. The duration of warming varied from 10 to 30 min. Differential melting during this time often resulted in a cylinder that was up to 1 mm narrower at the ends than in the center. Insulation of both ends of the specimen during warming reduced this effect. The final diameter of the cylinders prior to machining was 76.5 ± 0.5 mm.
Figure 6 i s a photograph of a thin section of typical granular, fresh-water ice produced for this study. The grains that resulted were frequently angular, not necessarily equidimensional, and range in size from 0.5 to 15 mm. Grain-size varied in three dimensions within a given cylinder but the average grain-size calculated from six thin sections from four samples using the linear intercept method (Reference UnderwoodUnderwood, 1970) is 2.23 mm and is assumed to be representative of the entire group of samples. Grain c axes within the specimens are assumed to have no preferred orientation. Because the ice that was manufactured does nut physically resemble natural granular ice, which typically consists of equidimensional grains exhibiting a range of sizes in which the difference in maximum and minimum grain-size is less than the average grain-size (Reference AlleyAlley, 1987b), we hereafter refer to our manufactured ice as synthetic ice.

Fig. 6 Photograph of a thin section of granular, fresh-water ice manufactured for this study. Photograph taken in polarized light. Smallest units on the scale at left of the photograph are millimeters.
Shallow core From the Greenland Ice Sheet Project II (GISP2) was used in MR tests to determine the fracture toughness of firn. The firn used in this study is from a 1.2 m long section of the GISP2 Ε core at depths from 26 to 27.2 m, The core was stored at temperatures from −20° to −25°C, except during machining and deformation, which took place at temperatures from −10° to −15°C. The diameter of the care is 130.0 ± 0.5 mm and, assuming the core is a right-circular cylinder with a radius of 65.0 mm, the average density of the core is 0.605 Mgm−3 and the average porosity is ∼34%. These values are in agreement with previously determined densities for GISP2 ice-core firn from similar depths (personal communication from R.B. Alley). The average grain-size of the firn was not rigorously determined but cursory visual examination suggests it is approximately 1 mm (Fig. 7). Grain c axes are assumed to have no preferred orientation.

Fig. 7 Photograph of a thin section of some of the GISP2 firn used in the study. Photograph taken in plane light. Gray areas are H2O ice, whereas the white areas are frozen dimethyl phthalate with which the specimen war impregnated prior to sectioning. Smallest units on the scale are millimeters.
Figure 8 is a photograph showing the MR specimens used for synthetic ice and firn. All firn and synthetic ice specimens were cur to a thickness (W;, Fig. 1a) of 30 ± 0.5 mm and loading surfaces were machined to ±0.5 mm of the desired length (2L; Fig. 1a) using a bandsaw. The porous nature of the firn resulted in irregular edges to the loading surfaces of these specimens such that the width of the loading surface may vary by ±1 mm locally. The loading surfaces of the synthetic ice specimens were smoothed by sanding on a fine (∼0.5 mm square mesh) aluminum screen. We did not smooth the bandsaw cuts on the side of any of tho specimens nor did we attempt to smooth the loading surfaces of the firn specimens. The central holes in the specimens were machined with a hand-held power drill attached to a miniature drill press. Chipping at the perimeter of the hole was common but this was primarily a surficial effect which had no impact on the test results. In the more internal parts of the specimen, the surface of the hole was smooth and free of artificial defects. Centering of the hole proved difficult, with marry holes displaced by ±1mm in the horizontal and/or vertical direction.
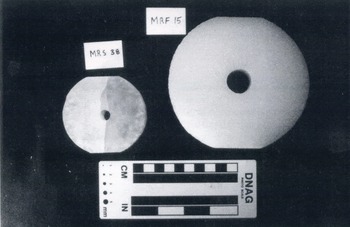
Fig. 8 Two types of modified ring specimens used in this study. Smaller MRS specimen is of synthetic, granular, fresh-water ice. whereas the larger MRF specimen is of firn from the GISP2 Ε core.
The synthetic ice and firn specimens were deformed in a ∼75cm tall load frame designed and built at The Pennsylvania State University and located in a refrigerated laboratory (see Reference FischerFischer (1994) for a detailed description of this apparatus). The load frame is constructed of mild steel and the loading platens are simple flat steel plates. We did not measure the compliance of the machine but note that the combined cross-sectional area of the tie rods connecting the ram to the loading platens is roughly twice the loading surface area of either of the two sample geometries used in this study. We made no attempt to lubricate the specimen–platen interface because, as noted by Reference FischerFischer (1994) and Reference Fischer, Elsworth and AlleyFischer and others (in press), results from numerical models of the modified ring test are essentially independent of the slip conditions at the specimen–platen interface.
The time-varying voltage from a hollow BeCu bad cell and a linear variational displacement transducer were continuously monitored during each experiment in order to maintain a record of the axial load on the specimen and the displacement of the ram head. Because the hydraulic power supply controlling the displacement of the ram head is manually operated, it was not possible to conduct all experiments at exactly equal displacement or loading rates. We nevertheless attempted to maintain similar displacement rates in all experiments and, as shown in Figure 9, the average displacement rate for all the tests was near 0.5 mm min−1.

Fig. 9 Rate of displacement of the ram head during each of the modified ring tests done on synthetic fresh-water ice and firn.
Results
Modified ring tests were conducted on 30 specimens of synthetic ice. Normalized dimensions of the specimens are ri/re = 0.1307 and 2L/r e = 0.7843. The ratio of σac/ K Imax determined for the size of specimen is 15.7880* (Reference Fischer, Elsworth and AlleyFischer and others, in press). Because of machining errors which resulted in asymmetric crack propagation, viable results were obtained from 66% of the specimens. The average K IC determined from these 20 specimens is 145.7 kPam½, with a standard deviation of 24.0 kPa m½ (Fig. 10). The relatively large standard deviation of the results should be significantly reduced with more accurate machining; in particular, the accuracy of positioning of the central hole of the specimen proved critical in obtaining valid, reproducible tests with these smaller samples.

Fig. 10 Fracture-toughness values for each of the modified ring tests done on synthetic, granular, fresh-water ice.
For specimens with holes displaced from the center by 0.5–1.0 mm, crack propagation was not always symmetric in that often Only one axial crack formed or the cracks, did not initiate from the apices of the hole. For cases where the cracks did not initiate from the hole apices, the cracks initiated from the hole perimeter but were displaced 2 or 4 mm clockwise or counter-clockwire from the hole apices. We attribute this behavior partly to machining errors and partly to the inhomogeneity of the synthetic ice samples due to the rather large variation in grain-sizes. Although these were common modes of failure in our experiments, we could not eliminate this behavior because of the limited precision of our machining and sample-preparation facilities. Inclusion of results obtained from these specimens in our final data set certainly increased the standard deviation of the data. In specimens with holes displaced from the center by greater than 1.5 mm, failure did not occur by crack propagation from the hole. Instead, the specimen failed by growth of one or two cracks that extended across the specimen between the loading surfaces, gently curving around the central hole in the specimen. Specimens failing by this mechanism were considered invalid and were not included in the final data set.
We are not aware of fracture-toughness values for firn in the current literature. We conducted our tests on specimens with normalized dimensions of: ri /re = 0.1709 and 2L/re = 0.6154. The ratio of σac/K Imax determined for specimens with these normalized dimensions is 9.7003. Modified ring tests conducted on 20 specimens of firn from a depth of 26–27.2 m in the GISP2 Ε core yielded an average fracture toughness of 108.6 kPa m½, with a Standard deviation of 8.6 kpa m½ (Fig. 11). These results were obtained from a finite-element model assuming constant displacement and slip-allowed boundary conditions (see footnote). Machining accuracy did not play a significant role in determining fracture toughness of the firn because of the larger size of these specimens and because of the uniformly small grain-size of the firn. With larger specimens, uniformly small grain-sizes and larger holes, even error of ±2 mm in centering of the hole did not cause the crack to initiate at the specimen loading surfaces. Larger specimen sizes should be used whenever possible.

Fig. 11 Fracture-toughness values for each of the modified ring tests done on firn from the GISP2 E core.
The behavior of the firn samples was much more consistent than that of the synthetic ice. All specimens failed by the formation of two axial cracks that initiated from the apices of the specimen hole. Like the synthetic ice, firn specimens remained intact after unloading. Cracks in the firn were not visible without the precise combinaron of back and front lighting, oriented at just the right angle to the simple. In this lighting, the cracks were visible as straight, planar, darkened lines that appeared to consist of granulated ice.
Porosity effects
Reference Smith, Schulson, Schulson, Ayorinde, Sinha and SodhiSmith and others (1990) investigated the effects of porosity on the fracture toughness of granular fresh-water ice. In their study, porosity was introduced to the ice by either not degassing the water prior to freezing or by freezing carbonated water. The fracture toughness of samples tested by Reference Smith, Schulson, Schulson, Ayorinde, Sinha and SodhiSmith and others (1990) decreased by 25% over a range of porosities (ϕ) from 0 to 15%. Reference Smith, Schulson, Schulson, Ayorinde, Sinha and SodhiSmith and others (1990) attempted to explain these results in the context of a porosity-dependent Young’s modulus which is well-defined for porous ceramics (e.g. Reference Krstic and EricksonKrstic and Ericison, 1987). And, after deriving a relation between Ε(ϕ = 0) and E(ϕ ≠ 0), Reference Smith, Schulson, Schulson, Ayorinde, Sinha and SodhiSmith and others (1990) used the relation between fracture toughness (K Ic) and critical fracture energy (GIC) (see Reference BroekBroek, 1986) to derive two possible expressions for the porosity-dependent fracture toughness of ice;


According to Reference Smith, Schulson, Schulson, Ayorinde, Sinha and SodhiSmith and others (1990), Equation (3) incorporates the effect of porosity on G Ic whereas Equation (4) neglects it.
Figure 12 shows, the porosity–fracture-toughness relations of Equations (3) and (4) along with the average fracture-toughness values, determined for the two porosities examined in this study. The quality of the fit between the data and the theoretical relations is significantly affected by the chosen value of K IC(ϕ = 0). The best fit between the two data points and the theoretical curves occurs when K IC(ϕ = 0) is roughly 200kPa m½. Although the data do not lie perfectly on the theoretical curves, they clearly support the conclusions of Reference Smith, Schulson, Schulson, Ayorinde, Sinha and SodhiSmith and others (1990) by demonstrating a reduction in K IC with ice porosity. We have requested further samples to allow us to define this relation with natural ice and firn at a variety of densities.
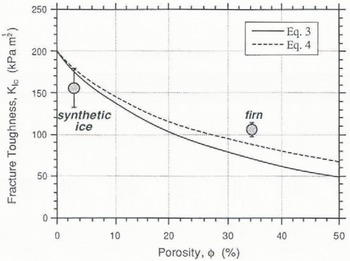
Fig. 12 Correlation between the decrease in fracture toughness with increasing porosity observed in this study with the theoretical curves derived by Reference Smith, Schulson, Schulson, Ayorinde, Sinha and SodhiSmith and others (1990).
The influence of porosity on ice fracture toughness is an important relationship, especially when dealing with near-surface or vertical fractures in ice sheets and glaciers. Because firn density increases with depth, fracture toughness should likewise increase, a result likely to affect the penetration depth and initiation of crevasses. Moreover, lateral variations in firn density may impact on the horizontal distribution of crevasse fields or the trace length of individual crevasses. The future integration of firn-densification models (e.g. Reference Herron and LangwayHerron and Langway, 1980; Reference AlleyAlley, 1987a) with a model of porosity-dependent fracture toughness should further our understanding of the three-dimensional variation of ice-fracture resistance in ice sheets and glaciers.
Advantages of the Modified Ring Test
Prior to this work, nearly all existing data constraining the fracture toughness of ice were generated using test specimens in which K IC is related to the load required to initiate a crack from a notch machined in a test specimen. A variety of test specimens has been used, including compact tension (Reference Liu and MillerLiu and Miller, 1979), tensile- (Reference Parsons, Snellen, B, Lunardini, Wang, Ayorinde and SodhiParsons and others, 1986; Reference Bentley, Dempsey, Sodhi, Wei, Sacki and HirayamaBentley and others, 1988) and wedge-loaded rectangular, double cantilever beam (Reference Liu and MillerLiu and Miller, 1979), three- (Reference Andrews, McGregor, Miller and MillerAndrews and others, 1984; Reference Timco, Frederking, Lunardini, Wang, Ayorinde and SodhiTimco and Frederking, 1986; Reference Wei, DeFranco, Dempsey, Ayorinde, Sinha and SodhiWei and others, 1990) and four-point bending (Reference Dempsey, Wei, DeFranco, Ruben, Frachetti, Sinha, Sodhi and ChungDempsey and others, 1989a; Reference Weber, Nixon, Ayorinde, Sinha, Sodhi and NixonWeber and Nixon, 1992) of single-edge-notched beams, and circumferentially notched cylinders (Reference Nixon, Schulson, Lunardini, Wang, Ayorinde and SodhiNixon and Schulson, 1986, Reference Parsons, Snellen, B, Lunardini, Wang, Ayorinde and Sodhi1987; Reference Smith, Schulson, Schulson, Ayorinde, Sinha and SodhiSmith and others, 1990). In all of these specimens, the mode I stress-intensity factor at the tip of the starter notch increases with increasing load until the stress intensity reaches the fracture toughness of the ice, at which point a crack propagates from the notch. The plane-strain fracture toughness of the ice is proportional to the load at crack initiation.
Existing work on the fracture toughness of ice suggests K Ic of ice is dependent on a variety of extrinsic and intrinsic factors including temperature (Reference Nixon and SchulsonNixon and Schulson, 1987), average grain-size (Reference Nixon, Schulson, Lunardini, Wang, Ayorinde and SodhiNixon and Schulson. 1986), loading rate (Reference Nixon and SchulsonNixon and Schulson, 1987), ice fabric (Reference Parsons, Snellen, B, Lunardini, Wang, Ayorinde and SodhiParsons and others, 1986; Reference Weber, Nixon, Ayorinde, Sinha, Sodhi and NixonWeber and Nixon, 1992), volume fraction of included particulate matter (Reference Smith, Schulson, Schulson, Ayorinde, Sinha and SodhiSmith and Others, 1990), notch acuity (Reference Wei, DeFranco, Dempsey, Ayorinde, Sinha and SodhiWei and others 1990; Reference DeFranco, Wei and DempseyDeFranco and others, 1991), specimen size and crack length (Reference Dempsey, Wei, DeFranco, Ruben, Frachetti, Sinha, Sodhi and ChungDempsey and others, 1989a, Reference Dempsey, Y, S, R, R, Axelsson and Franssanb). Because of these effects, Reference Dempsey, Wei, DeFranco, Ruben, Frachetti, Sinha, Sodhi and ChungDempsey and others (1989a) proposed ice fracture-toughness data should be reported as “apparent fracture toughness”, K Q, accompanied by a detailed description of the testing conditions. We submit that many of these effects are products of a testing method in which fracture toughness is related to the load necessary to initiate a crack from a specimen starter notch. Use of such specimens has clouded the distinction between testing effects and true material behavior. As discussed below, we believe the unique geometry of the MR test effectively eliminates some of these effects and may also eliminate others, facilitating faster, easier testing with results showing significantly less scatter.
Loading rate
For situations in which fracture toughness is related to the tensile load required to initiate a crack at the tip of a starter notch, loading rate is typically reported as the time rate of change of the mode I stress-intensity factor at the tip of the notch (i.e.
Use of a modified ring-specimen geometry should eliminate most rate effects on the fracture toughness of ice, because the fracture toughness in the MR test is measured at the tip of a natural crack at the instant it passes from unstable to stable propagation. Consequently, there is no time for creep deformation to relax the crack-tip stress field. Although this remains to be evaluated in detail, data over the limited range of displacement rases in this study suggest this is the ease (Fig. 13). Rate effects observed with the MR test should only be related to the initiation load of the crack (σi; Fig. 2a) because creep deformation will most likely be concentrated around the periphery of the specimen hole and thereby influence the load at which a crack will initiate. However, because K Ic is not measured until a crack has propagated out of that part of the specimen influenced by the presence of the hole (Reference Thiercelin, Roegiers and Hartman;Thiercelin and Roegiers, 1987) and any associated creep deformation, the minimum in the load versus time curve for a MR test, and hence, K Ic, should be free of rate effects.

Fig. 13 Relationship between ram-head displacement rate and fracture toughness recorded during fracture-toughness tests on synthetic, granular, fresh-water ice and GISP2 E core firn.
Notch acuity
One of the basic tenets required for the valid application of linear elastic fracture mechanics is that cracks have sharp tips (i.e. radius of curvature = 0; Reference BroekBroek, 1986). In rock ceramic and concrete test specimens this does not present a significant problem because low-amplitude cyclic loading of a notched specimen produces sharp fatigue cracks at the notch tip. Although recent work by Reference Nixon and WeberNixon and Weber (1991) has demonstrated that ice is susceptible to fatigue cracking, this technique has not been used to create starter cracks in fracture-toughness tests of ice. Consequently, ice researchers typically machine sharp cracks at the tips of the starter notches of their test specimens. Variation in the techniques used to produce such sharp cracks has resulted in a variation in fracture toughness with notch acuity {sharpness).
Reference Wei, DeFranco, Dempsey, Ayorinde, Sinha and SodhiWei and others (1990) and Reference DeFranco, Wei and DempseyDeFranco and others (1991) characterized the effect of notch acuity on the fracture toughness of ice. Their results indicate that the fracture toughness of ice is greater for specimens with blunt starter notches. This occurs because the stress intensity at the tip of a starter notch is proportional to the sharpness of the notch. Specimens with blunt notches will fail at higher tensile loads, thereby yielding higher K Ic values, because the tensile stress at the tip of a blunt notch is less than that developed at the tip of a sharp notch subjected to the same tensile load. To eliminate the effects of notch acuity on the fracture-toughness testing of ice, a standardized technique for machining sharp notches involving scribing the tip of a bandsaw-cut notch with a razor blade was proposed by Reference Wei, DeFranco, Dempsey, Ayorinde, Sinha and SodhiWei and others (1990) and Reference DeFranco, Wei and DempseyDeFranco and others (1991).
The effects of notch acuity on the fracture toughness of ice are effectively eliminated in the modified ring test because the fracture toughness is not measured when a crack initiates from a machined starter notch. Instead, K Ic is measured at the tip of a natural crack after it has propagated some distance away from the edge of the central hole in the specimen. Measuring K Ic at the tip of a propagating natural crack insures a sufficiently sharp crack tip in every experiment.
Grain-size, specimen size and crack length
Reference Nixon, Schulson, Lunardini, Wang, Ayorinde and SodhiNixon and Schulson (1986, Reference Nixon and Schulson1987) reported that the fracture toughness of ice increased with decreasing grain-size. However, this result was questioned by Reference Dempsey, Wei, DeFranco, Ruben, Frachetti, Sinha, Sodhi and ChungDempsey and others (1989a, Reference Dempsey, Y, S, R, R, Axelsson and Franssanb), who measured the fracture toughness of ice using single-edged-notched beam (SENB) and rectangular, double-cantilever beam specimen geometries, and suggested the apparent grain-size dependence of fracture toughness reported by earlier workers may have resulted from the use of sub-sized specimens. Reference Dempsey, Wei, DeFranco, Ruben, Frachetti, Sinha, Sodhi and ChungDempsey and others (1989a, Reference Dempsey, Y, S, R, R, Axelsson and Franssanb) further stated that nearly all previous fracture-toughness data were invalid because they were derived from similarly sub-sized specimens and presented guidelines for standardizing specimen preparation and testing. Within these guidelines are minimum ratios of specimen depth to average grain-size and crack length to average grain-size required far valid LEFM testing. The minimum ratios are suggested because they represent a theshold ratio above which apparent fracture toughness, K Q, appears to be independent of the specimen depth and crack length.
In rocks, ceramics, concrete and metals, specimen-size requirements are designed to insure either plane-strain testing conditions, a critical amount of stable-crack extension prior to unstable-crack growth (Reference Matsuki, Hasibuan and TakahashiMatsuki. 1991) or a minimum extent of inelastic crack-tip deformation (e.g. Reference Schmidt and SummersSchmidt, 1980). Plane strain is required in the testing of materials with a fixed yield stress (e.g. metals) because the size of the crack-tip plastic zone in these materials increases dramatically under plane-stress conditions, resulting in greater fracture energies. Critical crack-extension and crack-length requirements are based on the hypothesis that unstable crack growth in concrete and rocks can only occur after the formation of an equilibrium-sized brittle process zone (Reference Hu and WittmannHu and Wittmann, 1990; Reference Janowski and StysJankowski and Stys, 1990; Reference Swartz and ShahSwartz and Shah, 1991). Formation of this process zone is believed to occur during stable growth of the crack over some critical length.
The physical basis for the dependence of ice fracture toughness on specimen size and crack length is unclear. Differences in ice behavior due to the entirely different stress state (i.e. plane strain or plane stress) that might be present in smaller samples are possible but have not been documented. A criterion for minimum crack length in ice specimens states that crack lengths should be at least 50 times the size of the region of inelastic deformation surrounding the crack tip (Reference Dempsey, Wei, DeFranco, Ruben, Frachetti, Sinha, Sodhi and ChungDempsey and others, 1989a). Although this is described as a size requirement, this stipulation is actually a loading-rate effect associated with the creep of ice at the crack tip. As discussed by Reference Riedel and RiceRiedel and Rice (1980), the extent of inelastic deformation surrounding a crack tip in a creeping solid is linearly proportional to the duration of loading. This relationship led Reference Timco, Frederking, Lunardini, Wang, Ayorinde and SodhiTimco and Frederking (1986) to suggest a maximum allowable time between the crack sharpening and failure stages of an ice fracture-toughness test. As discussed above, fracture-toughness values determined with the MR test should be free of creep-related rate effects and therefore crack-length requirements based on estimation of creep-zone size are not necessary for the MR test.
Size effects on the apparent fracture toughness of ice may primarily reflect the differences in the fracture behavior of multi-crystalline and polycrystalline ice (Reference Nixon, Schulson, Lunardini, Wang, Ayorinde and SodhiNixon and Schulson, 1986). So-called sub-sized specimens may simply not be representative of polycrystalline material behavior. Reference Nixon, Schulson, Lunardini, Wang, Ayorinde and SodhiNixon and Schulson (1986) stated that there is no quantitative measure of the number of grains necessary to constitute polycrystalline behavior in ice, but suggested that the smallest specimen dimension should equal at least ten grain diameters. With en average grain-size of ∼1 mm, all of the firn specimens tested in this study easily meet this requirement. However, because of the variability of grain-sizes between specimens of the synthetic granular ice, it is possible that some of these specimens do not exhibit polycrystalline behavior. This may further account for the relatively large standard deviation for the synthetic ice fracture-toughness values presented in this study. Further testing with finer-grained natural ice samples is required to elucidate this problem fully.
Conclusions
Modified ring tests conducted on synthetic, granular fresh-water ice and firn from the GISP2 Ε core respectively yield average fracture-toughness values of 145.7 and l08.6kPam½. Our results show a decrease in fracture roughness with increasing ice porosity and confirm the general conclusions of Reference Smith, Schulson, Schulson, Ayorinde, Sinha and SodhiSmith and others (1990). Continued study of firn fracture toughness will provide further insight into porosity effects on ice fracture toughness and advance our understanding of the three-dimensionai variation in fracture resistance of glaciers and ice sheets. We believe use of a modified ring-specimen geometry should eliminate many of the factors currently complicating the fracture-toughness testing of ice. Loading rate, notch acuity, crack-length and specimen-size requirements for notched-specimen geometries are not necessary for the modified ring test. Elimination of these testing complications should allow for an unclouded view of other parameters influencing ice-fracture toughness.
Acknowledgements
This paper represents a part of M.P. Fisfcher’s Ph.D. dissertation at The Pennsylvania State University. We should like to thank A. R. Ingraffea for providing the finite-element program FRANC. T. Bittencourt, D. Swenson and P. Wawrzynek provided excellent technical support during our use of the program. D. Elsworth and S. Anandakrishnan provided valuable comments and advice during this project. Formal review of this manuscript by S.J. DeFranco is gratefully acknowledged. The firn for this study was obtained with the assistance of the Polar Ice Coring Office, the GISP2 Science Management Office and the 109th New York Air National Guard. Funding for this project was provided by the David and Lucile Packard Foundation and U.S. National Science Foundation grants DPP-8822027 and DPP-8915995 to R.B. Alley.


