


1. Introduction
Widespread understanding of glaciers as biomes has only been achieved in the past few decades (Anesio and Laybourn-Parry, Reference Anesio and Laybourn-Parry2012). Glacial biomes are microbially dominated and are usually divided into three different environments: the glacial surface (supraglacial), within its interior (englacial) and at the base where the glacier is in contact with the bedrock (subglacial) (Anesio and others, Reference Anesio, Lutz, Chrismas and Benning2017; García-López and others, Reference García-López, Maria Moreno and Cid2019a). Supraglacial studies have mainly been focused on cryoconite holes (Fountain and others, Reference Fountain, Tranter, Nylen, Lewis and Mueller2004; Tranter and others, Reference Tranter2004; Bagshaw and others, Reference Bagshaw2007; Edwards and others, Reference Edwards2011; Musilova and others, Reference Musilova, Tranter, Bennett, Wadham and Anesio2015; Cook and others, Reference Cook, Edwards, Takeuchi and Irvine-Fynn2016; Uetake and others, Reference Uetake2019) and ice algae-associated communities (Uetake and others, Reference Uetake, Naganuma, Hebsgaard, Kanda and Kohshima2010; Yallop and others, Reference Yallop2012; Lutz and others, Reference Lutz, Anesio, Edwards and Benning2017), both of which are dominated by phototrophs. Here, microbial communities are highly influenced by the surrounding environment from which wind and precipitation transport dust, larger particles and, consequently, nutrients and microorganisms to the glacier surface (Grzesiak and others, Reference Grzesiak2015). The dark and oxygen-depleted subglacial environment is dominated by chemolithotrophs which are able to use the chemical compounds and H+ released from the bedrock/ice grinding to produce energy (Stibal and others, Reference Stibal, Hasan, Wadham, Sharp and Anesio2012a; Boyd and others, Reference Boyd, Hamilton, Havig, Skidmore and Shock2014; Dieser and others, Reference Dieser2014; Telling and others, Reference Telling2015; Kayani and others, Reference Kayani2018). Heterotrophic communities are also found in both supraglacial and subglacial environments, utilizing mainly organic carbon produced by other organisms (Anesio and Laybourn-Parry, Reference Anesio and Laybourn-Parry2012).
Potentially the largest glacial habitat (by volume and mass of ice) is the englacial environment, the part of the glacier or ice sheet between the bottom and the surface. The englacial region of temperate ice contains pockets of water at all scales from microscopic veins formed at the junction of ice crystal boundaries to macroscopic water-filled crevasses (Nye and Frank, Reference Nye and Frank1973; Watts and England, Reference Watts and England1976; Bamber, Reference Bamber1988). Although some of these pockets may be isolated, others are interconnected pathways exchanging water between the surface and the bed (Fountain and Walder, Reference Fountain and Walder1998; Catania and others, Reference Catania, Neumann and Price2008). The englacial environment has not been widely studied due to the technical challenges associated with sampling these habitats, yet microbial metabolism has been observed within aqueous veins (Mader, Reference Mader1992; Price, Reference Price2000; Miteva, Reference Miteva, Margesin, Schinner, Marx and Gerday2008; Dani and others, Reference Dani, Mader, Wolff and Wadham2012). Furthermore, several studies of englacial ice cores have revealed microbial changes with the depth and age of ice and have successfully isolated microorganisms (Miteva, Reference Miteva, Margesin, Schinner, Marx and Gerday2008; An and others, Reference An, Chen, Xiang, Shang and Tian2010; Knowlton and others, Reference Knowlton, Veerapaneni, D'Elia and Rogers2013; Singh and others, Reference Singh, Singh and Roy2016; Liu and others, Reference Liu2019), but the life challenging conditions (e.g. subzero temperatures and nutrient depletion) have cast doubts whether isolated englacial organisms can thrive. However, the water flowing within the englacial region has rarely been studied directly despite suggestions that englacial water may be the most metabolically active habitat within the englacial realm (Hotaling and others, Reference Hotaling, Hood and Hamilton2017; Martinez-Alonso and others, Reference Martinez-Alonso2019).
A better definition of the microbial communities inhabiting englacial waters would help link biogeochemical processes connecting supraglacial and subglacial biomes and further refine and define the role of glaciers in carbon and nutrient cycling and how they could be influenced by glacier shrinking (Anesio and others, Reference Anesio, Hodson, Fritz, Psenner and Sattler2009; Hawkings and others, Reference Hawkings2015; Kujawinski, Reference Kujawinski2017; Milner and others, Reference Milner2017). More generally, the ecology of glacial environments provides an upstream boundary condition for downstream aquatic communities in streams, lakes and tidal environments (Hood and others, Reference Hood, Battin, Fellman, O'neel and Spencer2015; O'Neel and others, Reference O'Neel2015; García-López and others, Reference García-López, Rodriguez-Lorente, Alcazar and Cid2019b). As a first step in this effort, our study characterized and compared the diversity and structure of microbial communities between the macroscopic englacial system (i.e. the water flowing through englacial fractures) and the meteoric glacier ice formed in proximity of the fractures. We studied the Storglaciären englacial system where, measured water flow rates of cm s−1 indicate residence times of weeks to possibly months, depending on where the water enters the ice (Fountain and others, Reference Fountain, Jacobel, Schlichting and Jansson2005). Measurements also indicate the existence of no flow zones, possibly at the far end of a fracture away from the hydrological connection, providing a refuge for microbial growth. Although data of bacterial doubling times are not available from englacial systems, doubling times from cryoconite waters range between a few hours to hundreds of days and can provide an idea of the range of values that could potentially be found in these oligotrophic environments (Anesio and others, Reference Anesio2010). In this context, we hypothesized that the microbial community structure within the englacial hydrological system would differ from that in the surrounding ice.
2. Materials and methods
Our study site was Storglaciären, a small polythermal valley glacier in Arctic Sweden (67°54′10″ N, 18°34′00″ E; Figs 1a, b). Its ablation zone is capped by ice below freezing to a depth of 30–40 m, its terminus is frozen to the bed and the remainder of the glacier is temperate (Petterson and others, Reference Petterson, Jansson, Huwald and Blatter2007). This relatively easily accessible glacier has been intensively studied hydrologically (Holmlund and Eriksson, Reference Holmlund and Eriksson1989; Hooke and Pohjola, Reference Hooke and Pohjola1994; Jansson, Reference Jansson1996). To sample the englacial water, we employed an indirect method. Near-surface ice (i.e. to a maximum depth of 131 cm) was sampled in the ablation zone (ice-exposed region on the lower third of the glacier). Fountain and others (Reference Fountain, Jacobel, Schlichting and Jansson2005) showed that clear bands of ice, visible on the surface of Storglaciären, are the product of the slow freezing of englacial water within fractures deep in the glacier. The refrozen fractures are uplifted and exposed at the surface due to glacier movement and ablation (Pohjola, Reference Pohjola1996; Cuffey and Paterson, Reference Cuffey and Paterson2010). The slow freezing of water, particularly when flowing, favors the exclusion of air bubbles and formation of clear ice (Carte, Reference Carte1961; Hubbard and others, Reference Hubbard, Tison, Janssens and Spiro2000). The clear ice bands were distributed in the glacier ablation zone and had a typical width of 10–30 cm and a length of 10 m or more. Between the bands of refrozen englacial water, meteoric glacier ice is formed from the compaction of snow, presenting a dense matrix of air bubbles (i.e. cloudy ice).
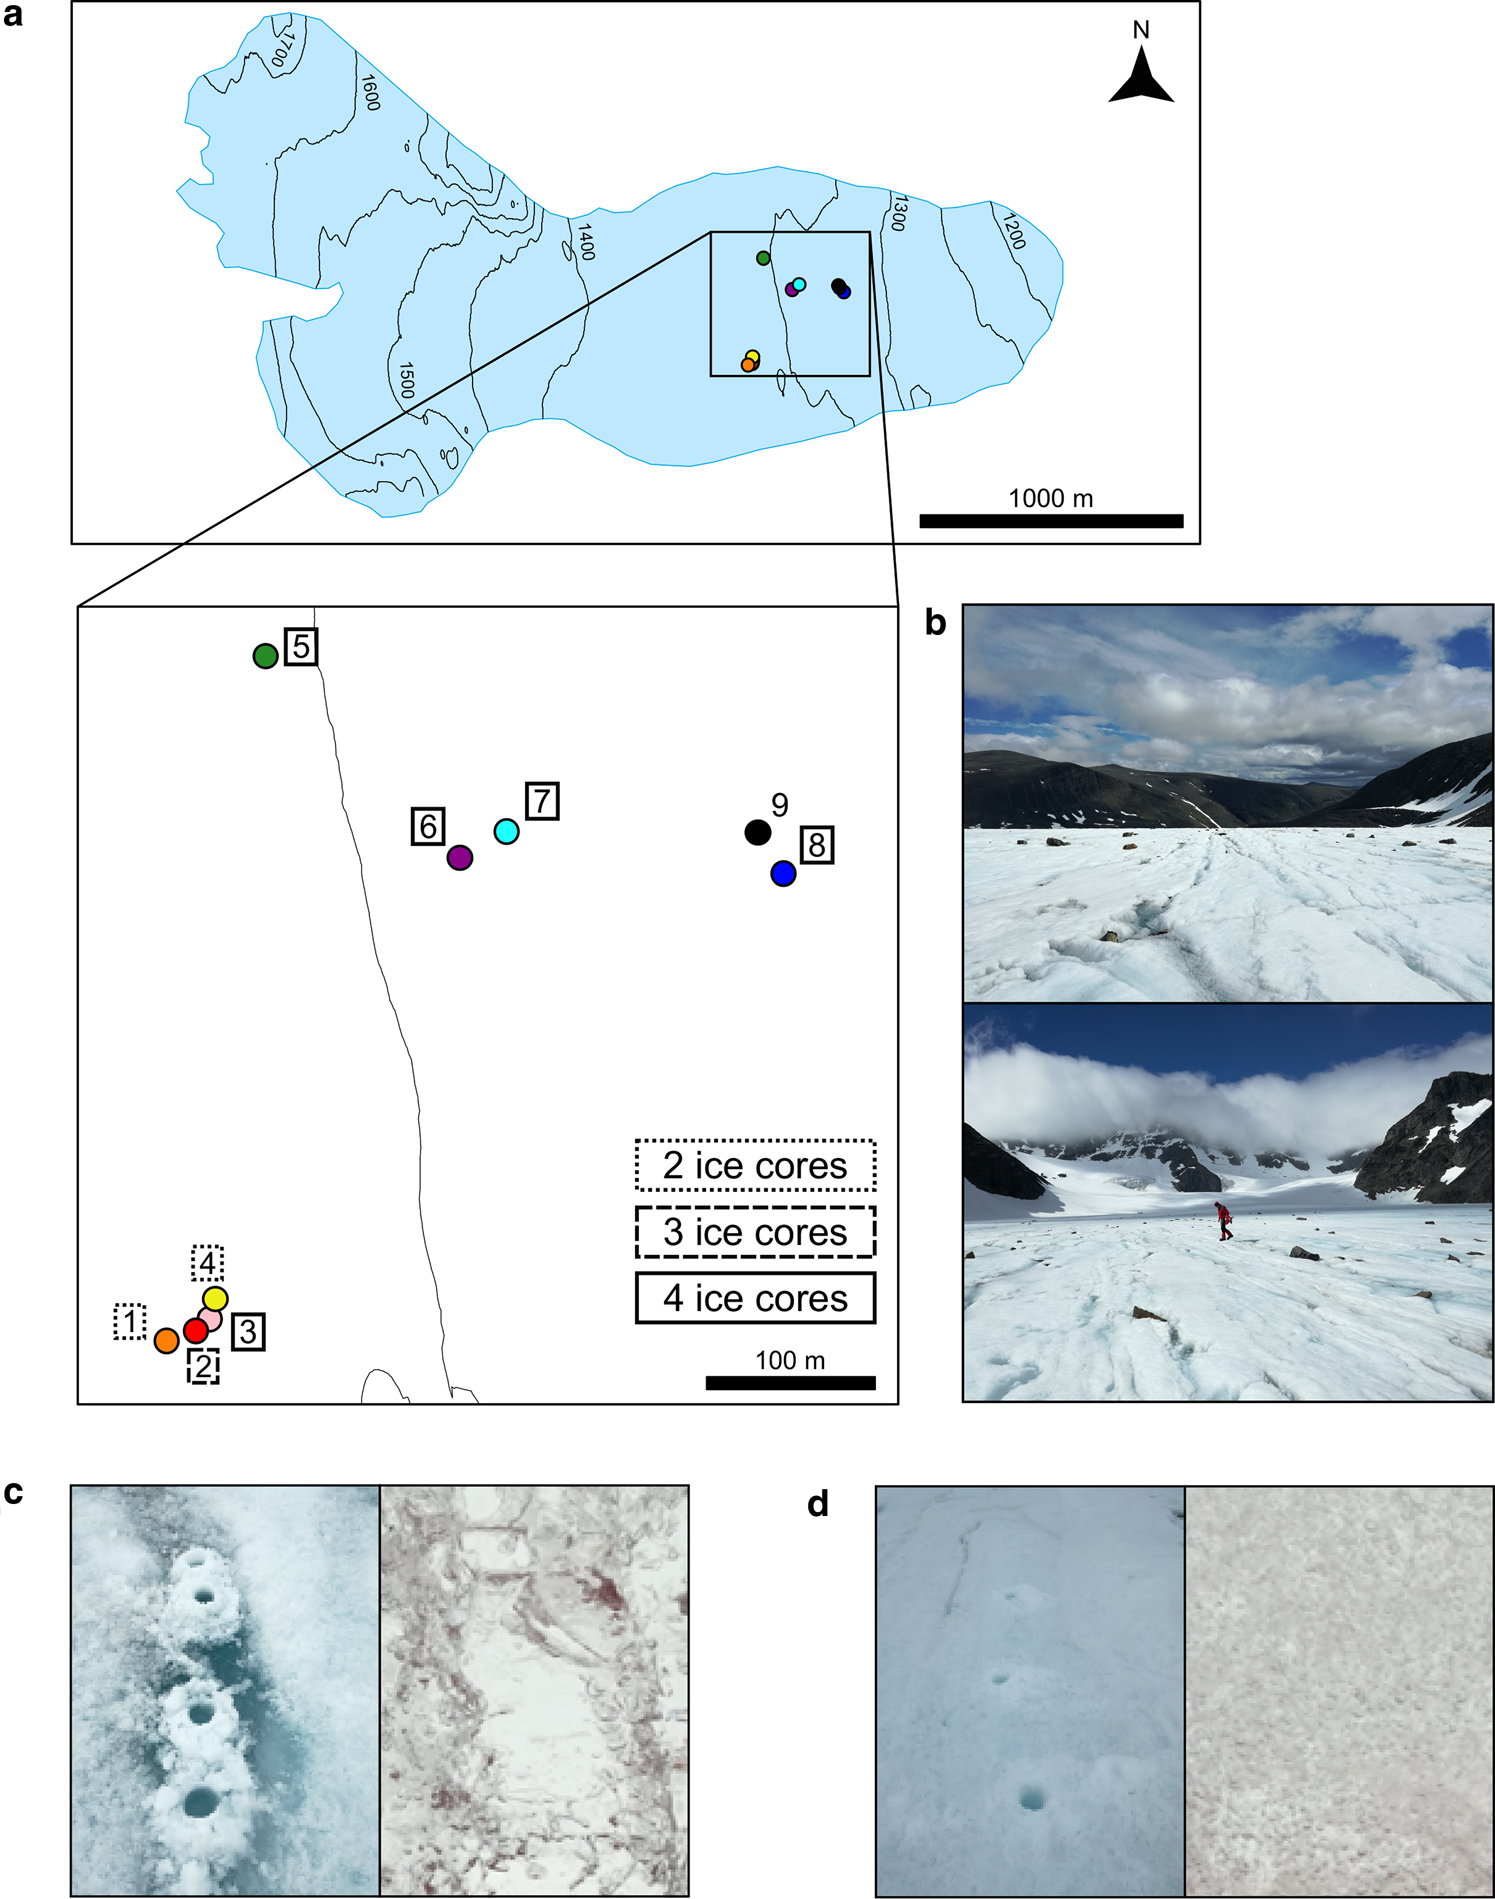
Fig. 1. Map of the sampling site location in the ablation zone of the Storglaciären and ice type images. (a) Position of the nine sampled sites on the glacier. Four ice cores were processed from sites 3, 5, 6, 7 and 8, three ice cores were processed from site 2 and two ice cores were processed from sites 1 and 4. Two surface algal samples were collected in site 9. (b) Images of the glacier surroundings facing the glacial valley and the glacial accumulation zone. (c) Clear ice band with an example of the clear ice matrix (site 7) and (d) cloudy ice sampling site with an example of the cloudy ice matrix (site 4); the bore hole diameter is 9 cm.
2.1. Sample collection and ice classification
The fieldwork was conducted in July 2017. Unfortunately, a thin, late-season snowpack covered the study area made selecting coring sites difficult. Both clear ice bands (considered as frozen englacial fractures) and cloudy ice (considered here as meteoric glacier ice) were drilled with a 9 cm diameter hand corer (Mark II, Kovacs, USA) and processed in the same manner (Figs 1c, d). We collected ice cores from eight sites in the glacier ablation zone. Sites were chosen by targeting areas with evident contrast between clear ice bands and meteoric ice. For each site, at least three ice cores were taken from the identified ice band and other three ice cores were taken randomly in the proximity of the ice band (i.e. 2–3 m away). The ice core depths ranged between 45 and 131 cm (Table S1). Each 9 cm diameter core was cut into two or three sections. The first section of the ice core was constituted by the first 15–30 cm of ice from the surface; samples representing this section were classified as Surface samples (S). The rest of the core was classified as SubSurface sample (SS). Surface samples are constituted by the surface weathered crust plus a few extra centimeters to avoid potential contamination in subsurface samples by surface weathering and meltwater. The glacier surface weathered crust showed a variable depth across different sites and an ice matrix enriched with particles and algal detritus. Occasionally, a core would include both a clear section and cloudy section in its subsurface layer, perhaps due to the inclination of the refrozen fracture. In this circumstance, the core was separated at the matrix interface. Each core section was conserved in a different sterile Whirl-Pak bag (Whirl-Pak, Nasco, USA) and classified as Surface clEar ice (SE), Surface clOudy ice (SO), SubSurface clEar ice (SSE), SubSurface clOudy ice (SSO) or SubSurface Mixed ice (when the ice showed a mixed ice matrix; SSM).
After moving to a new sampling site or switching to a different ice type, the core barrel was cleansed by coring into the ice of the new sampling location and discarding the core. Nine different sites were sampled in total. Sites 1, 2, 3 and 4 were within a 50-m proximity, whereas site 5, the closest to those samples was 400 m apart. Sites 6 and 7 were 150 m distant from site 5 and 150 m away from sites 8 and 9. Although at least three cores were taken for ice type in each site, we processed two cores in sites 1 and 4, three cores at site 2 and four cores were taken from sites 3, 5, 6, 7 and 8 (Fig. 1a and Table S1). At site 9, two surface samples were taken from the upper 2 cm where the ice was darker and visibly enriched with algae. These two samples (i.e. algae-containing samples) were collected as microbial controls and compared with the others.
The cores were melted at room temperature in the laboratory of the Tarfala Research Station. To avoid external contamination, we melted the outer layer of the ice core and discarded the water (Christner and others, Reference Christner, Mikucki, Foreman, Denson and Priscu2005). The core was then transferred to a new sterile Whirl-Pak bag. The subsequent melted water was then subsampled. For major ion (i.e. nutrient) analysis, 1.5 mL of the glacier meltwater was filtered through a 25 mm, 0.22 μm cellulose nitrate inline syringe filter (Whatman™) and stored in a polypropylene auto sampler vial at 3°C; for cell counts, 15 mL of water was stored with 2% of glutaraldehyde and then stored at 4°C, and for DNA analyses the remaining water (1–3 L) was processed through sterile polycarbonate membrane filters (0.22 μm pores, 47 mm, Sigma-Aldrich) and stored at −20°C. Given the low biomass environment, another 50 mL of Milli-Q® ultrapure water were processed through a filter with exactly the same procedure and stored for further analyses in order to assess any eventual procedural contamination.
2.2. Geochemical analyses
Major soluble ions (Cl−, SO42−, NO3−, PO43−, Mg2+, Ca2+, NH4+, Na+tot and K+) were quantified using capillary ion chromatography on a Thermo Scientific™ Dionex™ analytical ICS-5000, fitted with a simultaneous IonPac™ AS11-HC 2 × 250 mm anion-exchange column and an IonPac™ CS12 2 × 250 mm cation-exchange column. The limit of detections (LoDs), determined by the mean concentration plus three times the std dev. of procedural blanks (n = 9), were 8.1 parts per billion (ppb) (Cl−), 6.4 ppb (SO42−), 8.6 ppb (NO3−), 16.5 ppb (PO43−), 23 ppb (Mg2+), 26 ppb (Ca2+), 10 ppb (NH4+), 29 ppb (Na+tot) and 14 ppb (K+). Accuracies were −0.1% (Cl−), −3.4% (SO42−), −0.5% (NO3−), −5.5% (PO43−), −14% (Mg2+), −6.5% (Ca2+), −14% (NH4+), −14% (Na+tot) and −20% (K+). Precisions were ±0.47 (Cl−), ±2.0 (SO42), ±1.0 (NO3−), ±2.7 (PO43−), ±5.4 (Mg2+), ±3.7 (Ca2+), ±2.9 (NH4+), ±3.7 (Na+tot) and ±6.7 (K+), as determined from comparison with a gravimetrically diluted single ion 1000 ppm Fluka™ TraceCERT® ion chromatography standard to a concentration of 250 ppb for each ion. In the paper, Na+ values are reported as rock dissolved Na+rock. Na+rock was calculated with the formula: Na+sea = Cl−tot × (10 760 ppb/19 350 ppb) where Na+rock = Na+tot − Na+sea. The values 10 760 and 19 350 ppb are, respectively, the concentrations of Na+ and Cl− in sea water (Plummer, Reference Plummer1975). Some of Na+rock values that are equal to 0 may be slightly negative values.
Dissolved organic carbon (DOC) concentration was quantified using a Shimadzu TOC-VWP Organic Carbon Analyzer. Total carbon (TC) is the sum of inorganic carbon (IC) and DOC. TC was measured via the addition of phosphoric acid and persulfate to the sample, which was heated under UV radiation and converted to CO2 where it was measured using non-dispersive infrared analysis. IC was quantified by acidifying the sample with phosphoric acid and sparged to convert it to CO2, where it was measured in the same way as TC. DOC was determined by subtracting the IC concentration from the TC concentration. The LoD was 28.1 ppb. Precision was ±1.3 and accuracy was 2.3% as determined from comparison with a gravimetrically diluted 1000 ppm TOC certified stock standard to a concentration of 250 ppb (Sigma TraceCERT®).
2.3. Cell enumeration and biovolume
Cell concentrations were determined for the prokaryotic and eukaryotic components after a thorough vortexing of the samples. All the samples were observed under a LEICA DM2000 LED microscope and imaged with Leica MC 120 HD camera connected to LAS v 4.12 software. Eukaryotic cells were counted under visible light where each sample was first loaded on a Fuchs-Rosenthal hemocytometer and then two counting chambers were screened at a 400× magnification. The eukaryotic organisms were classified into four different types: Ancylonema sp., Mesotaenium sp., circular cells and oblong cylindrical cells (Figs S1a–d) and counted for each of the samples. For each cell type, 30 images were taken using a magnification of 400× for Ancylonema sp. and 100× magnification for the other cells. Using Fiji software (Schindelin and others, Reference Schindelin2012), the diameter and/or the height of all the cells were measured in order to calculate the average cell volume for these four ecotypes using formulae after Hillebrand (μm3 per cell) (Hillebrand and others, Reference Hillebrand, Dürselen, Kirschtel, Pollingher and Zohary1999). In order to obtain the biovolume, the cell volumes were then multiplied by the cell counts (μm3 mL−1).
Prokaryotic cells were counted by epifluorescence microscopy using an excitation wavelength ranging between 330 and 380 nm and following the protocol presented in Grzesiak and others (Reference Grzesiak2015) where 5 mL of melted glacier ice (0.5 mL for the algal samples of site 9) was incubated with 4′,6-diamidino-2-phenylindole (final concentration of 1%) in darkness for 10 min and then filtered through 0.2 μm pore size black polycarbonate filters (Millipore Isopore) for epifluorescence microscopy. For each sample, under 1000× magnification using an oil immersion objective, the prokaryotic cells emitting blue and yellow-orange fluorescent light were counted over 30 camera fields of view Figs S1e, f). The yellow-orange fluorescence was assumed to be the autofluorescence emitted by Cyanobacteria (Rassoulzadegan and Sheldon, Reference Rassoulzadegan and Sheldon1986; Uetake and others, Reference Uetake, Naganuma, Hebsgaard, Kanda and Kohshima2010). Although visible with this technique, no algal organisms were included in this count. Bacterial biovolumes were also approximated using formulae (Hillebrand and others, Reference Hillebrand, Dürselen, Kirschtel, Pollingher and Zohary1999). In our study, prokaryotic counts are presented as cell counts (cells per mL) whereas total counts of the prokaryotic and eukaryotic component were presented as biovolumes (μm3 mL−1). When filamentous cell chains (e.g. Ancylonema or Cyanobacteria) were observed, the single cells composing the chain were considered.
2.4. DNA extraction and Illumina sequencing
The filters (0.22 μm pores, 47 mm, Sigma-Aldrich) were directly processed with the DNeasy PowerWater kit (Qiagen, Hilden, Germany) following the manufacturer's protocol. DNA concentrations were measured with the Qubit® 1.0 Fluorometer and Qubit® dsDNA HS assay kits (Invitrogen, Carlsbad, CA, USA). Between 1 and 250 ng of DNA were obtained per sample.
All samples were amplified with primers specific to the V3–V4 region (450–500 bp) of the 16S rRNA gene. The primers Pro341F and Pro805R target both the bacterial and archeal organisms (Table S2) (Takahashi and others, Reference Takahashi, Tomita, Nishioka, Hisada and Nishijima2014). To account for low starting biomass and add on sequencing adapters, the first 25 polymerase chain reaction (PCR) cycles were performed using the Pro341F and Pro805R primers and then a further 25 cycles were run with the same primers combined with the Illumina Nextera Transposase adapters (Table S2). PCR was run adding 12.5 μL of KAPA HiFi HotStart ReadyMix (Roche Applied Science), 1.5 μL of each 5 μM primer (0.3 μM final concentration), between 5.50 and 10.5 μL of sample (5–30 ng of DNA) and nuclease-free water up to a final volume of 25 μL PCR solution. PCR conditions were 3 min at 95°C, 25 cycles of 20 s at 98°C, 15 s at 65°C and 15 s at 72°C, and a final extension step of 5 min at 72°C for the first step of the nested PCR. The second step consisted of 3 min at 95°C, 25 cycles of 30 s at 98°C, 30 s at 55°C, 30 s at 72°C and a final extension step of 5 min at 72°C. All PCR runs were checked on 1.5% horizontal agarose gel (0.5 mg ethidium bromide per mL) in 1× TAE buffer (Tris acetate–EDTA) at 120 mV for 30 min (Bio-Rad PowerPac 300, Bio-Rad Laboratories). Negative controls did not show any band except in one of the runs. That negative control sample was therefore sequenced. The amplicons were then indexed with the Nextera XT Index kit, pooled together and sequenced in two lanes of the Illumina MiSeq using 600 cycle MiSeq reagent kit (version 2) obtaining paired 300 bp reads. Basecalling was done with Illumina Real Time Analysis (RTA) software version 1.18.54.0. The sequencing was performed by the University of Bristol Genomics Facility.
The sequence data have been deposited in the European Nucleotide Archive (ENA) at EMBL-EBI under accession number PRJEB40002 (https://www.ebi.ac.uk/ena/browser/view/PRJEB40002).
2.5. Bioinformatics and statistical analyses
All 62 glacial samples and the two negative controls were processed together following the same pipeline. We performed all DNA analyses using R v 3.6.1 (R Core Team 2019, 2019) except for the first step where primers and adapters were trimmed with software CUTADAPT v 2.6 (Martin, Reference Martin2011). The quality check and filtering of the amplicon sequences were performed using the R package DADA2 v 1.14.0 (Callahan and others, Reference Callahan2016) following these steps: read quality trimming, read dereplication, ASV (Amplicon Sequence Variant) inference, read merging, chimera detection and taxonomy assignment with the Silva database v 132 (Yilmaz and others, Reference Yilmaz2014). Using the R package decontam v 1.6.0 (Davis and others, Reference Davis, Proctor, Holmes, Relman and Callahan2018) we also removed the contaminant reads from all the samples. Contaminants were identified by the two negative controls (NC1 and NC2). NC1 was the DNA extracted from the Milli-Q® ultrapure water that was filtered in the laboratory of the Tarfala Research Station and treated with the exact same protocol as the other samples, and NC2 was a PCR negative control that showed a faint line on one of the electrophoresis gels that was run during the amplicon preparation. No negative control accounting for in-field coring was added. However, as described above, the core barrel was cleansed every time we switched to a different sampling site or ice type and the melted water from the core outer layer was discarded, thereby minimizing in-field sample contamination.
Two samples were overloaded during the Illumina sequencing giving an output of 690 952 and 1 278 606 sequences in 3D-75-122 and 9B, respectively (Table S3). The two overloaded samples were rarefied to 263 233 sequences which corresponded to the number of reads in third sample ranked by read-count (8D-20-100).
We calculated sample rarefaction curves in order to check how the diversity was covered in all the samples with the R package iNEXT v 2.0.20 (Hsieh and others, Reference Hsieh, Ma and Chao2016). Then we removed the singleton component from the dataset. Singletons were here defined as the ASVs represented by only one sequence read count in the entire dataset (Auer and others, Reference Auer, Mariadassou, O'Donohue, Klopp and Hernandez-Raquet2017; Callahan and others, Reference Callahan2019) (Table S4). The ASV table was then transformed with the package DESeq2 v 1.26.0 (Love and others, Reference Love, Huber and Anders2014) and the cluster analysis was calculated on this dataset using Euclidean distances. In the heatmap, the samples were disposed following this sample clustering and only genera that represented more than 2% of the community in at least one sample of the dataset were reported. We also reported the 16S rRNA sequences associated with Chloroplast (order-level) and WPS-2 (phylum-level) in order to give a better idea about the Unclassified component at genus-level. We investigated how each genus varied between different sites, ice types and ice layers with the Kruskal–Wallis test. This test was performed for each genus on the relative abundance dataset (no algal samples from site 9 were included). We considered the Kruskal–Wallis test to be significant when the p-value was lower than 0.05.
All the other statistical analyses such as permutational multivariate analysis of variance (PERMANOVA) and distance-based redundancy analysis (dbRDA) were performed on the dataset transformed with the Hellinger transformation (Legendre and Gallagher, Reference Legendre and Gallagher2001). PERMANOVA analyses were performed on Bray–Curtis dissimilarity matrices for ASV and microbial count data and Euclidean distance matrices for the geochemical dataset. All the factorial analyses (e.g. PERMANOVA) were performed with three different factors: ‘site’ (nine levels as 1, 2, 3, 4, 5, 6, 7, 8 and 9), ‘ice type’ (five levels as SE, SO, SSE, SSO and SSM) and ‘layer’ (two levels as S and SS). The factor ‘layer’ was divided only between surface and subsurface samples because the subsurface samples represented a high range of depths and this did not allow a more detailed division. The ice types SSE and SSO, which are the clear and cloudy subsurface ice, also represented samples from different ice depths.
PERMANOVA performed on uniquely clear or cloudy dataset was performed on only the factors ‘site’ and ‘layer’ to check which of the two ice types showed a higher degree of differentiation among sites and ice layers. The algal samples (site 9) were excluded by the PERMANOVA and dbRDA analyses in order to not inflate the observed difference between samples. In the dbRDA analysis, sample 4B-17-74 represented an outlier (dbRDA1 = −2.83 and dbRDA2 = −4.00) was removed from the graph for visualization purposes. PERMANOVA pairwise comparisons were performed with the R package pairwiseAdonis v 0.4 (Martinez Arbizu, Reference Martinez Arbizu2020) and p-values were adjusted with the Bonferroni correction.
We used the following R packages for data manipulation and graph plotting: ggplot2 v 3.2.1 (Wickham, Reference Wickham2016), gplots v 3.0.1.1 (Warnes and others, Reference Warnes2020), tidyr v 1.0.2 (Wickham and RStudio, Reference Wickham2020), phyloseq v 1.30.0 (McMurdie and Holmes, Reference McMurdie and Holmes2013), vegan v 2.5.6 (Oksanen, Reference Oksanen2017), viridis v 0.5.1 (Garnier, Reference Garnier2018), gridExtra v 2.3 (Auguie, Reference Auguie2017) and plyr v 1.8.5 (Wickham, Reference Wickham2011).
3. Results
3.1. Ice geochemistry
Twenty-five percent of the geochemical variance was explained by the differences between each site location. Differences between clear and cloudy ice was a secondary factor explaining 17% of the variance (p-value <0.05; Table 1a). PERMANOVA analysis performed on each variable showed that Mg2+ (R 2 = 0.81), K+ (R 2 = 0.72), Ca2+ (R 2 = 0.70), Na+ (R 2 = 0.35) and NH4+ (R 2 = 0.24) showed significant values (p-value <0.05) for the site locations. No significant results were obtained for the differences between ice types. In sites 1, 2, 3, 4 and 5 Mg2+, Ca2+ and K+ showed higher concentrations (17–19, 17–33 and 26–123 ppb respectively) than in the other sites (6–13, 6–14 and 0–18 ppb). Na+ was lower in sites 6, 7 and 8 (0–14 ppb, 8D-0-20 excluded) compared to the other sites (5–25 ppb). NH4+ concentrations were higher in sites 6, 7, 8 and 9 and especially in site 8 where the average value was 13 ± 6 ppb against 6 ± 5 ppb in all the other sites. PO43− concentration was below the LoD in all of the samples. DOC values were much higher in the algal samples (site 9) with values of more than 1500 ppb while in the others all the values were below 500 ppb (Fig. 2). Nutrient and DOC concentrations grouped by different ice types are reported in Fig. S2.
Table 1. PERMANOVA test performed on the ice geochemistry, prokaryotic count, biovolume and ASV datasets for the model (a) ‘site × ice type’ (b) and ‘site × layer’.

PERMANOVA was performed with 1000 permutations on Bray–Curtis dissimilarity matrices for all the datasets except from the ice geochemistry dataset where a Euclidean distance matrix was used. The symbol ‘*’ is reported for significant R 2 values where the statistic p-value <0.05.

Fig. 2. Geochemical data grouped by site for (a) Cl−, (b) Na+, (c) Mg2+, (d) Ca2+, (e) SO42−, (f) K+, (g) NO3−, (h) NH4+ and (i) DOC. All the values are reported in ppb.
3.2. Cell enumeration
The highest prokaryotic abundance was found in high algal content samples at site 9 (6 × 10⁴ in 9A and 1 × 10⁵ cells per mL in 9B). In all the other ice samples, the prokaryotic concentration ranged between 2 × 10³ and 3 × 10⁴ cells per mL. The cell count was higher in the surface clear ice (SE) samples compared to the other ice types (Fig. 3a) whereas fewer differences were observed among different sites (Fig. 3b).

Fig. 3. Prokaryotic cell counts for (a) ice type-grouped samples and (b) site-grouped samples.
Looking at the biovolume data (comprising also of the algal component), the algal samples presented, again, the highest biovolume values with 5 × 10⁷ and 9 × 107 μm3 mL−1. The other samples ranged between 3 × 10⁴ and 6 × 106 μm3 mL−1 (Fig. S3). The only statistically significant factor (p-value < 0.05) in the prokaryotic count and biovolume datasets was the ice type factor which explained 17 and 13% of the variance respectively (Table 1a). Less variance was explained by the model when the PERMANOVA analysis was run with ‘layer’ (i.e. surface vs subsurface ice) as second factor (instead of the factor ‘ice type’; Table 1b). PERMANOVA pairwise comparisons showed that the only significant comparisons (p-value <0.05) were those between the SE samples and the other ice types. In particular, comparisons between SE and surface cloudy ice (SO), subsurface cloudy ice (SSO) and subsurface clear ice (SSE) explained 28, 21 and 15% of the observed variance.
3.3. Microbial diversity
The two negative controls NC1 and NC2 resulted in 179 and 59 763 sequences, respectively (Table S3). NC2 sequences were represented by 219 ASVs. The most abundant ASVs (i.e. ASVs correspond to more than 0.01% of the sample sequences) in NC2 were associated with 97% of the sequences in this sample, and only to <1% of all the sequences in all the other samples.
Between 15.2 and 73% of the sequences in all samples were kept after the sequence clean-up and only five of the 62 glacier ice samples had fewer than 50 000 sequences (Table S3). The total number of ASVs present in the dataset was 20 509. The iNEXT diversity curves reached a plateau for the q1 (Shannon diversity) and q2 (Simpson diversity) indexes whereas they were still in an exponential phase for the q0 (ASV richness) index (Fig. S4).
At high taxonomical (phyla-level) rank, all the ice samples presented similar communities dominated by Cyanobacteria (33.3% on average), Alphaproteobacteria (13.4%; Proteobacteria), Actinobacteria (11.7%), Bacteroidetes (11.3%), WPS-2 (10.5%), Firmicutes (5.4%), Acidobacteria (4.2%), Gammaproteobacteria (3.8%; Proteobacteria) and Armatimonadetes (2.2%). These phyla represented between 79.8 and 99.9% of all the taxa sampled. Phylum distribution across the different sites did not show any particular trend with the exception of a higher abundance of Armatimonadetes and Acidobacteria in sites 5, 6, 7 and 8 reaching abundances of 13.4 and 13.5%, respectively; and Firmicutes in sites 7, 8 and 9 reaching 31.5%. In the subsurface ice, Armatimonadetes and Firmicutes had a higher sequence relative abundance reaching also 13.4 and 24.5% in these samples. Cyanobacteria was the most represented phylum in the dataset and reached a relative abundance of 99.2% in the algal samples collected from area 9, and ranged between 23 and 50% in the samples collected from SO, SE, SSE and SSM, but was constantly lower than 25% in SSO.
At ASV-level the samples clustered in three main different groups with a first cluster composed of samples from sites 1, 2, 3, 4 and 5, a second cluster with samples from sites 5, 6, 7 and 8 and a third cluster, more distantly related from the first two clusters, with samples from sites 5, 6, 7 and 8 with mainly subsurface cloudy samples (Fig. 4a). Samples collected from site 5 clustered closed to samples from all the other sites. Additionally to the two algal samples (9A and 9B), the ice cores 6A and 8B also clustered independently from all the other samples. The Unclassified component at the genus level was between 0.1 and 49.9% in all samples (9A and 3A-0-33, respectively), where most of the sequences were associated with the phyla Cyanobacteria, Proteobacteria and Armatimonadetes (Fig. S5). Samples 9A and 9B had 99% of the sequences associated with chloroplast 16S rRNA.

Fig. 4. Genus abundance across the samples. (a) Cluster analysis performed on ASV dataset transformed with the DESeq2 algorithm where the samples clustered in three main groups (1, 2 and 3). (b) Heatmap showing only the genera that represented more than 2% of the community in at least one sample of the dataset. (c) Heatmap reporting chi-squared values reported by Kruskal–Wallis tests performed on dataset without algal samples (site 9) for the factors ‘site’, ‘ice type’ or ‘layer’; white boxes correspond to p-values ⩾0.05. The reported sample names are composed of the core replicate and the core depth range (cm). *All the reported taxa are at the genus level with the exception of WPS-2 which is a phylum and Chloroplast which is an order. **The Unclassified component is explained in more detail in Fig. S5.
Clusters 1 and 2 had a consistent dominant community across all the samples where WPS-2, Phormidesmis, Salinibacterium, Acidiphilium, Solitalea, Hymenobacter, Granulicella, Parafrigoribacterium and Polymorphobacter constituted more than 34% of the community in all the samples (except from samples 2A-83-111, 2C-25-61, 2C-61-119, 4B-17-74 and 5D-25-70). Clusters 2 and 3 (sites 6, 7 and 8) were also characterized by the genus Clostridium; and cluster 3 (subsurface cloudy samples in sites 6, 7 and 8) alone was characterized by Sediminibacterium and Bradyrhizobium and a higher component of less abundant taxa (Fig. 4b).
Kruskal–Wallis tests, performed at specific genus relative distributions, showed that most of the genera varied between sites, rather than between different ice types or layers. In particular, Sediminibacterium, Bradyrhizobium and Clostridium showed the highest chi-squared values (Fig. 4c). Sediminibacterium, Bradyrhizobium and Pseudanabaena also showed a distribution that also varied by ice type (Fig. 4c).
In the ASV dataset, 21% of the observed variance was explained by the factor ‘site’. The factor ‘ice type’ was a secondary factor explaining 10% of the variance; 29% of the variance was explained by ‘site × ice type’ factor (p-value <0.05, Table 1a). In total, 27 and 42% of the variance was explained by the factor ‘site’ when PERMANOVA was performed only on the clear and only the cloudy ASV dataset, respectively (p-value <0.05, Table 2).
Table 2. PERMANOVA test performed on only the clear ice samples and only on the cloudy ice samples for the model ‘site × layer’

PERMANOVA was performed with 1000 permutations on Bray–Curtis dissimilarity matrices for all the datasets except from the ice geochemistry dataset where a Euclidean distance matrix was used. The symbol ‘*’ is reported for significant R 2 values where the statistic p-value <0.05.
3.4. Ice geochemistry, site and taxon interactions
The clustering of subsurface cloudy ice samples of sites 6, 7 and 8 was correlated with a high abundance of the taxa Clostridium, Bradyrhizobium, Salinibacterium, Sediminibacterium and Desulfosporosinus (Fig. 5). This was also supported by the Kruskal–Wallis test results where these taxa explained differences observed among sites (Fig. 4c). This sample cluster was correlated with higher values of NH4+, SO42− and Cl− and by lower concentrations of all other nutrients. All other samples from sites 6, 7 and 8 were correlated with higher values in NH4+. On the contrary, the group formed by sites 1, 2, 3 and 4 was characterized by higher values of mainly K+, Na+, Ca2+ and Mg2+ and an increase in the genera Massilia, Hymenobacter, Pseudanabaena and Acidiphilium, Parafrigoribacterium and Deinococcus. NH4+ had negative relation with all the other ions (Fig. 5). The dbRDA clustering patterns corroborated those seen in the cluster analysis (Fig. 4a). DOC and NO3− were the geochemical variables that least affected the taxon and site distribution observed in the dbRDA plot (shorter vectors).

Fig. 5. dbRDA bi-plot ordination performed on the Hellinger-transformed genus dataset and the geochemical dataset (Cl−, Na+, Mg2+, Ca2+, SO42−, K+, NO3−, NH4+ and DOC). Algal samples from site 9 were not included in the analysis. Only genera that had a dbRDA1 or dbRDA2 higher than 0.2 or lower than −0.2 were displayed in the plot. Vectors indicate directions of the geochemical variable effects in the bacterial community composition (Bray–Curtis similarity).
4. Discussion
Common to all sampling sites were taxa previously found and isolated from other polar and cold environments, such as the genera Phormidesmis (Chrismas and others, Reference Chrismas, Barker, Anesio and Sánchez-Baracaldo2016), Salinibacterium (Shin and others, Reference Shin2012), Solitalea (Uetake and others, Reference Uetake2019), Granulicella (Oshkin and others, Reference Oshkin2019) and Hymenobacter (Klassen and Foght, Reference Klassen and Foght2011). Most of these taxa have been described as being exopolysaccharide (EPS), ice-binding protein and antifreeze protein producers (Cid and others, Reference Cid2016; Kielak and others, Reference Kielak, Barreto, Kowalchuk, van Veen and Kuramae2016; Chrismas and others, Reference Chrismas, Anesio and Śanchez-Baracaldo2018). These substances have been shown to facilitate and protect cells from freeze/thaw cycles and to alter ice crystal formation therefore providing cryoprotection to promote their survival in this challenging environment (Casillo and others, Reference Casillo2017; Deming and Young, Reference Deming and Young2017; Ali and others, Reference Ali2020). The Cyanobacteria found are also typical of the glacial environment (Lutz and others, Reference Lutz, Anesio, Edwards and Benning2017) and most of the genera (e.g. Phormidesmis, Pseudanabaena, Chamaesiphon and Tychonema) can form filaments, biofilms or colonies of organisms adapted to cope with the stress imposed by challenging environments (Lan and others, Reference Lan, Wu, Zhang, Hu and Liu2010; Singh and others, Reference Singh, Häder and Sinha2010). Segawa and others (Reference Segawa2017) studied biogeographic patterns in cyanobacterial species colonizing glacial surfaces worldwide identifying both cosmopolitan (e.g. Phormidesmis sp., Pseudanabaena sp. and Chamaesiphon sp.) and local distributed species that differentiated due to site-specific conditions. The presence of filamentous organisms and EPS exudates was also supported by microscopy observations (Figs S1g, h).
Although a distinction between clear and cloudy ice could be observed, microbial diversity and structure were mainly influenced by the location (Table 1a). The main microbial differences across sites were observed between the area with sites 1, 2, 3 and 4 and the one with sites 6, 7 and 8 (Figs 4, 5). The microbial community in sites 6, 7 and 8 differed from the others mainly because of the high abundance of the genus Clostridium, belonging to the phylum Firmicutes, which are spore-forming organisms (Ryall and others, Reference Ryall, Eydallin and Ferenci2012; Setlow, Reference Setlow2016). The ability to form spores gives these organisms an advantage in challenging environmental conditions, for this reason they have also been often observed as an essential part of atmospheric microbial communities (Els and others, Reference Els, Baumann-Stanzer, Larose, Vogel and Sattler2019a, Reference Elsb). These sites were also enriched with the phylum Acidobacteria, whose organisms are well-known acidophiles (Pankratov and Dedysh, Reference Pankratov and Dedysh2010; Goltsman and others, Reference Goltsman, Comolli, Thomas and Banfield2015) and Armatimonadetes which is not well characterized, but it is often associated with Cyanobacteria (Woodhouse and others, Reference Woodhouse, Makower, Grossart and Dittmann2017).
Differences between clear and cloudy ice were of secondary importance in explaining the observed variance in the taxonomy (Table 1a). Although similar microbial community structure and diversity were shared between the surface and subsurface samples of clear ice across all sites and cloudy ice across sites 1, 2, 3, 4 and 5; the microbial community of the subsurface cloudy ice of sites 6, 7 and 8 was different and presented a community structure characterized by many medium-abundant taxa and a less defined dominant community (Fig. 4b). Furthermore, these subsurface cloudy ice samples had a lower abundance of those genera that constituted the dominant community in the other samples and that we defined above as commonly found in the polar region (e.g. Phormidesmis and Hymenobacter; Fig. 4b). Other than Clostridium, which had a similar abundance in all the samples of sites 6, 7 and 8, the genera Bradyrhizobium and Sediminibacterium had a higher presence in the cloudy subsurface ice of these sites (Figs 4b, c). The genus Bradyrhizobium is mainly composed of plant symbiont nitrogen-fixers (Shah and Subramaniam, Reference Shah and Subramaniam2018) and Sediminibacterium is an ubiquitous genus often found in soil and fresh water environmental samples (Kim and others, Reference Kim, Nguyen, Weon and Yang2013; Kang and others, Reference Kang, Kim, Lee, Joung and Joh2014; Pinto and others, Reference Pinto2017). These two genera could have been transported to the glacier surface from the surrounding environment (Fig. 1b) and trapped in the ice by the successive snow deposition and firn/ice formation. Microbes are indeed brought to the glacier mainly by weathering phenomena and eolian transport (e.g. snowfall and dust) and therefore, the glacial communities are strictly dependent and conditioned by the surrounding environment (Boetius and others, Reference Boetius, Anesio, Deming, Mikucki and Rapp2015; Hotaling and others, Reference Hotaling, Hood and Hamilton2017). In the interior of the Storglaciären ablation zone, the ice is impermeable (Fountain and Walder, Reference Fountain and Walder1998) and, the microorganisms trapped in the ice veins or crystals (Mader and others, Reference Mader, Pettitt, Wadham, Wolff and Parkes2006) can only move few micrometers. Therefore, macroscale englacial pathways (crevasses, channels and moulins) represent the only way to move within the ice. In this context, englacial water (i.e. represented by the clear ice) could favor the development of a glacial microbial community that is different from the community associated with depositional processes. The cloudy ice could represent a more compartmentalized ice environment where microbial movement is more restrained and where the development of a well-defined glacial microbial community is slower than in the surface ablation zone and englacial channel environment. This pattern is confirmed by our results where microbial communities were more diverse between different cloudy ice samples, whereas communities in the clear ice were more homogeneous (Table 2). Furthermore, subsurface clear ice and all the surface ice samples shared a similar microbial community (Figs 4a, b). This could be due to the fact that glacial meltwater communities constitute an inoculum to englacial channel communities, therefore highly conditioning the englacial system.
Although Cyanobacteria are normally associated with the glacial surface because of their photosynthetic metabolism (Stibal and others, Reference Stibal, Šabacká and Kaštovská2006, Reference Stibal, Šabacká and Žárský2012b; Uetake and others, Reference Uetake, Naganuma, Hebsgaard, Kanda and Kohshima2010; Anesio and Laybourn-Parry, Reference Anesio and Laybourn-Parry2012), they have been previously found in meltwater streams (Makhalanyane and others, Reference Makhalanyane2015) and in englacial locations (Martinez-Alonso and others, Reference Martinez-Alonso2019). Cyanobacteria were less abundant in the subsurface cloudy ice of sites 6, 7 and 8, where there is a notable absence of a microbial community typical of glacial environment. Other than this clustering, only the cyanobacterial genus Pseudanabaena showed a differential distribution between ice types (Fig. 4c). The broad presence of Cyanobacteria in the clear ice may suggest that the cyanobacterial organisms are washed into englacial systems from the glacier surface. Once in the englacial habitat, they may serve as nutrient and energy source for the heterotrophic component of the englacial microbial community. Similar relative abundances of Cyanobacteria between ice types may indicate a slow degradation rate of organic material in the englacial community. Remineralization of nutrients would be expected to be slow considering the relatively low abundance of bacteria in subsurface samples (average of 7 × 10³ cells per mL).
Although the contrast between clear and cloudy ice communities was evident in sites 6, 7 and 8, sites 1, 2, 3 and 4 did not show any pattern between different ice types (Figs 4a, b). Ice from different sites would have different source locations and take different pathways through the glacier before emerging in the ablation zone (Cuffey and Paterson, Reference Cuffey and Paterson2010; Hudleston, Reference Hudleston2015). Therefore, as they formed at different times they would reflect the environment at that time and source region on the glacier. Importantly, microbial communities are strongly correlated with variations in nutrient and particle concentration, which can vary by some magnitude, spatially and temporally (Dieser and others, Reference Dieser, Nocker, Priscu and Foreman2010; Lutz and others, Reference Lutz2016; Uetake and others, Reference Uetake2019).
Ice geochemistry showed the same patterns as the ASV data where site location represented the main explanatory factor (Table 1a). Concentrations of Mg2+, Ca2+, Na+ and K+ were higher in sites 1, 2, 3, 4 and 5 compared to sites 6, 7 and 8. These ions are associated with the dissolution of soil and rock particles, therefore indicating a higher particle concentration in sites 1, 2, 3, 4 and 5 (Li and others, Reference Li2007) (Fig. 2). Hence, the higher presence of the spore-forming genus Clostridium in sites 6, 7 and 8 could be due to the low nutrient and low dust concentration in these sites. Low Ca2+ concentrations have been associated with low glacier pH (Li and others, Reference Li2007). Although we did not measure pH, sites 6, 7 and 8 had lower Ca2+ concentrations compared to the other sites and were enriched with species belonging to the Firmicutes and Acidobacteria phyla, which are known acidophilic organisms (González-Toril and others, Reference González-Toril2015). NH4+ was the only ion that showed a higher concentration in sites 6, 7 and 8, as well as a correlation with the presence of heterotrophic N2-fixers (e.g. Bradyrhizobium) and other heterotrophic organisms (e.g. Sediminibacterium and Salinibacterium) (Fig. 5). The enrichment of NH4+ in this area could be ascribed to the fixation of atmospheric nitrogen, however, due to the limited contact between the englacial environment and atmosphere, the high concentration of NH4+ in this area is more likely attributed to mineralization of organic N.
Cell concentrations and biovolumes did not show the same pattern as those observed in the taxonomical and geochemical data. Instead, ice type was the major explanatory factor (Table 1a). Higher nutrient concentrations at a site did not correspond to a higher cell concentration which was also observed by Chen and others (Reference Chen2016), leading to the conclusion that the nutrient presence shapes the microbial community structure, but not necessarily the microbial growth. An average of 104 cells per mL was observed by Grzesiak and others (Reference Grzesiak2015) on surface glacier ice and a concentration of 102–103 cells per mL was observed in subsurface ice (Mader and others, Reference Mader, Pettitt, Wadham, Wolff and Parkes2006). Surprisingly, the concentration did not change with depth suggesting that cell concentration was not influenced by irradiance levels. This lack of microbial differences between surface and subsurface layers may be due to the typical irregular ice stratigraphy of the glacier ablation zone (Perolo and others, Reference Perolo2019). However, the variance observed in these datasets was largely explained by the factor ‘ice type’, and prokaryotic cell concentrations and biovolumes were significantly higher in the surface clear ice compared to all the other ice types (Table 1 and Fig. 3). The fact that surface clear ice could represent a more favorable environment for cell growth compared to the other ice types may suggest that the englacial water constitutes an environment where the cells are alive (e.g. metabolically active or in a dormant state) and then, once the englacial communities are exposed to the glacier surface due to glacier ice movements, the organisms can thrive under the new favorable conditions (e.g. higher irradiance and nutrient concentrations) (Yallop and others, Reference Yallop2012).
The glacier ice, although seemingly impermeable, is fractured by crevasses and perforated by an extensive network of englacial pathways (Fountain and Walder, Reference Fountain and Walder1998) which play a pivotal role in regulating flow of water and nutrients between the surface and bed. The indirect sampling approach we used to sample englacial and meteoric ice enabled us to successfully characterize microbial communities in englacial passages and to answer our hypothesis, focused on whether these communities differed from those found in the surrounding meteoric ice. Different microbial communities were found in frozen englacial water (i.e. clear ice) and meteoric ice (i.e. cloudy ice) where the clear ice was populated by taxa typical of glacier environments and similar to those observed in the supraglacial realm, whereas the cloudy ice was populated by taxa more typical of the landscape surrounding the glacier. The difference in the spatial distribution of the microbial communities in the two ice types shows the preservation of spatial patterns in meteoric ice reflecting the deposition; and homogenization caused by water transport and mixing in the englacial system, highlighting the role of the englacial channels in dispersing and transporting the microbial community inside the glacier (and presumably to the subglacial region), and possibly in shaping the cold-adapted microbial community. Furthermore, englacial hydrology is highly conditioned by the thermal regime of the glaciers (Irvine-Fynn and others, Reference Irvine-Fynn, Hodson, Moorman, Vatne and Hubbard2011) which it has previously been observed to likely affect glacial ecosystems (Edwards and others, Reference Edwards2011). Due to the explorative and descriptive nature of this study, further studies focusing on englacial microbial communities in glaciers subjected to different thermal regimes and conditions are needed in order to support our observations and to further enlighten the englacial role into microbial dispersion and differentiation in glacial environments.
5. Conclusion
In this study, we utilized an indirect sampling method to characterize microbial communities found in englacial water. We were able to compare microbial communities from englacial water (clear ice) to meteoric glacier ice (bubble-rich cloudy ice). Although microbial communities were primarily shaped and structured by their spatial distribution on the glacier, ice type was an important secondary factor. A set of samples from one location on the glacier presented significant community differences between clear and cloudy ice. Although the clear ice communities were similar to those observed in the supraglacial realm and presented typical cold-adapted glacial communities, the cloudy ice presented a less defined glacial community with more organisms from the surrounding non-glacial environment. The cloudy ice provides a picture of the original microbial community wind-transported to the glacier surface from the surroundings and then buried by subsequent snow events, eventually compacted and turned into glacial ice. The clear ice captures that portion of the microbial community that survives in the glacial habitat and originates from the supraglacial realm. These results suggest a role of the englacial hydrological system in the dispersion, and possibly the shaping, of a glacial microbial community within the glacier. Metatranscriptomic studies of the englacial communities would help to further define community metabolism and the role of Cyanobacteria in these habitats.
Supplementary material
The supplementary material for this article can be found at https://doi.org/10.1017/jog.2021.30.
Acknowledgements
We are grateful for all the assistance we received from the Tarfala Research Station crew which made our sample collection and processing smooth and efficient. We thank Jane Coghill and Christy Waterfall at the Bristol Genomics Facility for the Illumina sequencing. We thank Miranda Nicholes for her help in the cell counting data generation. We also thank the editor and reviewers for their thorough and constructive comments. Sampling activity was funded by the INTERACT Transnational Access program and the European Union's Horizon 2020 research and innovation program under the Marie Skłodowska-Curie grant agreement No. 675546 (MicroArctic network). The latter also provided funding support for GV and AH. Funding support was also provided through the NERC grant NE/J02399X/1 awarded to GB, AA and MY. AA also acknowledges a grant from the Aarhus University Research Fund.
Author contributions
AA and AF designed the study. AA, AF and GV performed field observation and sampling activities. AH performed the geochemical analysis. GV prepared 16S rRNA amplicons for the Illumina sequencing and performed the data analysis. GV, AA, AF, GB, MY and AH interpreted the results and wrote the manuscript.


 Open access