


Introduction
In the evening (shortly after 2000 h local time) of 20 September 2002, a large rock/ice slide took place on the northern slope of the Kazbek massif, Northern Ossetia, Russian Caucasus. From the north-northeast wall of the summit of Dzhimarai-Khokh (4780 m a.s.l.), steeply inclined meta- morphic rock layers were detached, entraining snow, firn and ice from steep hanging glaciers. Smaller but frequent precursory events had lasted several days to weeks and had heavily covered the surface of Kolka glacier at the foot of the wall with fresh mud and rock/ice debris. The main event sheared off the glacier and enlarged the initially detached mass with large amounts of snow/firn/ice, morainic material and water. After sliding along a trajectory of about 18 km, the moving mass together with additionally eroded debris from talus and slope deposits was strongly compressed at the entrance of the Genaldon gorge (~1300 m a.s.l.) near the village of Karmadon. There, it ejected a debris/mud-flow which continued for another 15 km through the Genaldon gorge and into the Giseldon valley (Fig. 1). More than 120 people were killed (including a film crew at work near Karmadon), and the access road through the Giseldon valley and Genaldon gorge – one of the region’s main tourist attractions – was destroyed. The compressed slide deposit of >100 × 106m3 dammed the river, causing the formation of several lakes. The largest of these new ice/debris-dammed lakes, with a volume of several million m3, inundated parts of the village of Gornaia Saniba at the right (eastern) side of the valley near Karmadon. It also constituted a growing threat to the population of the down-valley town, Gisel.
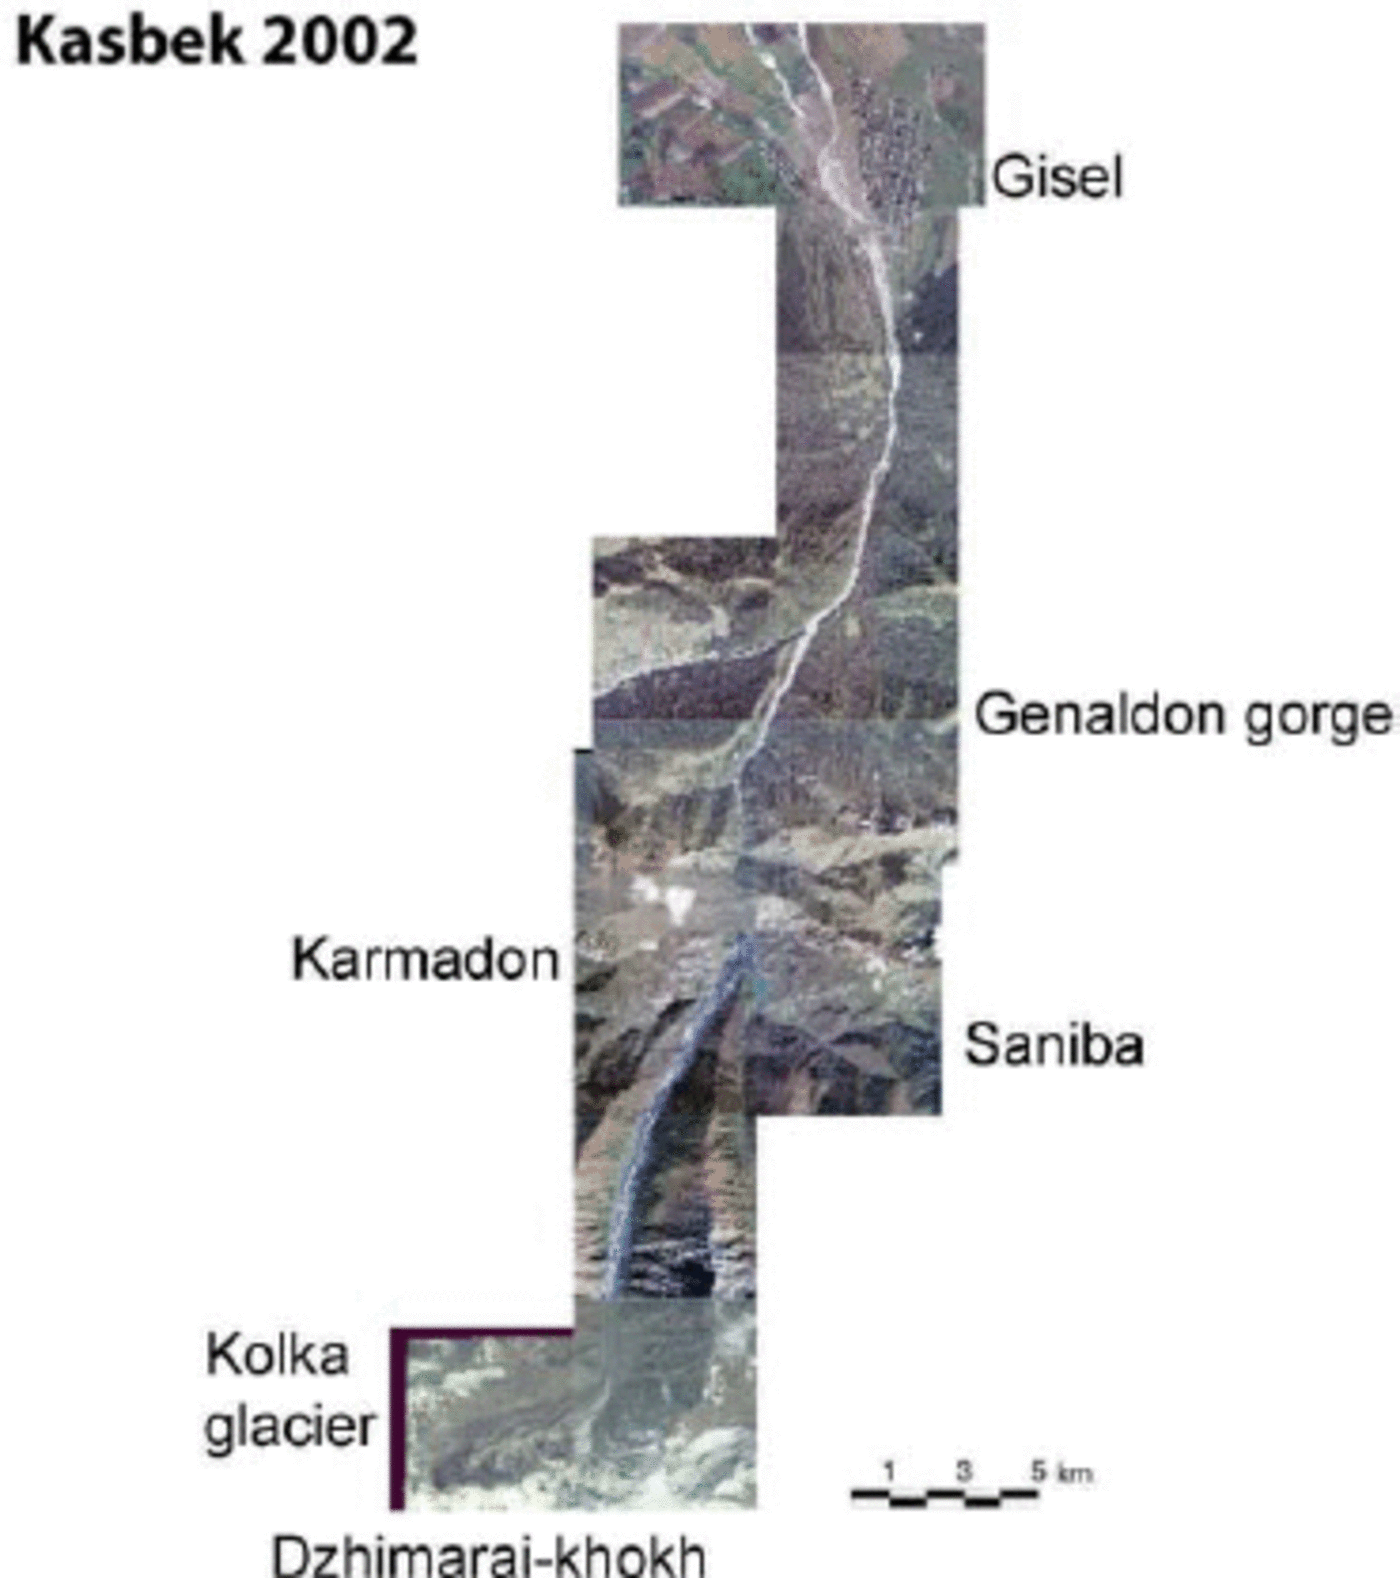
Fig. 1. Schematic map and situation after the event with names of most important sites. Quickbird image of 25 September 2002.
As is often the case with such dramatic events, rumours (often from diffuse sources) and controversies immediately started within the population, the media and the scientific community (Reference Kotlyakov, Rototaeva, Desinov, Zotikov and OsokinKotlyakov and others, 2004a, Reference Kotlyakov, Rototaeva and Nosenkob; Reference Petrakov, Tutubalina and ChernomoretsPetrakov and others, 2004;cf. also notes by M.G. Berger, L.V. Desinov, M.U. Nikitin and others, D.A. Petrakov and others, C. Huggel and others, and R.A. Chernov and K.P. Rototaeva in RNO-A, 2004). The main points raised concerned whether
1. the event was related to similar catastrophic slides in 1835 and 1902 from the same mountain,
2. it was a repetition of the scientifically investigated and documented 4.5 km surge of Kolka glacier in 1969/70,
3. the catastrophe could thus have been foreseen by the government and preventive actions taken,
4. a similar or even larger event could occur again in the immediate future and constitute a threat to rescue personnel in the zone of destruction,
5. outbursts of lakes dammed by the slide deposits could trigger devastating flood waves and destroy or damage the down-valley settlement of Gisel, and
6. what the appropriate steps would be to avoid further catastrophic events in the future.
The government of North Ossetia thus started collaboration with the Hazard Prevention Group of the Swiss Humanitarian Aid Unit and the Russian Academy of Sciences. During a visit to the site from 2 to 6 October 2002 a first assessment was prepared and issued to the government and the media, in order to clarify the situation for the people in the region. At the same time, plans were initiated to build continued cooperation with respect to hazards, climate-change effects and environmental aspects in the high mountains of the Ossetian Caucasus. Since then, several reports on partial aspects of the event have appeared (Reference DesinovDesinov and others, 2002; Reference Haeberli, Huggel, Kääb, Polkvoj, Zotikov, Osokin, Haeberli and BrandovàHaeberli and others, 2003; Reference Kääb, Wessels, Haeberli, Huggel, Kargel and KhalsaKääb and others; 2003b; Reference Popovnin, Petrakov, Toutoubalina and TchernomoretsPopovnin and others, 2003; Reference Kotlyakov, Rototaeva, Desinov, Zotikov and OsokinKotlyakov and others, 2004a, Reference Kotlyakov, Rototaeva and Nosenkob; Reference Petrakov, Tutubalina and ChernomoretsPetrakov and others, 2004), and an international conference on related aspects was organized in June 2004 at Vladikavkaz (GRNO-A, 2004). It is now clear the catastrophe constitutes an event of historical dimensions that must be reflected in glacier and permafrost hazard research in high mountain areas. This paper aims at compiling the most important facts in order to open the possibilities for further analyses and international exchange of information concerning events such as occurred here.
Immediate Actions
Disaster-area visits during the first days after the event by experts on ice and water hazards helped to assess the situation. Close collaboration between the experts and representatives of the regional administration allowed definition of a list of priorities for monitoring the situation and forecasting the most probable scenarios.
The first information about the event was received by the duty officer of the Ministry of Emergency Situations (MES) of the Republic of North Ossetia-Alania from the inhabitants of Gisel, and from the control point of the energy company Sevkavenergo which reported the breakdown of the high- voltage lines from the Ezmin hydroelectric power station to Karmadon at 2013 h Moscow time (Fig. 2 and Fig. 3). During the night, the MES service, the officers of the Ministry of Internal Affairs and the local population activated search-and-rescue operations in the region of the water scoop of Gisel. The Search and Rescue Service (SRS) of North Ossetia reconnoitred the Karmadon gorge via the Fiagdon river route and found that a slide involving a huge mass of ice had occurred.

Fig. 2. Avalanche deposits at Karmadon. The overridden lower village and the former research station are at the lower left of the image; the partly inundated village of Gornaia Saniba is to the right (cf. Fig. 3). The entrance to the narrow Genaldon gorge, where the mud-flow started from the compressed avalanche, is in the upper centre of the image. Photo: I. Galushkin, 22 September 2002.

Fig. 3. Drowned houses in the lake dammed by the avalanche at Gornaia Saniba. Photo taken by Ministry of Natural Resources, North Ossetia, 25 September 2002.
At 0700 h on 21 September an MI-8 helicopter of MES made the first flight over the region. The chief of MES was the first to conclude there had been a rock/ice slide from the area of Kolka glacier, provoked by the collapse of one of the hanging glaciers at the Maili-Khokh-Dzhimarai-Khokh ridge. The next flight over the region, by experts from the Department of Natural Resources and Preservation of the Environment, carried out aerial inspections and a photo and video survey of the area. These observations enabled the dimensions of the event to be determined. Simultaneously, groups of geologists carried out ground observations using the Fiagdon routes to the region of the sanatorium, Karmadon, and via Chmi village to the region of the settlement, Gornaia Saniba. According to MES, the ice/rock slide followed by the debris/mud-flow completely destroyed 11 dwelling houses, a three-storey bath building, the Karmadon sewage disposal plant, a mineral-water bottling plant, six wells, two recreation places and four bridges. The total damage was estimated at 547 million roubles. The estimated number of deaths is about 120. In reality this number could be considerably higher as unregistered refugees from South Ossetia were said to have settled in the overriden valley area.
Beginning on 25 September, experts of the Hydrometeorological Service, with the help of the Beginning on 25 September, experts of the Hydrometeorological Service, with the help of the Department of Natural Resources and Preservation of the Environment, organized hydrological measurements of the water level in the dammed lake Gornaia Saniba. They determined discharge of the Kauridon, Fardon and Genaldon rivers which flow into the area of the ice/debris dam. Hydrological observations of the water discharge in the Giseldon river were also established in the Gisel region.
On 28 September, a control post was organized on the rock spur above the ‘Karmadon gates’ (the narrow entrance to the gorge) to carry out 24 hour visual observation of the situation at the dammed lakes, including radio retransmission of the data from the hydrological observations.
Available Information
The most important documents forming the basis for an assessment of what happened, and of likely scenarios, are scientific publications about conditions and earlier events in the region, eyewitness reports (very few), images and maps compiled immediately after the event, and satellite imagery which played a special role in this case.
Reports on earlier events
Reference HoinkesHoinkes (1972) and Reference Popovnin, Petrakov, Toutoubalina and TchernomoretsPopovnin and others (2003) provide an overview of the scientific literature concerning Kolka glacier and special events in the Karmadon area. In 1835, a locality known as Genal in the valley above Karmadon was destroyed by an event which cannot be defined more precisely. In 1902, two ice/rock slides killed 30 people near the localities of Karmadon and Tmenikau (~1700 m a.s.l.) and at Werkhni Karmadon (2300m a.s.l.) where a bath with huts had been constructed at hot sulphurous sources (temperatures of 44-55°C) formerly covered by the snout of Kolka glacier. A report by Poggenpohl (1903/05), who visited the area in August of the same year (1902), documents an event with many similarities to the recent rock/ice slide but with a strikingly shorter runout path. This report mentions that traces of two slides of 3 and 6 July were visible and that a compact mass of snow, ice and rocks covered the valley floor over a distance of 12 km. Large blocks of ice had been thrown high up the slopes. The source of the slides was clearly identified as being the north- northeast wall of Dzhimarai-Khokh. Four hanging glaciers fell on 3 July, passed over the tongue of Maili glacier and covered the 12 km long path within 4min, indicating an average travel speed of about 180 km h-1. Two other hanging glaciers fell 3 days later, forming an even larger slide. The slides seemed to have advanced in gigantic waves as interpreted from the traces in the valley. Flow height was about 100m in the locality of the destroyed bath, with individual blocks being thrown to heights of 140 m. Poggenpohl’s report makes no mention of any destructive effects or instability related to Kolka glacier during these events.
A surge of Kolka glacier started in the fall of 1969. By 1970, the glacier had advanced by 4.5 km. This event was studied and described in detail by Reference KhodakovKhodakov (1974), Reference RototaevRototaev (1974) and Reference Rototaev, Khodakovand and KrenkeRototaev and others (1983). During this surge event, the heavily crevassed glacier advanced with typical velocities of metres to a few tens of metres per day over a total distance (4.5 km) exceeding its original length (3 km), but without losing connection to its accumulation area. With respect to flow velocities (metres per day vs kilometres per hour) as well as internal coherence of the ice (extreme longitudinal extension vs complete detachment), the surge event of 1969/70 clearly differed from the events of 1902 (velocity) and 2002 (velocity, separation). Such differences necessitate the use of terms like ‘avalanche’, ‘slide’ or ‘debris flow’, rather than ‘surge’, for the event of 2002. The classical surge of 1969/70, however, clearly illustrates that the debris-covered Kolka glacier is able to decouple from its (sediment) bed.
Eyewitnesses, images and maps
Mountain climbers who visited the valley and the source area a few days before the event (around 10 September) observed large changes with respect to an earlier visit in 2000 (e-mail report with digital photographs from A. Glazovsky). Widespread mud-flows along the slope and in the channel of the Karmadon river had demolished previously existing trails and deposited ice, mud and stones on river-banks. Rock- and icefall events continued uninterrupted over a distance of about 1 km from the walls of Dzhimarai-Khokh, and three large lakes had formed in the upper reaches of the river. Corresponding photographs indicate extended sections of rock and ice in the source wall, and adjacent slopes had been unstable (Fig. 4). Signs of a surge or extraordinary flow behaviour (e.g. extreme crevassing) of Kolka glacier were not obvious. Visible surface water, however, might have indicated high subglacial water pressure.

Fig. 4. Surface of Kolka glacier and north-northeast wall of Dzhimarai-Khokh a few days before the event. Traces of strong ice- and rock-fall activity within the lower part of the wall are clearly visible. Photo taken by a group led by A. Falin.
Personal reports of the event itself from people living near the destruction zone are extremely scarce. A couple living at a distance of only a few hundred metres from the left (western) margin of the deposits explained to the authors (W.H., A.P., I.Z and N.O.) that ‘a white cloud had come through the dark’. Another person mentioned to government representatives that he had heard ‘a noise like a heavy construction machine’ while leaving the village of Gornaia Saniba by car. The absence of any mention of extreme sounds is striking; the enormous mass may have slid down in a cloud of snow/water/ice/dust powder which absorbed much of the acoustic energy. It seems to have arrived at Karmadon as a sudden surprise to local inhabitants.
The most important observations carried out during the first weeks after 21 September, and documented by government representatives, include:
1. Aerial observations with photo and video surveys by local experts (G. Dolgov, V. Drobyshev and A. Polkvoj on 2122 September 2002;I. Galushkin and O. Goncharenko on 24-25 September and 6 October 2002;A. Karaev, 1. Galushkin and O. Goncharenko on 16 October 2002).
2. Ground observations with photo and video surveys by experts in the area of the ice obstruction (I. Galushkin and O. Goncharenko on 21-22 September 2002; M. Bagov and U. Ilichev on 22-23 and 25 September 2002;W. Haeberli, C. Huggel, N. Osokin and I. Zotikov on 3 October;E. Taratynko, A. Misetov and V. Adtseev on 24 October and 16 November 2002;I. Galushkin, A. Misetov, A. Polkvoj and V. Adtseev on 15 and 23 February and 2 March 2003.
3. Observations by experts from the ice dam upwards along Genaldon valley to Maili glacier tongue from 6 to 9 May 2003 (I. Galushkin, C. Huggel, A. Kääb, A. Misetov, S. Oswald and E. Zaporovzshenko).
4. 24 hour observations by the climber’s post from the spurs of the rocky range in the region of the Karmadon gates during October-November 2002.
Documentation of observations was generally by digital photographs and video footage;in some cases, negatives made with film cameras were scanned and converted into digital format. On 16 November, in addition to the usual inspections, aerial photography was carried out from the mouth of the Giseldon river to the tongue of Maili glacier using an aerial camera with black-and-white film. The basis for the cartography of the disaster area was a State Topographical Map at a 1 : 200 000 scale, and selected land-surveying plans at 1 : 10 000 scale from the 1980s to 1990s. On the morning of 22 September, a 1 : 200 000 map of the whole affected zone and a special 1 : 10 000 map of the ice obstruction and transit path were drawn on the basis of information from the photographs and the video recordings. The morphology of the ice obstruction was detailed afterwards (on 25 September) by means of a stadia survey of its surface using a laser non-catoptric range-finder (V. Drobyshev and V. Maklikov).
Satellite imagery
Difficult access conditions to the event starting zone and poor current topographic information suggested the use of satellite imagery for event reconstruction (Fig. 5-Fig. 7). High-resolution satellite sensors such as the Landsat-7 Enhanced Thematic Mapper Plus (ETM+; 15m ground resolution for panchromatic band) and the Advanced Spaceborne Thermal Emission and Reflection Radiometer (ASTER; 15 m ground resolution for visible and near-infrared bands (VNIR)) support recognition of important indicators of glacier-related hazards (e.g. avalanche and debris-flow trajectories, glacier crevasses and glacial lakes). In particular, ASTER has proved to be very suitable for assessing glacier hazards (Reference KääbKääb, 2002; Reference Wessels, Kargel and KiefferWessels and others, 2002; Reference Huggel, Kääb, Haeberli and KrummenacherHuggel and others, 2003; Kääb and others, 2003a). Thanks to their along-track stereo capability, ASTER data allow us to generate digital elevation models (DEMs) (Reference KääbKääb, 2002; Reference KääbKääb and others, 2003a), which form an essential component in prediction and reconstruction of hazard events. Recognizing the importance of documenting the Kolka event, the ASTER science team at NASA’s Jet Propulsion Laboratory, Pasadena, California, and the Japanese Earth Remote Sensing Data Analysis Center (ERSDAC), Tokyo, gave highest acquisition priority to this area (Reference Kääb, Wessels, Haeberli, Huggel, Kargel and KhalsaKääb and others, 2003b). Advantage was taken of the ASTER VNIR sensor’s cross-track pointing capabilities of up to ±24°, which enables reduction of the normal 16 day nadir track repeat period to just 2 days. ASTER was therefore a primary information source and was used extensively for evaluating the immediate flood hazards after the slide, and to examine each of the event starting, transition and deposition zones. The pre-event situation could be assessed using 22 July 2001 and 3 October 2001 ASTER imagery. A few days after the event, conditions were evaluated using an ASTER image from 27 September 2002, whereas ASTER images from 6 October 2002 and 22 October 2002 were mainly used for remote observation of the hazards posed by the lakes (Kaab and others, 2003b). The 6 October 2002 stereo imagery has also been used for DEM generation (Fig. 8). Soon after the event, it was realized that an accurate topographic basis, necessarily exceeding ASTER’s ground resolution, would be indispensable for reconstruction of the event and for subsequent hazard mitigation. Therefore, a QuickBird satellite image from 25 September 2002 was acquired. QuickBird has recently emerged as the commercial space-borne sensor with the highest ground resolution, -0.6 m in panchromatic and 2.4 m in multi- spectral mode. There is so far little experience of using QuickBird imagery for glacier hazard studies, due to its short operation time and high acquisition costs. First investigations within this project indicate the high potential of these data for detailed studies including planning. Difficulties were encountered, however, with the processing of exactly ortho-rectified imagery since the high- resolution DEMs and the high-accuracy ground-control points needed for most accurate ortho-correction processing are usually not available in remote high-mountain areas.
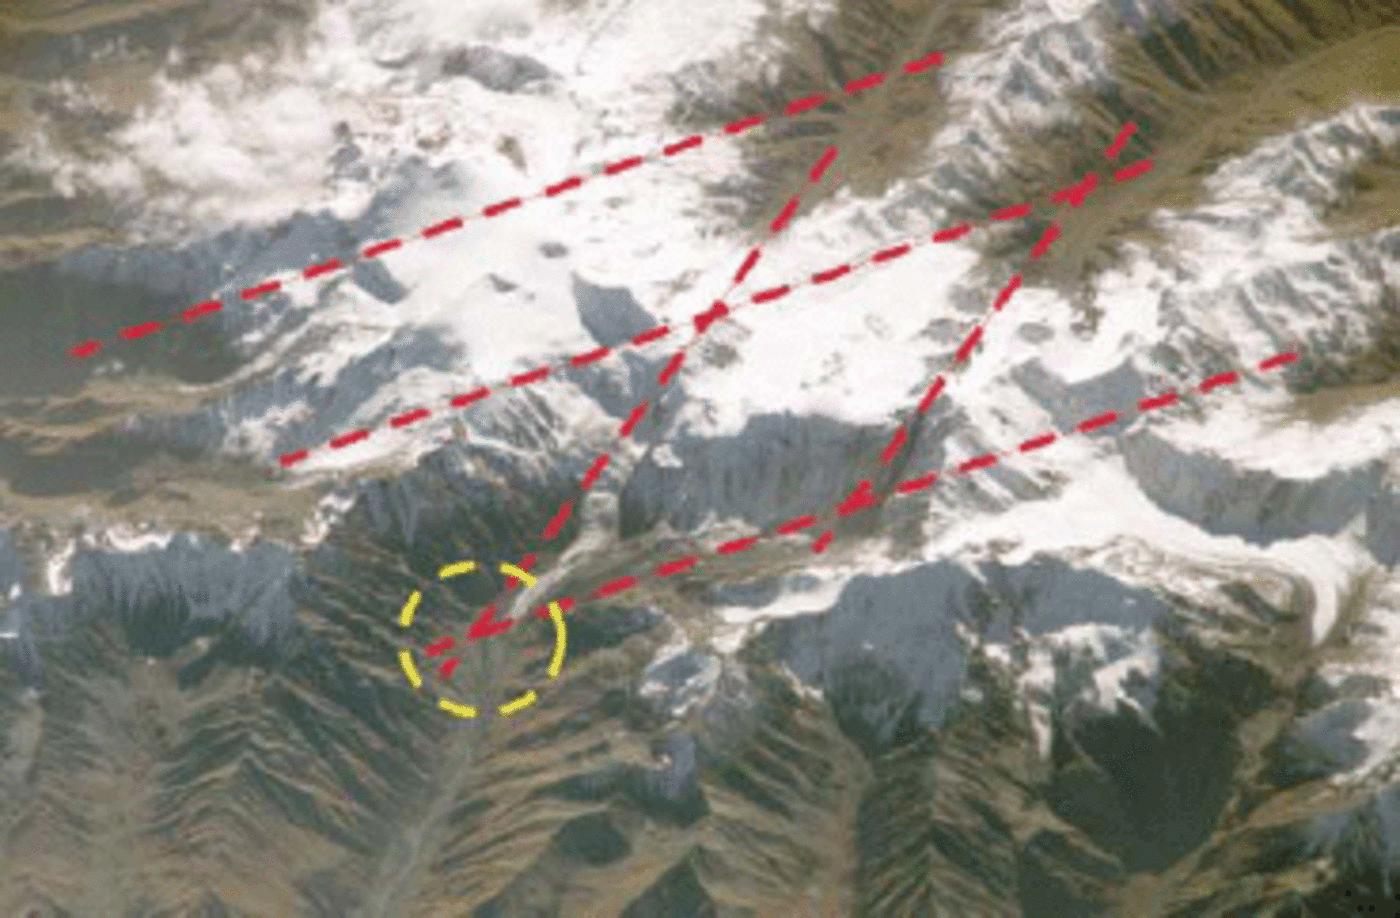
Fig. 5. Oblique view to the Kazbek massif with approximate direction of major faulting (red dashed and dash-dotted lines) and hot-spring area (yellow circle) indicated. International Space Station-Russian Program Uragan, 17 October 2002.

Fig. 6. ASTER images of 22 July 2001, 27 September 2002 and 29 September 2002, showing the avalanche path before and after the event.
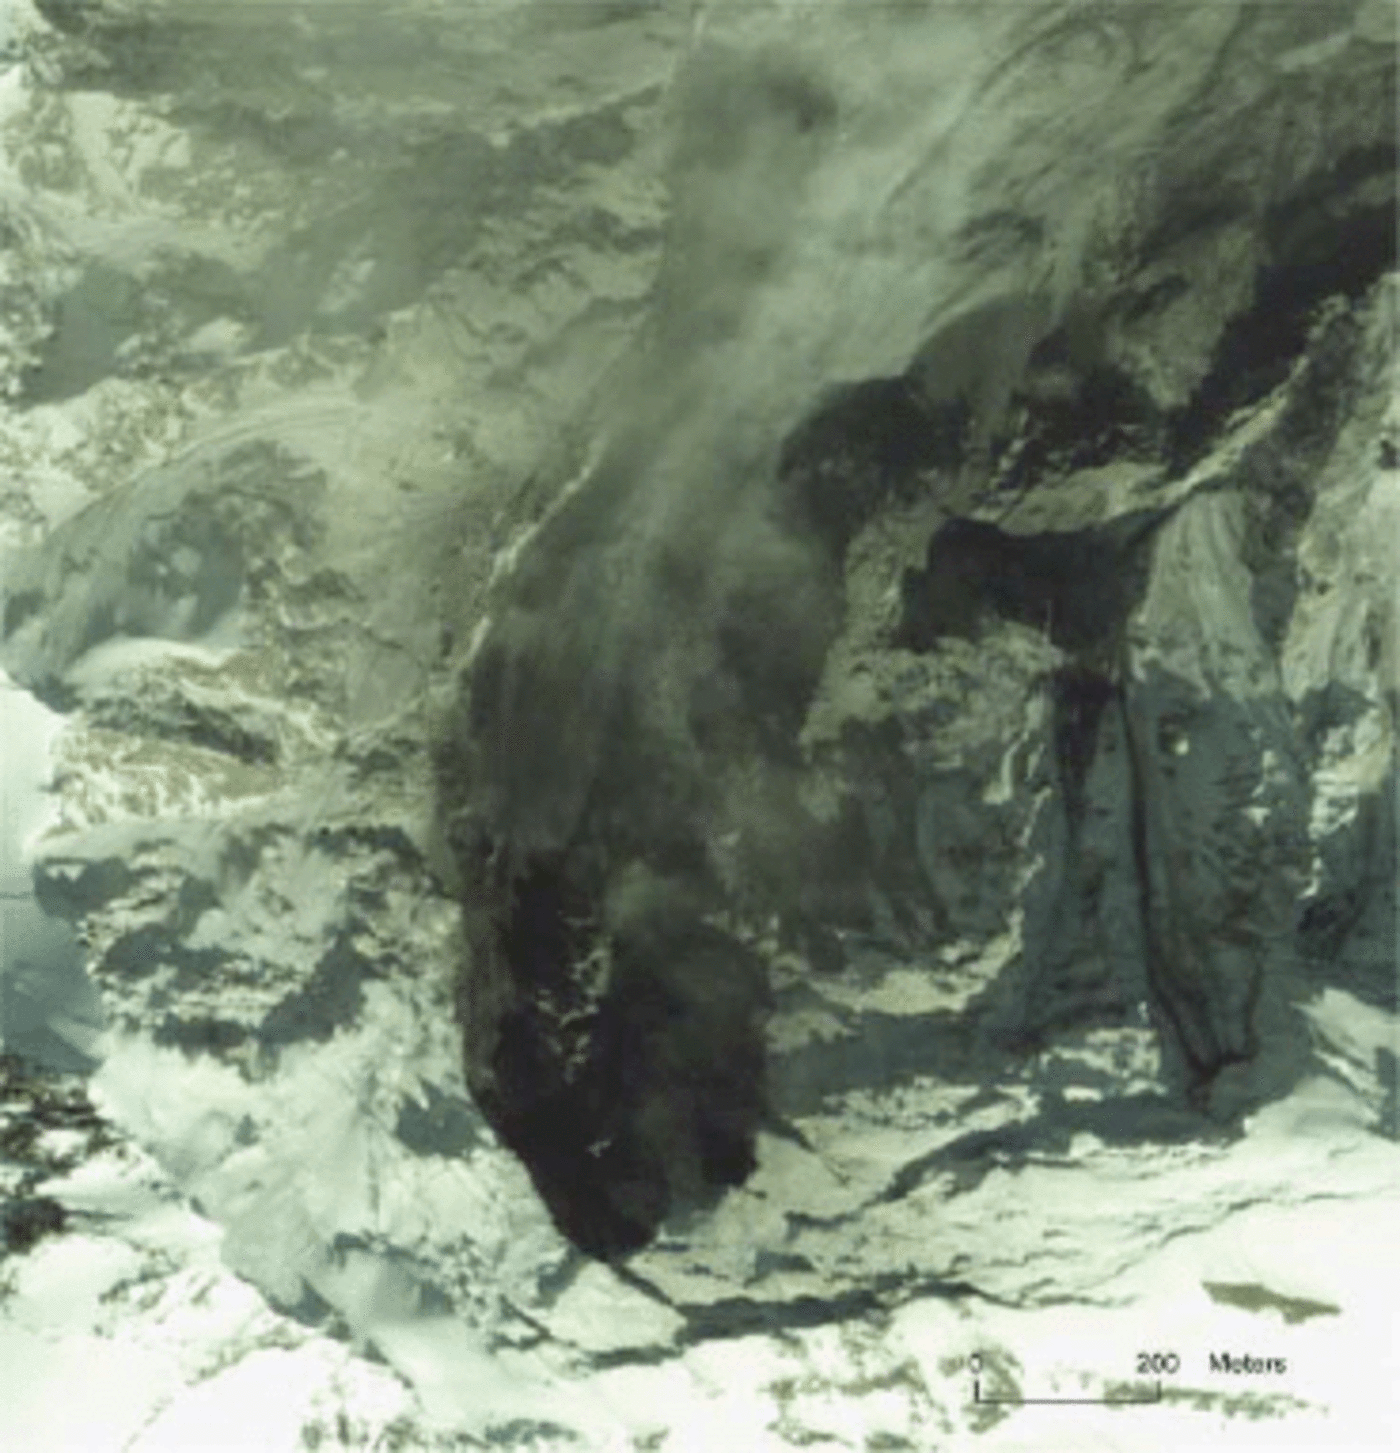
Fig. 7. Detail of the detachment zone from Quickbird image of 25 September 2002. Note black traces of rock instability to right of the dark starting zone of the main event.
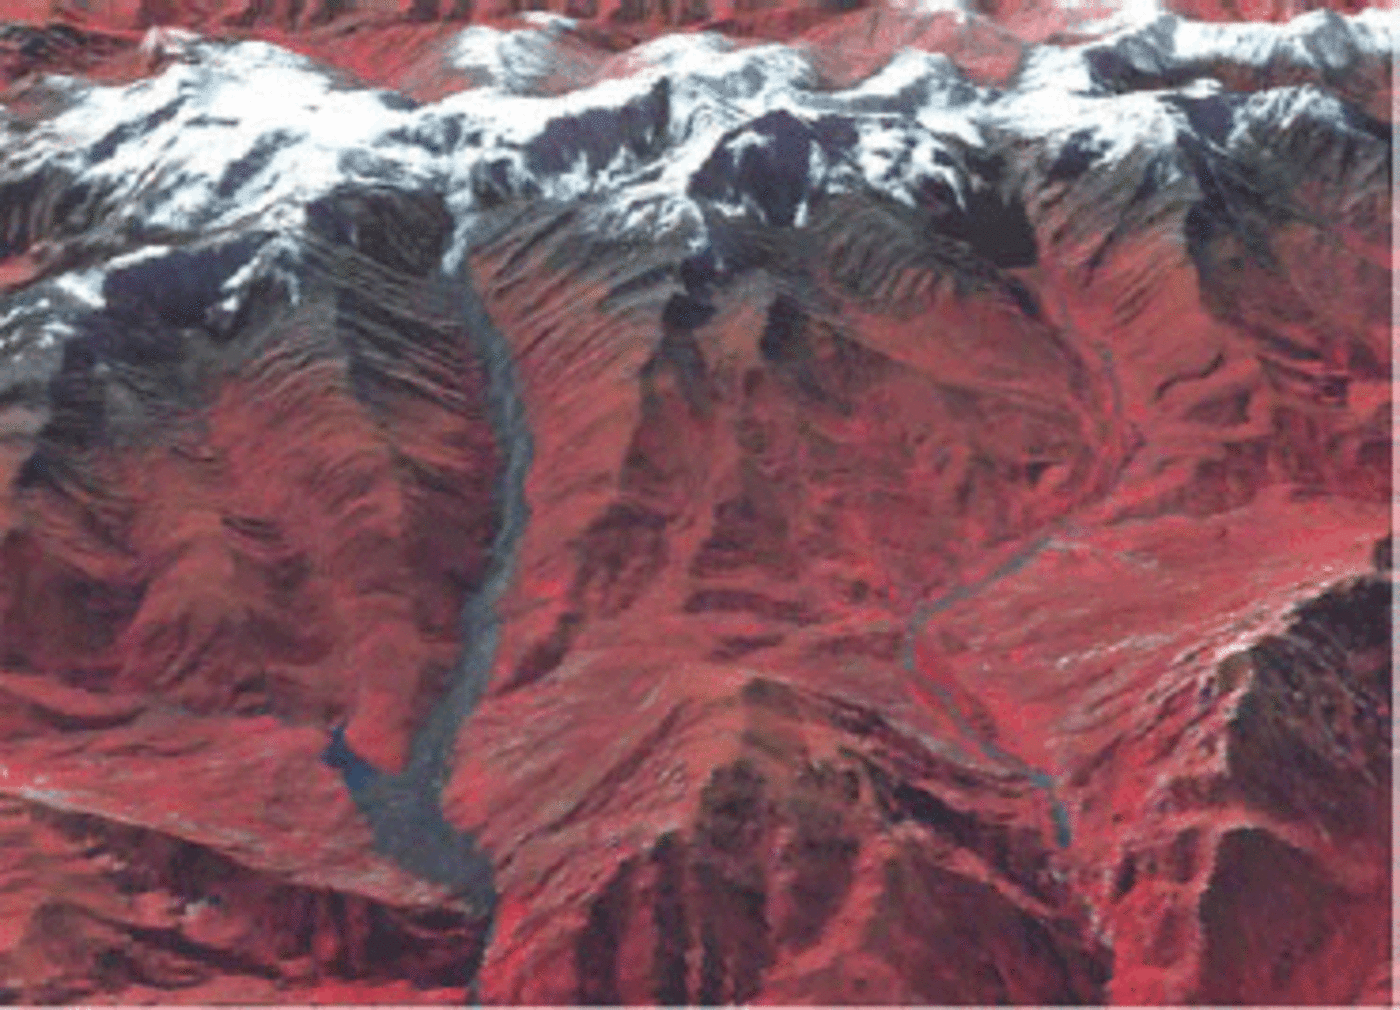
Fig. 8. ASTER scene of 6 October 2002, channels 1, 2 and 3N, combined with ASTER DEM from the same image; resolution resampled from 30 to 15 m. Satellite data provided by Global land Ice Measurements from Space (GLIMS), US Geological Survey/NASA.
Reconstruction and analysis
It is useful to separately consider (1) the triggering events at the north-northeast wall of Dzhimarai-Khokh and (2) the complex flow processes starting with the erosion of major parts of Kolka glacier.
Starting zone
One of the most urgent tasks was to assess the potential for an immediate repetition of similar or even larger incidents at the mountain slope. This involved interpretation of photographs collected by the authorities during the reconnaissance flights, together with some best guesses about thermal aspects related to firn, ice and permafrost conditions in the starting zone. The fact that two large slides from the same slope but with considerably shorter runout distances had occurred in 1902, almost exactly 100 years before, constituted an important aspect of this assessment (Reference Haeberli, Huggel, Kääb, Polkvoj, Zotikov, Osokin, Haeberli and BrandovàHaeberli and others, 2003).
The slide starting zone (shown in Fig. 9) was located between about 4300 and 3500 m a.s.l. Approximately 4 × 10⁶m3 of steeply inclined metamorphic rock layers were detached in the upper part of the slope to about 40m depth, entraining a similar thickness/volume of snow, firn and glacier ice. A system of fissures cuts through the bedrock layers, and the slope of a dip in these layers, as visible in the detachment zone after the event, was less than the inclination of the now exposed surface. In fact, the resulting unsupported outcrops of steeply inclined bedrock layers in the lower part of the affected slope (arrow in Fig. 9) could have constituted an important geological influence on stability conditions. In any case, the primary cause of the instability must have been within the bedrock rather than in the surface ice. In view of the fact that bedrock stability in cold mountain areas can be especially low in warm or degrading permafrost (Reference Davies, Hamza and HarrisDavies and others, 2001), thermal conditions affecting ice and water within rock fissures are likely to have exerted a major detrimental influence.
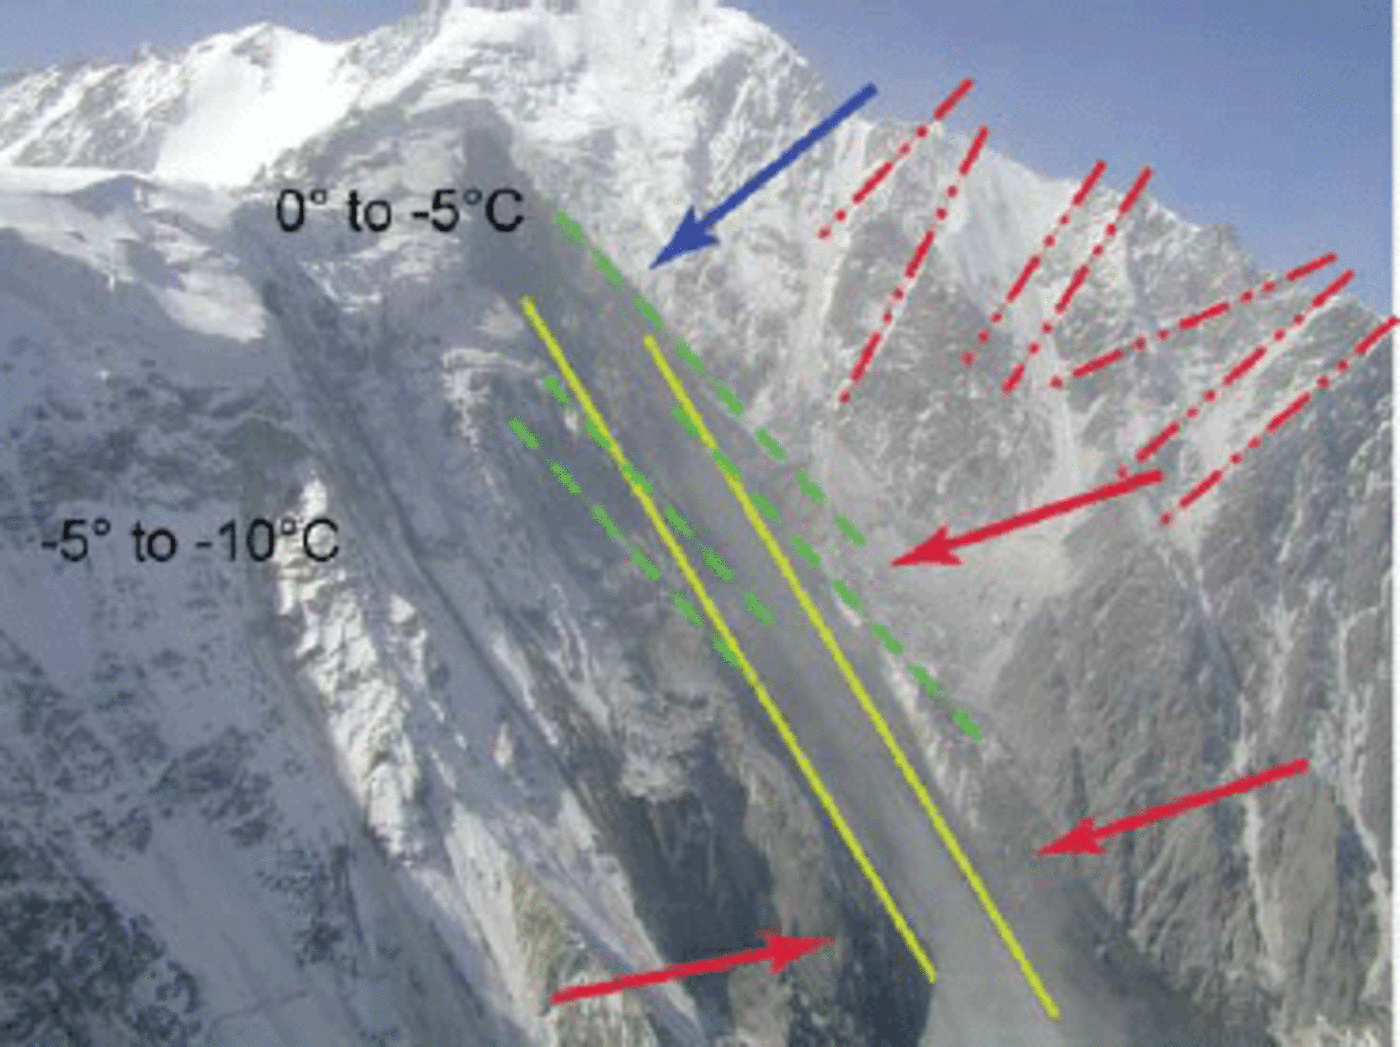
Fig. 9. Starting zone of the Kolka-Karmadon rock/ice slide in the highest part of the north-northeast wall of the summit of Dzhimarai- Khokh (blue arrow points to vertical cut through hanging glacier and bedrock). The general dip of the layering within the meta- morphic rocks is indicated with green dashed lines, two general directions of fracturing with red dash-dotted lines, the inclination of the main slope and failure plain with yellow lines. With the general slope cutting through the less steep layering, unsupported outcrops of steeply inclined rock layers formed (red arrows). Temperature indications refer to exposed rock surfaces/vertical ice cliffs and to firn surfaces of hanging glaciers. Photo: I. Galushkin, 25 September 2002.
A weather station near Karmadon had been run between 1962 and 1987, showing a mean annual air temperature (MAAT) of 5.9°C. Assuming a warmer recent MAAT of about 7°C at 1 300 m a.s.l., and a MAAT lapse rate of 6 ± 0.1 °C (100 m)-1, present-day mean annual air temperature can be estimated at -6 ± 2°C at the lower and -11 ± 3°C at the upper end of the detachment zone. The existence of creeping perennially frozen debris (active rock glaciers) in the region (Fig. 10)) confirms that the lower boundary of discontinuous mountain permafrost is around 2500 m a.s.l., where MAAT is slightly below 0°C. Direct minilogger measurements in the Alps (Reference Gruber, Peter, Hoelzle, Woodhatch and HaeberliGruber and others, 2003) indicate mean annual rock temperatures tend to be somewhat higher than air temperatures extrapolated from weather stations. This effect, however, is to some degree compensated by the fact that the affected slope is oriented away from the sun and hence will be colder than average. In the absence of any direct measurements or numerical model results, bedrock surface temperatures in the detachment zone may be estimated at about -5 to -10°C, indicating bedrock conditions of cold permafrost after the event.
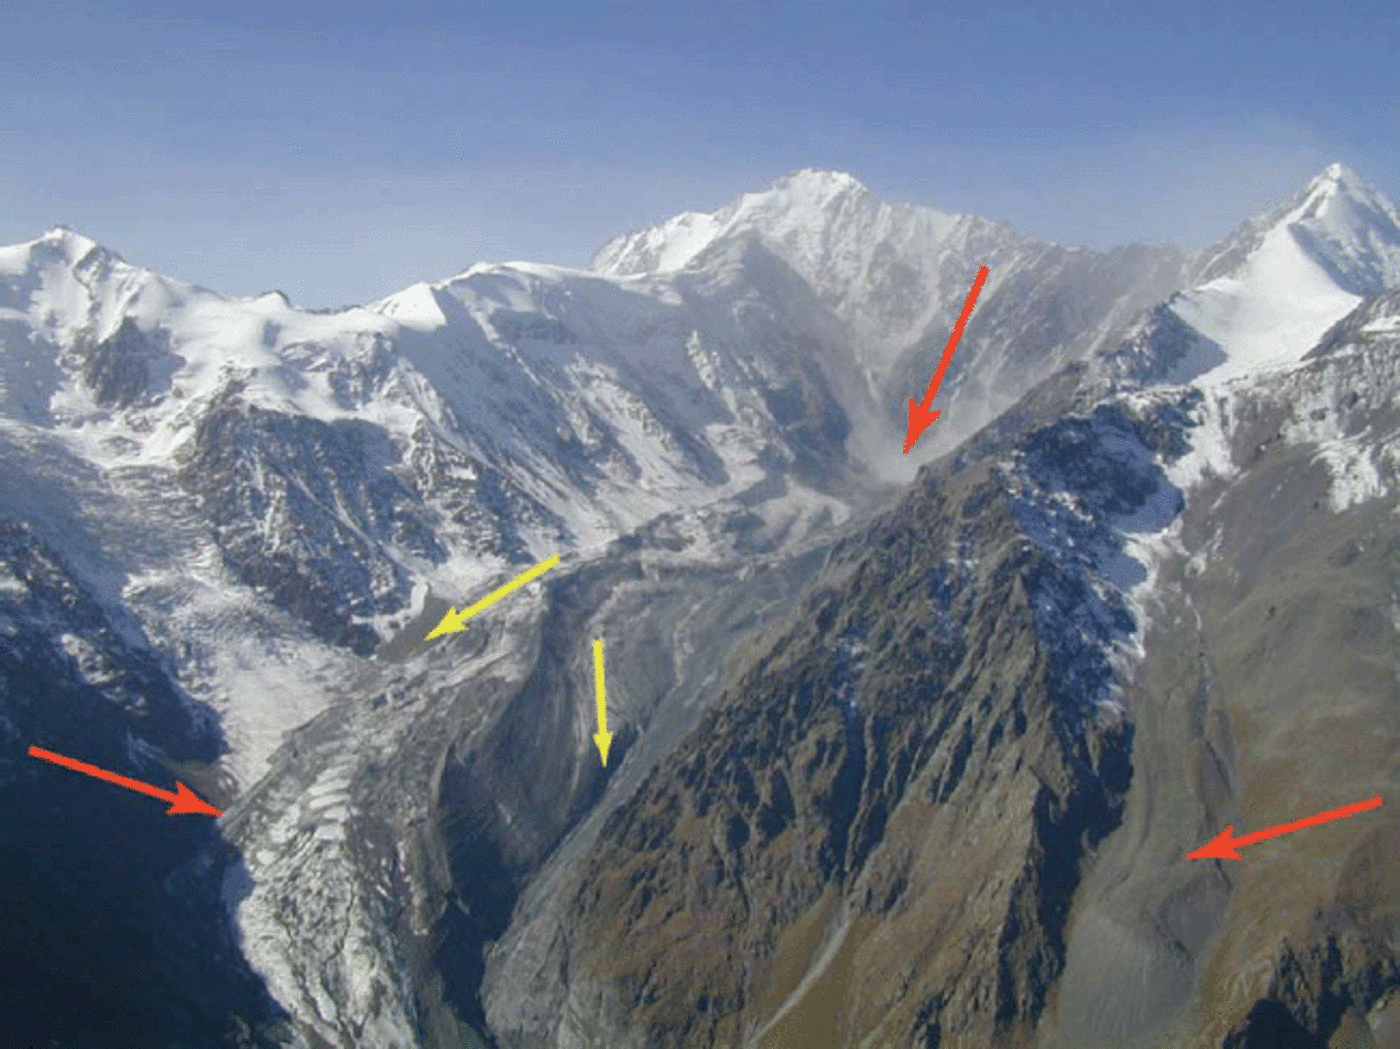
Fig. 10. Upper avalanche path of the Kolka-Karmadon rock/ice slide. The summit of Dzhimarai-Khokh and the detachment zone are in the background; Kazbek volcano is to the left (outside the image). Red arrows point to active talus-derived rock glacier in the lower right corner, steam (?) or dust (?) cloud at the foot of the slope where Kolka glacier has been sheared off and overridden the tongue of Maili glacier. Flow directions of two different and subsequent flow phases are indicated with yellow arrows. Photo: I. Galushkin, 25 September 2002.
During the years before the event, the slope had been covered by a number of well-developed, spectacular hanging glaciers. Such firn/ice bodies are known to have a complex distribution of englacial temperatures. Vertical, impermeable cliffs, where ablation takes place through ice breaking off, can be as cold as the surrounding bedrock. However, on the less steeply inclined upper surface where snow accumulation takes place, permeable firn layers underneath are strongly warmed by latent heat from percolating and refreezing meltwater. In areas with MAAT exceeding -10 to -12°C, firn is usually temperate (Reference Hooke, Gould and BrzozowskiHooke and others, 1983) and the ice/bedrock interface behind the cold cliff remains at phase equilibrium temperature, a pattern that introduces deep-seated thermal anomalies within the underlying bedrock (Reference Haeberli, Wegmann and MühllHaeberli and others, 1997). Based on work reported by A.B. Bazhev and B.Ya. Bazheva in 1964, Reference Kotlyakov and KrenkeKotlyakov and Krenke (1979) indeed indicate a critical level of 3700-3800 m a.s.l. for firn areas in the Caucasus to be cold, with mean annual firn temperature reaching -8°C at high altitudes of the Kazbek massif. It is therefore highly probable that the detachment zone at Dzhimarai-Khokh was in a complex condition of relatively cold and thick permafrost combined with warm if not unfrozen parts and meltwater flow in very steeply inclined materials with heterogeneous permeability. This situation, favouring high and strongly variable water pressures, was further complicated by the fact that hot springs occur in this volcanic region of Kazbek (the name Karmadon, or ‘warm water’, relates to hot springs in the valley). Steam/dust (?) clouds, visible in photographs and satellite images at the foot of the slope for days after the event, contained sulphur, as evidenced by the strong odour mentioned by a reconnaissance team which tried to access the site by helicopter. It was assumed that the sulphur gas originated from the slide initiation zone and may relate to geothermal activity. This interpretation, however, remains controversial, as continued rock/icefalls or deposited and remobilized dust at the main impact site could also produce the dusty clouds visible on photographs and satellite images. Later visits by authors of this paper (C.H. and A.K.) showed no trace of enhanced snowmelting from hot springs in the area of impact or in the wall of Dzhimarai-Khokh. Evidence from field observations at the site on the potential existence of hot springs and gas liberation therefore remains uncertain.
Flow path
The most extraordinary aspects of the Kolka slide event are the erosion of large parts of Kolka glacier, the high velocity attained and the long travel distance.
According to photographic documents and visitor reports, steep rock sections and hanging glaciers in the eastern part of the 20 September starting zone had already failed during the period July-September 2002. A total volume of 4-7 × 10⁶m3 of freshly deposited ice and rock debris had accumulated on Kolka glacier, causing its thickness to increase by some 10% and forming a ramp-type geometry at the transition from the mountain wall to the glacier surface (cf. Reference Petrakov, Tutubalina and ChernomoretsPetrakov and others, 2004). Shortly before the main event, lakes were observed in the affected glacier area, and repeated debris flows reaching some distance down-valley indicated special hydraulic conditions with probable high en-/subglacial water pressures. Even though signs of accelerated glacier movement (such as heavy crevassing or fast front advance) were not reported, extraordinary conditions (asymmetric additional load at the foot of Dzhimarai-Khokh causing a redirection of flow towards the left glacier margin away from the unstable wall, and decoupling of the glacier from its probably soaked sediment bed under conditions of extreme water pressure) are likely to have existed shortly before and during the critical time. The rock/icefall of 20 September 2002 had a drop height of 900-1000 m before impacting Kolka glacier which slopes away from the bottom of the Dzhimarai-Khokh north-northeast wall overa length of 3 km at an inclination of about 5-10°. The impact event resulted in erosion and complete deplacement of (a roughly estimated) 60-75% (~80 × 106m3) of the mass of Kolka glacier to 40-60m depth (data provided by Reference Petrakov, Tutubalina and ChernomoretsPetrakov and others (2004) from comparison with earlier photographs). Thus, the glacier was detached along a line parallel to the foot of the Dzhimarai-Khokh wall, leaving a pronounced scar (Fig. 10), and pushed (upwards) towards its left lateral moraine and in the down-valley direction (Fig. 11).
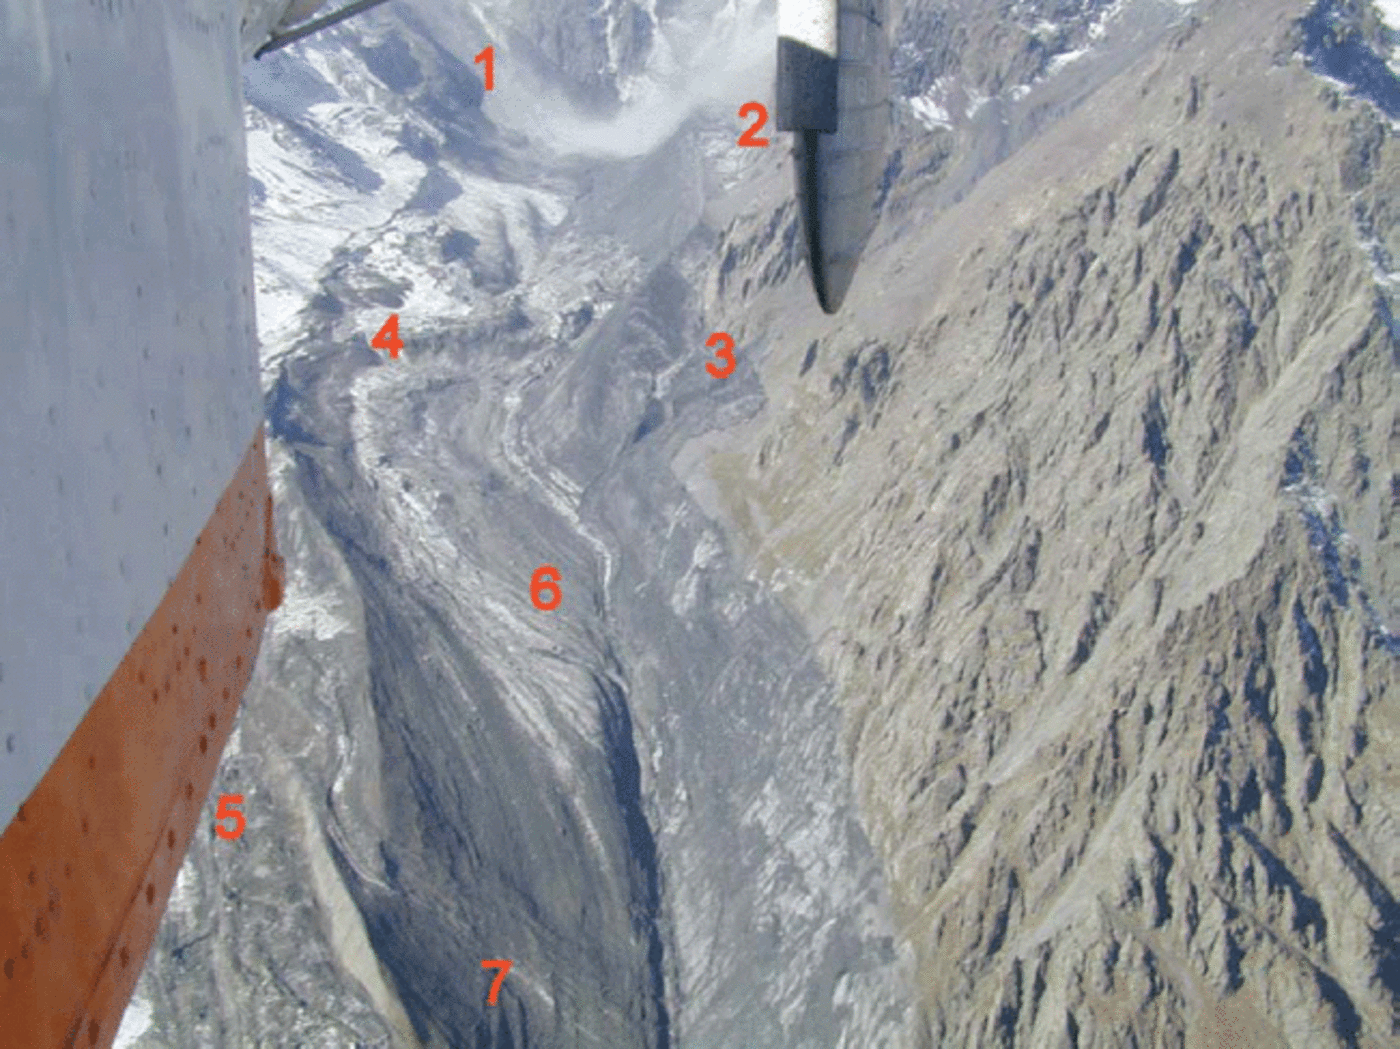
Fig. 11. Impact zone where Kolka glacier was eroded. Numbers refer to important parts of the triggering mechanism (cf. text): 1. main impact from wall; 2. ice debris thrown across left lateral moraine; 3. first (minor) splash of mud at lower end of left lateral moraine; 4. start of swinglike flow of the main mass due to deflection at left- then right-lateral moraine of Kolka glacier; 5. second (large) splash of mud forming fast mud/debris flow outside the right lateral moraine of Kolka glacier and across the tongue of Maili glacier; 6. slightly slower flow of main mass along inside of right lateral moraine; 7. temporarily blocked distal parts of fast mud/debris flow (5), crossing gap between right lateral moraine of Kolka glacier and left lateral moraine of Maili glacier and flowing across traces of main mass after its passage. Photo: I. Galushkin, 25 September 2002.
Details of the processes involved with the mobilization of large masses of Kolka glacier remain open to speculation, especially concerning the exact volume of rock and ice falling from the mountain onto the glacier to trigger its elimination. Reasonable scenarios can be constructed. The enormous acceleration (from less than metres per day to tens of metres per second) of the activated glacier/debris mass over a very short distance (a few kilometres or roughly one glacier length;see below) requires a large impact and effective energy transmission from the mass falling onto the glacier. This large impact on the glacier may have resulted in a shock wave that may then have acted as a trigger for erosion and formation of the main slide. The accumulation in ramp-type form of large amounts of ice and debris from earlier failure of hanging glaciers and rock masses may have reduced the impact angle on the glacier, of the rock/ice mass which had been falling and sliding down from the upper part of the Dzhimarai-Khokh wall. In fact, this falling/sliding mass could have hit the glacier almost tangentially, and with very high velocity. In addition, the glacier was relatively thin, on a soaked bed, already largely decoupled, and had an irregular, debris-covered and lake-affected surface. The low-angle impact from the wall (1 in Fig. 11) could be indicated by the relatively small but clear signal in the seismogram (Fig. 14 below) and may have had a sequence of effects: the impact probably shattered the glacier and pushed it towards the left lateral moraine. Some ice debris was thereby thrown over, and deposited behind, the moraine ridge (2 in Fig. 11). The moraine itself deflected the flow direction of the main avalanche and eroded glacier mass, at an angle of roughly 30° towards the main valley, squeezing out a first (minor) splash across the lower part of the left lateral moraine (3 in Fig. 11), of muddy supra- and subglacial water together with water from ice melting through direct impact (probably ρ × 106m3; cf. C. Huggel and others, in GRNO-A, 2004. The main deflected mass then crossed the glacier forefield towards the right lateral moraine (4 in Fig. 11) where it was deflected towards the valley again, squeezing out a second (much larger) splash of water with mobilized ice and rock debris. This large second splash formed a high-speed debris flow which started travelling behind the right lateral moraine (in Fig. 5) and overrode the tongue of Maili glacier (at 2800 m a.s.l.) at very high speed but without strongly eroding its relatively clean ice (Fig. 10). The main, and probably less liquid, mass followed at slightly lower speed along the inside of the right lateral moraine (6 in Fig. 11) towards the left valley slope again. After passing the gap between the right lateral moraine of Kolka glacier and the left lateral moraine of Maili glacier, temporarily dammed distal parts of the debris flow on the external moraine side started flowing across the track of the main mass (7 in Fig. 11), clearly indicating that the two main flow phases were intimately coupled.
The catastrophic acceleration and complete detachment of an almost entire glacier by the impact from an ice/rock avalanche is extremely unusual. Well-known historical cases of ice/rock avalanches onto relatively small mountain glaciers had no comparable effects. In the case of Huascaran, Peru, in 1970 (Reference LliboutryLliboutry, 1975; Reference Plafker, Ericksen and VoightPlafker and Ericksen, 1978; Reference KörnerKörner, 1983), a much larger rock/icefall (than at Dzhimarai-Khokh) impacted onto a relatively clean, steep mountain glacier but did not detach it. In a similar way, a rock/icefall from the Fletschhorn in 1901 (Reference CoazCoaz, 1910; Reference AleanAlean, 1984), with volumes comparable to the Dzhimarai-Khokh case, impacted onto the debris-covered Rossboden glacier on its elevated sediment bed in the Swiss Alps without destabilizing or eroding it. During the 1974 surge of Didal glacier, Central Asia, an ice avalanche with a volume of about 1.5 × 10⁶m3 formed at the glacier front but left the remaining part of the glacier intact and without interruption of the surge movement (personal communication from A. Yablokow to J. Schneider, Vienna, 2004). Neither high impact energy, high water pressure and surge- type accelerated sliding, debris cover/sediment bed nor thin ice on steep slopes appears to be a critical individual factor for the detachment of an entire glacier. It must therefore be assumed that a combination of critical factors is required to lead to the preconditions enabling extraordinary developments such as have taken place at Kolka glacier.
Below Kolka and Maili glaciers, the two phases of the slide encountered a bend in the valley of nearly 90° to the north. This sharp turn in flow direction caused a superelevation of the first (more liquid) flow phase, of about 200 m with a maximum of 250 m (Fig. 12;Kaab and others, 2003b). Corresponding velocity calculations (Reference ChowChow, 1959; Reference Evans and ClagueEvans and Clague, 2001) based on v = (gdr/b)0.5, where v is flow velocity, g is gravitational acceleration, d is superelevation, r is centre-line radius of curvature and b is channel width, yield a maximum of 70-90 m s-1 (250325 km h-1) with r = 1500 m, b = 600 m and d = 200-250 m. At the location of the super-elevation, traces of the second flow phase (the main and less liquid mass) confirm that the second phase was moving somewhat less fast, as indicated by the lower super-elevation (see comments on possible impact processes mentioned earlier). Further down-valley, the flow depth along the north-facing Genaldon valley was 60-150 m, with repeated super-elevations of up to 200 m. Though the Genaldon valley is relatively straight, the superelevations are striking features along the flow path with upward and downward movement at an inclination of approximately 15°. The observed super-elevations (Fig. 13) imply a swing-like movement of the slide, suggesting the flow of a compact mass. The occurrence on opposite valley flanks of parallel super-elevations indicates the existence of at least two flow phases. This is confirmed by flow traces at some places where a first mass, clearly intersected at horozontal angles of several tens of degrees, was overridden by a second phase. Parallel super-elevations, however, could also be a consequence of longitudinal compression/extension of the flow. The trimlines could mostly be recognized by ice/debris deposits of the slide. Beyond the trimline, the terrain is characterized by a zone located 10-30 m upwards with deposition of debris ranging from fine-grained to 30 cm boulders. In the same zone, shrubs and small trees were skipped. These effects are likely to be assigned to the dust part of the slide containing significant amounts of ice, debris and smaller boulders. However, indications of a large dust avalanche (e.g. strong uphill throwing of trees), such as occurs sometimes with ice and snow avalanches, was not observed in any of the flow-path sections.
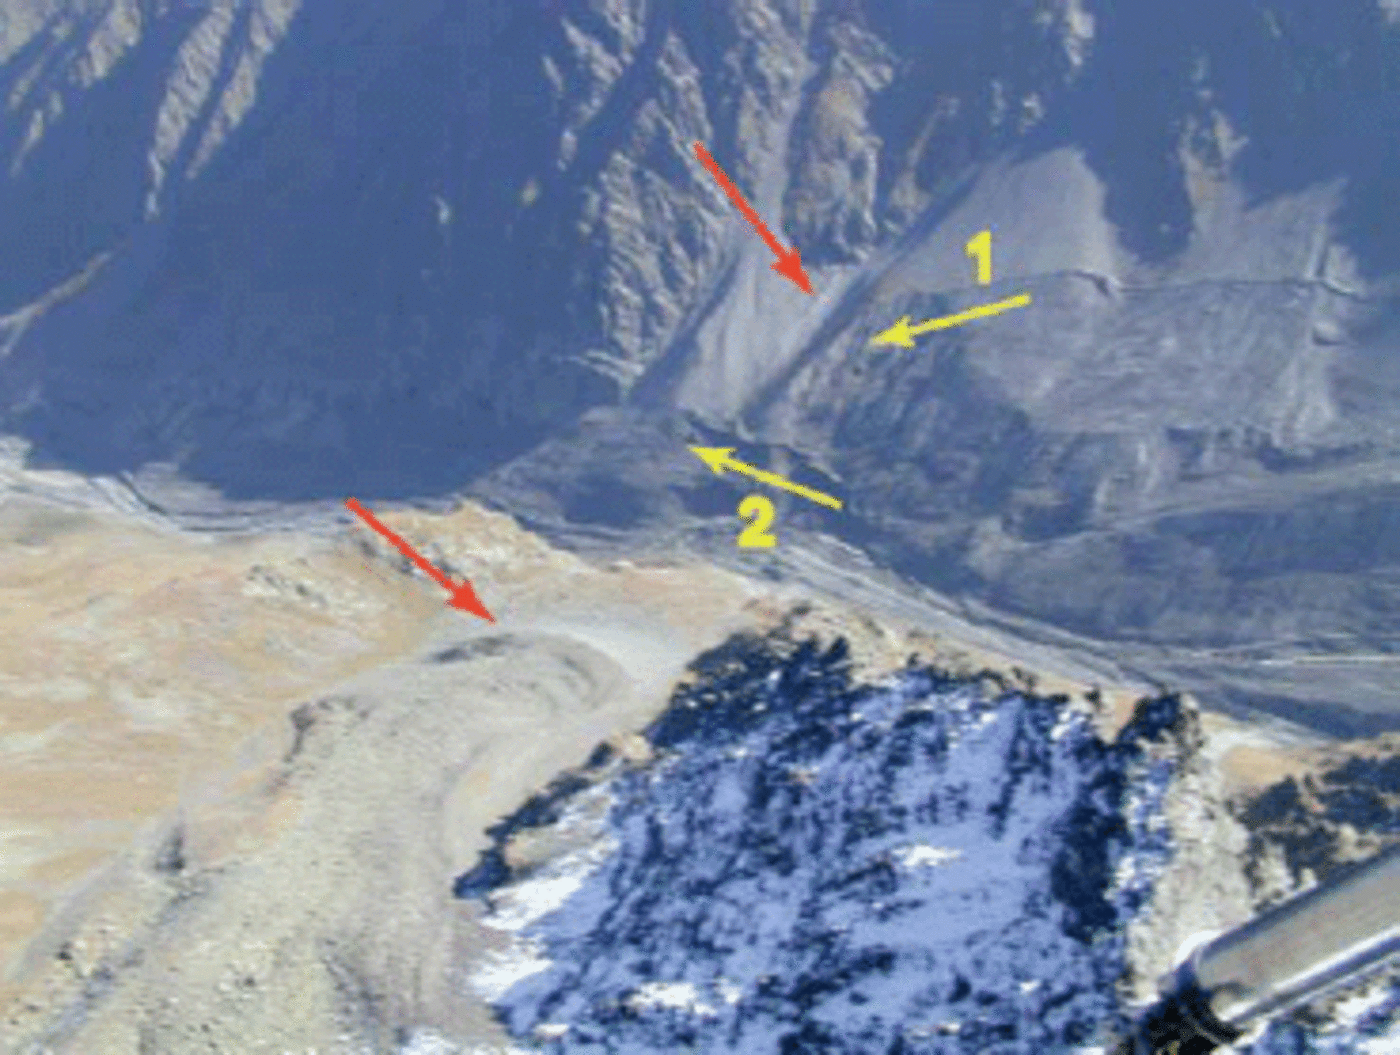
Fig. 12. Site (below Maili glacier) of the main turning to the left of the avalanche mass. Red arrows point to scree slopes and active rock glacier; yellow arrows indicate traces of two different and subsequent (1 then 2) flow phases with different super-elevation in the external part of the turn, reflecting higher (1)/lower (2) flow velocity. Photo: I. Galushkin, 25 September 2002.

Fig. 13. Waveform traces of avalanche motion along path towards Karmadon. Photo: I. Galushkin, 19 October 2002.
At the widening of the valley near Karmadon, flow depth and velocity decreased and flow spreading was observed. The main mass of the slide was eventually stopped and dammed at the entrance of the narrow Genaldon gorge. Given v =(2gh)0.5 (Reference ChowChow, 1959), with observed run-up heights, h, of 30-40m at the first and direct impact of the mass onto the slope slightly to the east of the gorge, the flow velocity is estimated at about 20-30 m s-1 (70120 km h-1). The average flow velocity of the slide was reconstructed using the seismic record events (Fig. 14) assumed to be from the impacting masses on Kolka glacier, and the breaking of the power lines at Karmadon. The resulting mean velocity of 50-80 m s-1 (180-280 km h-1) is enormous considering the moderate slope of the Genaldon valley between the Maili glacier tongue and Karmadon (~5-6°). Similarly high velocities of 50-60 ms-1 (~200 km h-1) have been reported from rock slides but on much steeper slopes (Reference Evans and ClagueEvans and Clague, 2001). Debris flows on steep volcanic flanks have reached velocities of up to 40 m s-1 (nearly 150 km h-1; Reference PiersonPierson, 1995). Possible reasons for the extreme velocity at Karmadon include lubrication effects in the mass travelling down-valley. Lubrication may have been enabled by water or air entrained at the bottom of the mass. The initial drop of the slide probably produced considerable amounts of liquid water by melting of ice caused by internal friction and impact energy (Reference Kääb, Wessels, Haeberli, Huggel, Kargel and KhalsaKääb and others, 2003b). Similar processes have been reported from other locations (e.g. Huascarán: Reference Plafker, Ericksen and VoightPlafker and Ericksen, 1978; KÖrner, 1983). During the initial fall process, air may also have been entrained and may subsequently have contributed to the high velocities.
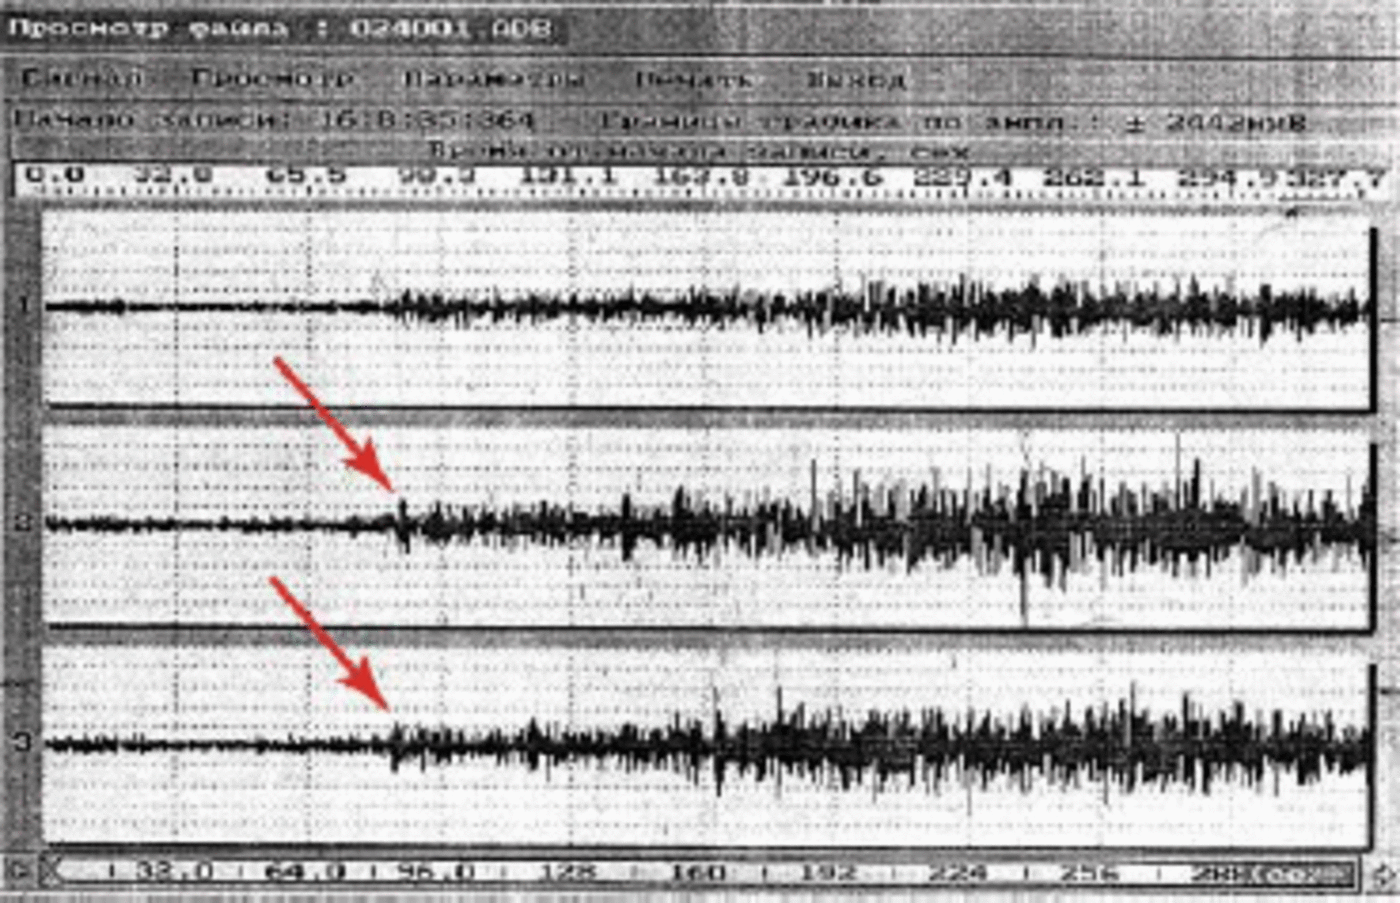
Fig. 14. Seismic record: 20 September 2002, 16:08:35, station ‘Fiagdon’, Geophysical Center for Experimental Diagnostics, Russian Academy of Sciences. Arrows point to possible signals of low-angle impact on Kolka glacier. Detailed analysis from several stations seems to be difficult and is not yet available (cf. contribution by V. Zaalishvili and N. Nevskaya in GRNO-A, 2004).
While the main ice masses were dammed at the entrance of the Genaldon gorge, water and fine sediment from the first flow phase (and/or expelled as a consequence of the extreme compression of the fast sliding ice/debris/water/air mass) caused the formation of a debris/mud-flow, which travelled down the gorge and joined the Giseldon river, eventually running out about 15 km from the gorge entrance (Fig. 15). Since the slope gradients of the flow channel are rather low (~6° in the upstream and 3° in the downstream area) the sediment concentration probably did not exceed 40% by volume. The large volume of the mud-flow (a few million m3) certainly contributed to a longer travel distance. Field observations also indicate that considerable amounts of sediment transported by the summer 2002 floods (rainfall events) were remobilized. Based on trimline evidence, the flow depth of the debris/mud-flow was estimated at 5-15 m in the upper part and 3-8 m in the lower part of the path. Flow velocity was likely to be in the range 5-10 m s-1 (15-40 km h-1). More detailed parameters for a thorough velocity calculation are not yet available. About 4 km downstream from the mud-flow runout zone, a highway bridge at the town of Gisel has a discharge capacity of 200m3 s-1 (personal communication from L. Valieva, 2003). Interestingly, there was only normal discharge observed at this bridge during the entire debris/mud-flow event. The exact reasons for the cessation of the flow (loss of water into the ground, material exhaustion, undercritical flow depth) so far remain unclear. Attempts to apply numerical model calculations concerning the dynamics of the entire flow are underway (M. Swartz and others in GRNO-A, 2004).

Fig. 15. Mud-flow below the Genaldon gorge. Note completely covered river bed, eliminated forest stands and buried access road. Photo: I. Galushkin, 25 September 2002.
Assessment and monitoring of imminent hazards
Starting zone
After the slide, an assessment of the potential for an immediate repetition of a similar or even larger event was based on the facts that (1) the disappearance of hanging glaciers with warm firn areas had reduced the load on the slope and eliminated the main meltwater source, (2) the exposed bedrock would now be subject to strong cooling and deep freezing, (3) the sheared-off ice/debris volume of Kolka glacier had made large mass increase of potential future ice/rock falls at the foot of the slope impossible and (4) the path of the 20 September event with its heavy destruction was practically inaccessible. It was concluded that the likelihood of repetition at the same site and in the immediate future of an equally sized or even larger incident could be considered minimal, but that instabilities in the remaining parts of the slope could continue and should be observed. The build-up of hanging glaciers with complex thermal conditions over long times, in combination with thermal water in the region and the specific geological setting (steeply inclined rock layers, volcanic/geothermal processes), could explain the ‘quasi-periodicity’ of events at the century time-scale. The effects of potential future atmospheric warming also need to be taken into account during the coming decades.
Dammed lakes
The ice/debris masses deposited by the slide at Karmadon began to dam river flow and led to the formation of several lakes after the slide. The largest lake developed at the settlement of Saniba at the southeast end of the ice dam. As soon as 5 days after the slide, the lake had an area of 192 000 m2 according to QuickBird satellite data. The maximum size of the lake was reached by 20 October 2002, with an estimated volume of ~4-5 × 10⁶ m3 (cf. Kaab and others, 2003b). The rising lake level flooded numerous houses at Saniba. Additionally, several lakes of variable size formed at the left (western) margin of the ice/debris dam. Based on lake area measurements using QuickBird imagery, it was estimated that 5 days after the slide a total of 56 × 106 m3 of water was dammed by the ice/debris deposits. The large amount of water dammed gave rise to serious concern for the stability of the ice/debris dam and fears of possible severe downstream flooding.

Fig. 16. Changes in lake level recorded at Gornaia Saniba. The red dashed line indicates critical rate of level change as defined for possible beginning of outburst and initiating alarm concept in down-valley settlements.
Assessing the stability of such a dam of broken ice/rock debris is complex, and the necessary experience is largely missing. Theoretically, ice dams can fail by various mechanisms such as sudden burst, overflow, dam floatation or progressive enlargement of en-/subglacial channels (Reference HaeberliHaeberli, 1983; Reference Walder and CostaWalder and Costa, 1996; Reference Tweed and RussellTweed and Russell, 1999). Expected discharges are related to the failure mechanism where sudden bursts show maximum values. A sudden burst, however, was highly unlikely at Karmadon due to the large dimensions of the ice dam (2 km along the pre-dam stream). Dam floatation was also considered unlikely because the dam consisted of (roughly estimated) 20% of debris/rock, which prevents a dam from flotation in accordance with density considerations (Reference TweedTweed, 2000). More probable scenarios were dam overflow or formation of drainage channels on, in or underneath the ice/debris deposits, including potential channel collapse with temporary damming and sudden breakage.
As there was no way to observe the ongoing processes within and under the ice/debris dam, the monitoring concept was based on control of inflow to, and outflow from, the ice/debris dam. Outflow measurements at the lower end of the dam itself were complicated due to the inaccessibility of the area in the gorge (frequent ice- and rock falls). Discharge measurements had therefore to be made some kilometres further downstream. Saniba lake, however, was under continuous observation. A constant lake level rise was measured in the period 20 September- 22 October 2002. In order to assess a sudden discharge from Saniba lake and potential downstream flooding effects, a critical threshold of the rate of lake lowering was determined. The threshold was set at 0.1 mh-1 as this would roughly double the observed discharge and most likely mark the beginning of a potentially dangerous outburst process. If the threshold was exceeded, or discharge became suddenly blocked, a series of control and safety procedures were to be activated (including the possible evacuation of inhabitants of Gisel to more elevated ground). Activation of such procedures was not necessary. A moderate drop in the level of Saniba lake began after 22 October 2002, by natural formation of drainage channels (Fig. 16). Emergency interventions at the ice/debris dam, such as channel excavation or even dam destruction by explosives, were disregarded after careful evaluation, mainly due to inefficiency in relation to the enormous dam dimensions.
Expert judgment and recommendations
The following notes were prepared and signed by W. Haeberli and I. Zotikov, representing the Swiss Humanitarian Aid Unit and the Russian Academy of Sciences, respectively (original text in italics: the term ‘orographic’ here means ‘in the direction of flow’):
1. The Kolka-Karmadon event of 20 September 2002 is clearly recognized to have been an ice/rock avalanche (characteristic range of travel speed: hundreds of km h-1) and not a glacier surge (accelerated glacier flow);
2. this ice/rock avalanche represents a unique and catastrophic event of historical dimension;
3. as such, this event was unforeseeable – exact prediction would have been difficult even with advanced expert techniques;
4. the physical conditions and processes leading to the departure of the ice mass in the steep mountain slope are, and will continue to be, difficult to assess; any human influence on the triggering can be safely excluded and the possibility of a repetition at the same site in the immediate future is considered minimal;
5. corresponding hazards of smaller dimensions, however, exist in many high-mountain areas of the world and should be considered in delineating regional hazard zones;
6. as a consequence, the Kolka-Karmadon case should be documented and the information made available to the public and the scientific community by the group of experts now active;
7. an adequate group of experts should also accompany the evolution of the situation and help the authorities with planning appropriate measures;
8. this is necessary, because the formation of lakes at and on the avalanche deposits continues to constitute a threat to local as well as down-valley settlements and their inhabitants;
9. at present – and most likely during autumn 2002 – low lake levels, decreasing discharge in the upstream rivers, an already functioning hydraulic system on the orographic left, cooling air/water temperatures and a still thick avalanche deposit make a sudden outburst of the lake dammed on the orographic right unlikely;
10. due to the fact that the situation is complex and not fully controllable, careful observation of the lake and the ice dam is of fundamental importance;
11. the present situation allows for attempts to facilitate emptying of the lake at the orographic right by constructive measures (surface channel);
12. however, the combined effects of snowmelt with increased river discharge and accelerated disintegration of the ice dam in spring/summer 2003 could create a critical situation if lake levels rise and volumes of dammed water increase;
13. for such a case, important activities have to be foreseen and prepared already during winter time, including either pumping/siphoning of water at high rates and/or planning of evacuation of the population in down-valley areas potentially affected by flood waves, which could be on the order of several hundreds to even 10002000 m3 s-1 of water and mud;
14. on a longer term, climate change may introduce pronounced changes in high-mountain conditions, especially with respect to snow, ice, water and the involved system of surface processes;
15. it would be advisable to monitor and investigate the evolution on the Ossetian part of the Caucasus with the help of international cooperation and modern technologies (remote sensing, precision surveying, numerical modeling of spatial conditions, etc.).
The work of the local authorities and environmental experts (especially aerial reconnaissance flights, mapping of the deposit, observational network, rescue actions and communications with experts) in a most unusual and delicate situation was considered to have been fully adequate and of excellent quality. Collaboration between the different parts of the action was most fruitful and hopefully will continue into the future.
In the meantime, the lake level has lowered in the expected slow mode and has fortunately stayed low during spring and summer 2003, making additional flood protection work unnecessary. The possibility of sudden collapses within the debris dam (Fig. 17) and intermittent damming of the river, with a potentially following mechanical burst and corresponding sharp flood peak (cf. Reference HaeberliHaeberli, 1983; Reference Walder and CostaWalder and Costa, 1996), makes the continuation of careful observations necessary.
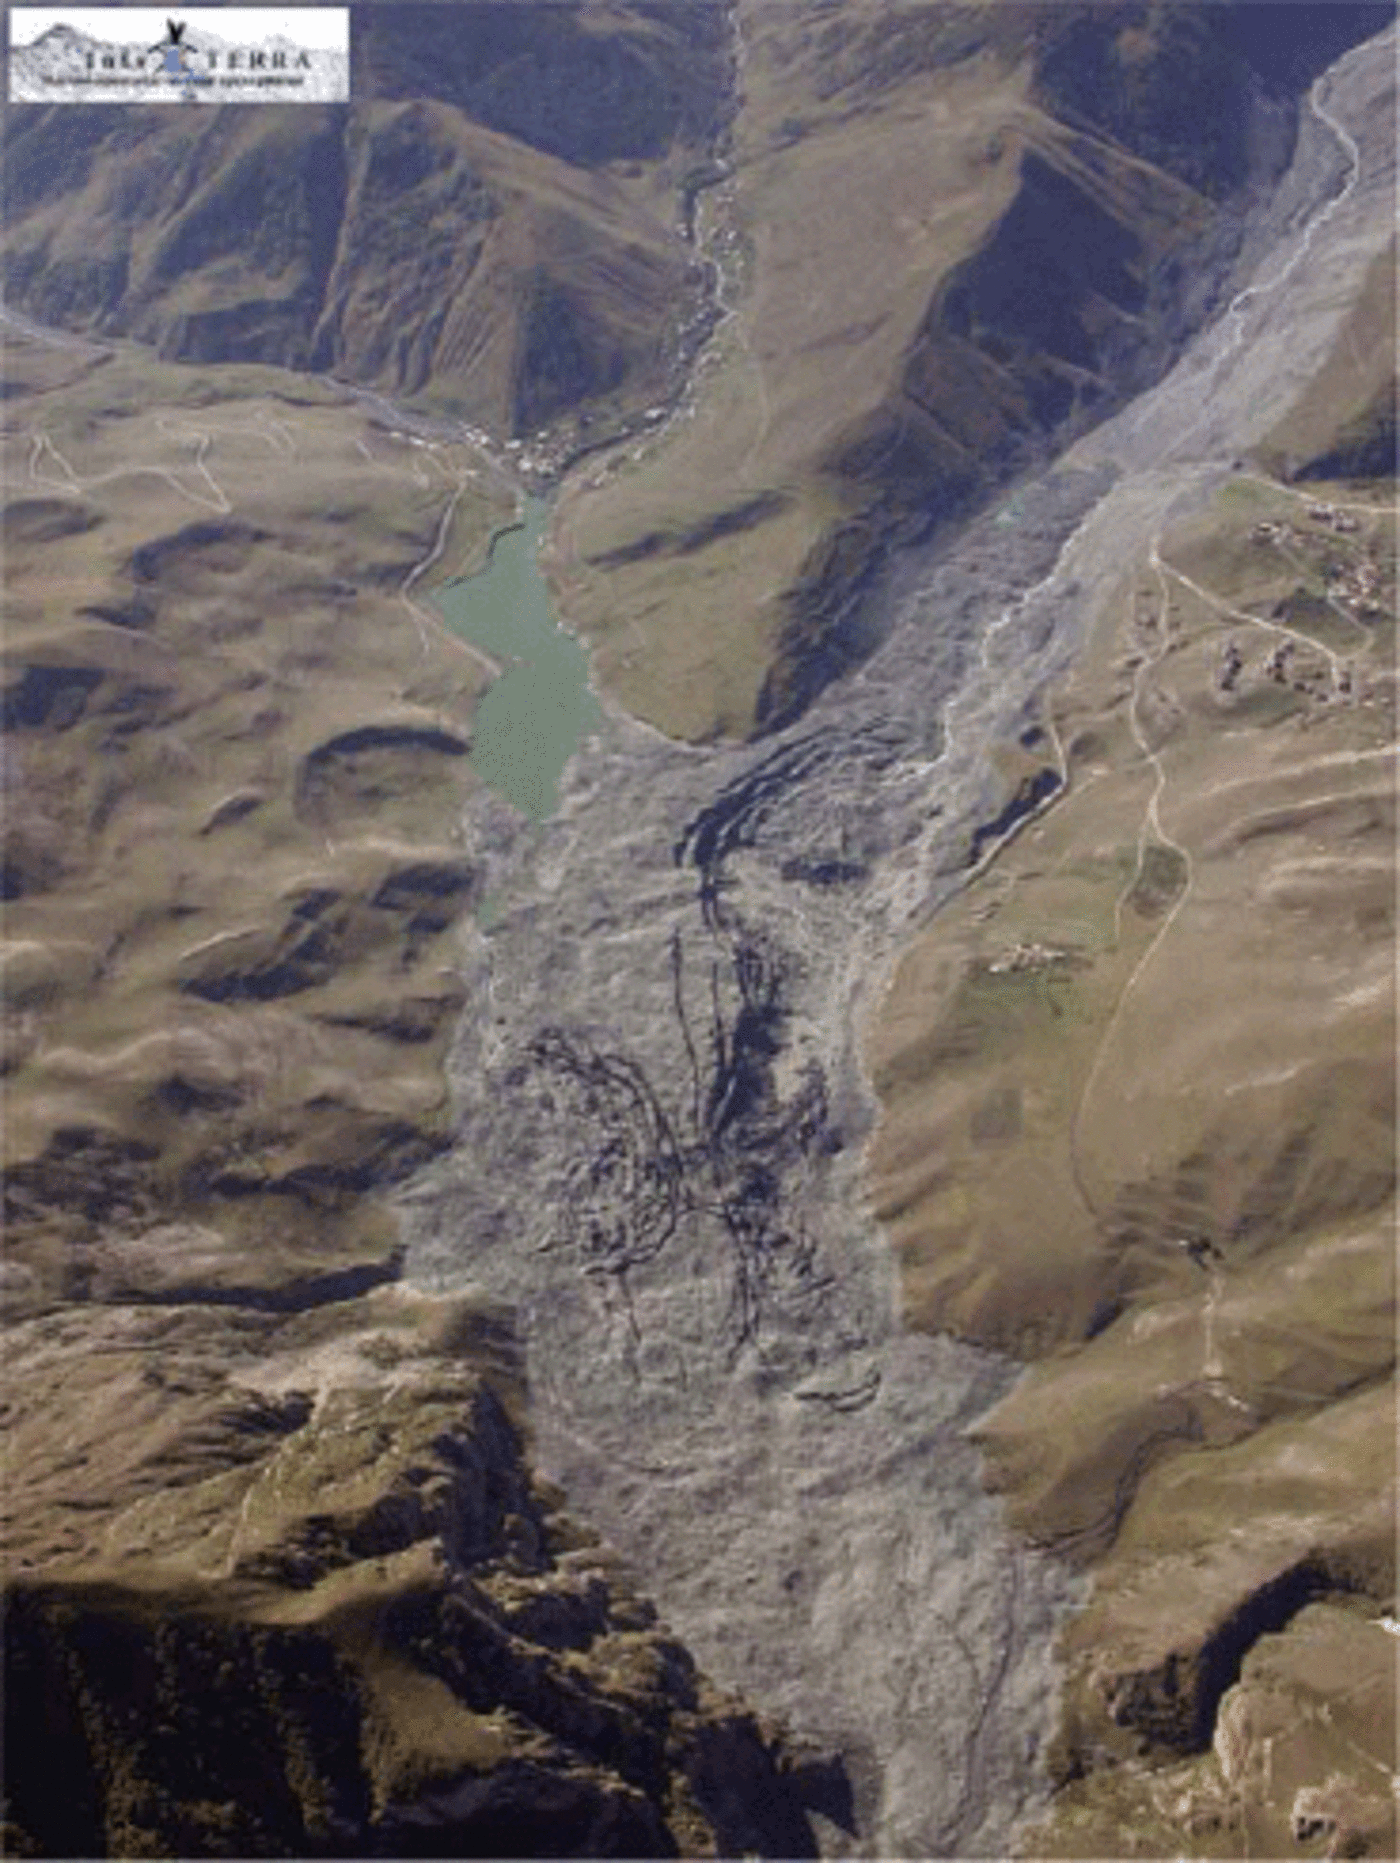
Fig. 17. Collapse structures in avalanche deposit in fall 2003. Photo: I. Galushkin, 23 September 2003.
Conclusions and lessons to learn
The most remarkable aspects related to the extraordinary case of the recent Kolka-Karmadon rock/ice slide are:
1. two similar but smaller events from the same mountain slope had already occurred in 1902, indicating especially delicate but not well-understood conditions in the starting zone, and
2. the extreme length of the slide/mud-flow trajectory is probably due to the unique entrainment of large ice volumes from a (debris-covered valley) glacier, to the resulting combination of rock, snow/firn/ice, debris and water within the sliding mass and to the correspondingly high flow velocities.
This ice/rock fall was a tragic and hardly foreseeable event of historical dimensions. In more densely populated mountain ranges, a similar event could cause a catastrophe of enormous dimensions. In view of this possibility, as much as possible should be learned from the experience and documentation made available. Lessons include the relatively trivial but most important, and nevertheless often neglected, fact that severe catastrophic events in high mountain regions typically involve a multitude of factors and require integrated consideration of complex chains of processes, a task that must be undertaken by correspondingly qualified groups of interdisciplinary experts (Reference Kääb, Reynolds and HaeberliKääb and others, in press). Special attention must be paid to (a) interactions of permafrost, hanging glaciers and bedrock structure in steep high-altitude slopes, (b) the potential erosion and mobilization of entire glaciers as a consequence of high-energy impacts from falling rock/ice masses onto glaciers, with still-to-be-defined critical combinations of factors such as high water pressure, additional surface load by debris and water, decoupling from soaked sediment beds and irregular surface topography/ice thickness of down- wasting debris-covered glaciers, and (c) the transformation of rock/icefalls into debris flows, powder (snow) avalanches and debris/mud-flows traveling at high speeds over large distances. This integrated consideration of such complex interrelations now forms the basis for a cooperative project involving the responsible authorities, and international collaboration of scientists has been initiated (cf. contributions by S.A. Baskaev and others, C. Huggel and others and S. Oswald and others in GRNO-A, 2004).
Acknowledgements
Important contributions to this work were made by P. Lourié of the Department of Hydrometeorology and Monitoring of the Environment in the Northern Caucasus, V. Panov and U. Ilichev of the Hydrometeorological and Research and Development Center of the Northern Caucasus, V. Popovnin, D. Petrakov and O. Tutubalina of the Department of Geology at Moscow State University, S. Chernomorets of the University Center of Engineering Geodynamics and Monitoring, M. Bagov of the Mountain Institute of Geophysics of the Hydrometeocenter of Russia, Nalchik, and K. Nosov and E. Zaporozhchenko of the Institute of Project and Research ‘Sevkavgiprovodkhoz’. A. Glazovsky (Russian Academy of Sciences, Moscow) provided eyewitness reports from mountaineers, and K. Schmutz (Geography Department of the University of Zurich) developed the ASTER DEM. Collaboration with the Government of North Ossetia and the Russian Academy of Sciences is part of a project directed and funded by the Swiss Development Corporation (Expert Group on Disaster Prevention within the Swiss Organization for Humanitarian Help). Due to heavy war actions in the neighbouring Republic of Inguschetia during the night of 21-22 June, non-Russian participants were not allowed by UN-Security to attend the International Vladikavkaz Conference in June 2004, but remained in close contact with the conference and held a parallel workshop in the Swiss Embassy at Moscow: corresponding comments and feedbacks by M. Chiarle (Italy), S. Evans (Canada), J. Hanisch (Germany), J. Schneider (Austria), S. Chernomorets, A. Strom and O. Tutubalina (Russia) helped clarify several aspects of the event and its interpretation. Constructive comments by two anonymous reviewers also helped improve the quality of the manuscript.
The present contribution is devoted to the memory of the people killed by the catastrophe, their relatives and friends.


