


1. Introduction
At an ice–liquid interface, the dependence of melting temperature on normal stress drives ice regelation (e.g. Bottomley, Reference Bottomley1872; Telford and Turner, Reference Telford and Turner1963; Nye, Reference Nye1967; Drake and Shreve, Reference Drake and Shreve1973; Gilpin, Reference Gilpin1979; Rempel and Meyer, Reference Rempel and Meyer2019). Regelation facilitates glacier sliding by causing ice to melt on the upstream sides of small bumps, where elevated normal stresses lower the melting temperature, and subsequently refreeze on their downstream sides, where reduced normal stresses increase the melting temperature. Larger bed obstacles are surmounted more easily by ice deformation, and the combination of processes is parameterized in well-known sliding laws (e.g. Weertman, Reference Weertman1957; Nye, Reference Nye1969; Kamb, Reference Kamb1970). An important complication develops when sliding transports ice more rapidly than deformation enables it to conform to the shapes of rough beds. In these locations, cavities develop and fill with pressurized meltwater (e.g. Lliboutry, Reference Lliboutry1968; Schoof, Reference Schoof2005; Fowler, Reference Fowler2010). Links between cavities enable water flow, making them important for subglacial drainage (e.g. Kamb, Reference Kamb1987; Flowers, Reference Flowers2015). Cavity formation is also associated with heterogeneity in the normal stress exerted on the basal ice interface, since the liquid pressure is typically lower than the ice overburden pressure (e.g. Iken and Bindschadler, Reference Iken and Bindschadler1986) and higher stresses elsewhere must support the remaining glacier weight. Such elevated stresses can be generated by a combination of elevated liquid pressures and intermolecular interactions between mineral (i.e. rock or till) and ice surfaces across microscopic premelted liquid films (Dash and others, Reference Dash, Rempel and Wettlaufer2006; Rempel, Reference Rempel2008; Rempel and Meyer, Reference Rempel and Meyer2019). Whereas conventional regelation sliding, described first by Weertman (Reference Weertman1957), relies on the steady conductive heat transfer that accompanies melting temperature contrasts as ice slides across bedrock bumps, our attention is drawn to consider transient phase change processes promoted by conductive heat transfer between the basal interface and overlying ice.
Here, we explore the consequences of changes in melting temperature that are caused by stress heterogeneities along the basal interface. We focus on the freezing that is induced as ice slides from regions of elevated normal stress, supported in part by ice–mineral interactions, onto regions of reduced normal stress balanced solely by the liquid pressure. Such transitions are expected as slip transports ice over macroscopic drainage elements (e.g. cavities), and as macroscopic drainage elements incised upwards into the ice (e.g. R-channels) are dragged across newly unloaded mineral exposures. We find that a simple model for ice–liquid exchange in a sliding regime predicts freeze-on thicknesses that are consistent with diverse basal observations. Where this freeze-on occurs in the presence of unconsolidated or suspended sediments, debris bands in basal ice can form. We suggest that mm-scale diffuse and sometimes laminated debris bands that are preserved in basal ice layers (e.g. Sugden and others, Reference Sugden1987; Knight, Reference Knight1997; Hubbard and others, Reference Hubbard, Cook and Coulson2009) may represent the signatures of the freeze-on processes that we describe. This is noteworthy because the properties of basal ice, including the presence and concentration of entrained debris, can influence sliding behavior and erosion (e.g. Thompson and others, Reference Thompson, Iverson and Zoet2020).
2. Basal phase behavior: bulk melting and premelting
For pure water, the equilibrium temperature at an ice–liquid interface is determined to leading order by the pressure in the liquid P and the normal stress exerted on the solid ice surface σn; under typical glaciological conditions, the other components of the ice stress tensor at the interface contribute negligibly. The thermodynamic arguments leading to this result are given by a number of sources (e.g. Kamb, Reference Kamb1961; Paterson, Reference Paterson1973; Sekerka and Cahn, Reference Sekerka and Cahn2004). The offset of the equilibrium temperature T eq from a constant reference temperature T 0 can be written as (c.f. Rempel, Reference Rempel2008, Eq. 1)

where P 0 is the constant reference pressure (defined so that T eq = T 0 when P = σn = P 0), ρ l and ρ i are the densities of liquid water and ice, and the magnitude of the Clapeyron slope is
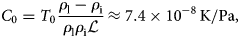
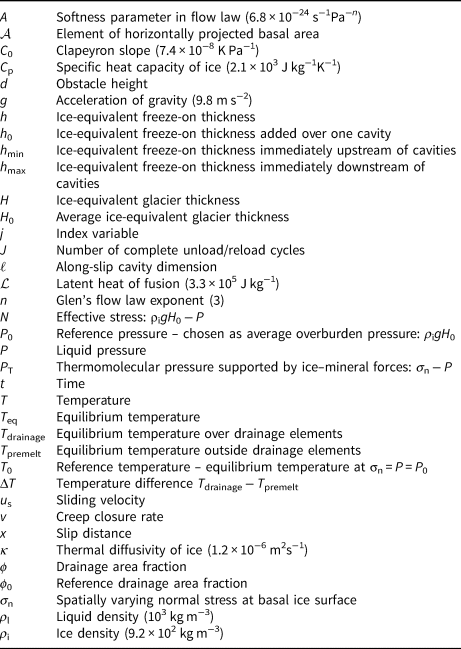
where ${\cal L}$ is the latent heat of fusion (a list of symbols is given in Table 1). An expanded discussion of equilibrium melting conditions is provided in the Supplementary Information.
Table 1. List of symbols, in alphabetical order, with Greek letters below (value of physical constant in parentheses).
Along an interface between ice and a macroscopic drainage element like a cavity or channel, the normal stress in the ice balances the liquid pressure (i.e. σn = P, see Fig. 1). Hence, along the ice-walled surfaces of macroscopic drainage elements, the final term in Eqn (1) vanishes and variations in the melting temperature are directly proportional to variations in liquid pressure, decreasing by approximately 7.4 mK for each atmosphere (~ 105 Pa) increase in P. More generally, the intermolecular forces that cause premelted liquid films to separate ice from mineral surfaces (i.e. bedrock or unconsolidated sediments) produce a difference between the normal stress σn and the liquid pressure P that is referred to as the thermomolecular, or disjoining, pressure (e.g. Dash, Reference Dash1989; Dash and others, Reference Dash, Rempel and Wettlaufer2006; Wettlaufer and Worster, Reference Wettlaufer and Worster2006). A significant literature has developed to describe the molecular scale mechanisms that facilitate stress transfer between solid surfaces across intervening premelted films (e.g. Dash and others, Reference Dash, Rempel and Wettlaufer2006; Israelachvili, Reference Israelachvili2011), but for our purposes it suffices to note that all of these mechanisms produce the same essential result. When homogenized over an area element of the (generally rough) glacier bed, the thermomolecular pressure, defined here as P T = σn − P, is the component of ice normal stress supported by intermolecular interactions with mineral surfaces (discussed further in the Supplementary Information). As expressed by Eqn (1), changes in T eq with P T at constant P are an order of magnitude larger (i.e. ρ l/(ρ l − ρ i) ≈ 12) than changes in T eq with changes in P of the same size during which P T is held constant (i.e. along a path with σn = P; discussed further in the Supplementary Information).

Fig. 1. Schematic of a representative cavity, with uniform liquid temperature T drainage = T premelt + ΔT, connected to premelted films that separate the bounding rock/till interface from the overlying glacier ice. Representative temperature profiles are shown (left to right): (i) at the upstream side of the cavity prior to unloading (constant at T premelt), (ii) midway over the cavity with a conductive profile promoting freeze-on (decaying from T drainage to T premelt far above the bed), and (iii) at the downstream side of the cavity after the interface temperature has returned to T premelt and melting has commenced (note the dissipating thermal wave above the bed). Note that the melt rate at (iii) is lower than the freezing rate at (ii), promoting net freeze-on as ice flows across the schematic. Lower schematics show the force balance in the premelted film (left; P T > 0) and in the cavity (right; P T = 0).
Consider the idealized case of a glacier with ice-equivalent thickness H sliding over a heterogeneous bed that contains macroscopic drainage elements with P T = 0 (Fig. 1). For basal areas ${\cal A}$ over which the glacier weight can be regarded as locally supported (i.e. shear stresses on the boundaries of ${\cal A}$
 are assumed to contribute negligibly), the vertical force balance requires
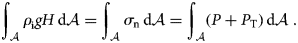
(As discussed further in the Supplementary Information, the basal surface itself is generally expected to be rough, and measurements of its physical area hence depend on the scale at which its topography is resolved; in the integral expressions used here for evaluating the vertical force balance, the area element ${\rm d}{\cal A}$ is rigorously defined as the horizontal projection of the contorted basal surface, making it independent of the scale of observation.) We assume that: (i) liquid wets the entire basal interface (consistent with our focus on sliding glaciers), (ii) spatial variations in liquid pressure are small (i.e. the bed is ‘well-drained’), (iii) macroscopic drainage elements occupy fractional bed area ϕ < 1, and (iv) the thermomolecular pressure is uniform over the remainder of the bed where ice–mineral separation diminishes enough that intermolecular forces between them are significant (what we refer to as premelted films throughout). For an average ice-equivalent thickness H 0, under these idealized conditions Eqn (3) simplifies to (see the Supplementary Information)
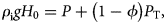
which indicates that, for basal areas ${\cal A}$ over which the glacier weight is locally supported, part of that weight is supported by the liquid pressure acting everywhere, and the remainder is supported by the thermomolecular pressure acting on the fraction of the bed that is not occupied by macroscopic drainage elements. Assigning the reference pressure as the average overburden P 0 = ρ igH 0, Eqn (1) implies that the equilibrium melting temperature over the macroscopic drainage elements is

where the effective stress is defined as N = ρ igH 0 − P. Over the remainder of the bed, where stress transfer takes place between the ice and mineral surfaces (i.e. the ice–mineral separation is reduced to the microscopic dimensions of premelted liquid films), the equilibrium temperature is

Hence, the difference between the equilibrium ice–liquid temperature over a drainage element and that over premelted regions is

When ϕ is vanishingly small, ΔT increases by approximately 90 mK (i.e. 7.4 mK × 12) for each atmosphere (~ 105 Pa) increase in the effective pressure N, or nearly 1 °C MPa−1.
3. Basal mass exchange
3.1. Freeze-on over a single cavity
Having established that appreciable differences in equilibrium temperature can be expected across the borders of drainage elements, we next examine the effects of these differences on basal mass exchange. For a simple illustration, we consider a scenario in which ice slides over its bed at constant effective stress N and constant velocity u s (see Fig. 1). Treating the heat flow as perpendicular to the bed, with thermal diffusivity κ, and assuming that phase changes are sufficiently slow that their effects on thermal conditions can be neglected (i.e. bed-perpendicular advective heat transport is negligible), energy conservation is governed by the one-dimensional heat equation with an interface temperature that changes abruptly by ΔT as the boundary of a drainage element is crossed at time t = 0. The resulting perturbation to the temperature gradient along the sliding interface can be approximated as (e.g. Carslaw and Jaeger, Reference Carslaw and Jaeger1959, §2.5; discussed further in the Supplementary Information)

where the adopted sign convention signals that the heat flow upwards, away from the bed, increases when the equilibrium temperature across the drainage element boundary rises by ΔT. Noting that dx = u sdt and integrating over a sliding distance $\ell = u_{s} t $ , the implied perturbation to conductive heat transport equates with the latent heat of fusion for a layer of ice-equivalent thickness

where C p is the specific heat capacity, and we note that the ratio of h 0 to a characteristic cavity size $ \ell $ is inversely proportional to the product of the Stefan number $S_{\rm T} = {\cal L}/( C_{\rm p} \Delta T)$
 with the square root of a Peclet number $ P_{\rm e} = u_{\rm s} \ell / \kappa $
 . The energy needed to accommodate this phase change is dissipated by conduction into the overlying ice, which retains the thermal signature of having recently been adjacent to colder premelted basal regions.
Equation (9) indicates that for a given cavity size ℓ, the thickness h 0 is greater if the sliding speed is lower because there is more time for conductive heat transport. Freeze-on layer thickness is also greater if the effective stress is higher, which promotes elevated ΔT through Eqn (7). For intuition, at typical glacial sliding velocities u s ranging between 10 and 103 m a−1, with ΔT between 0.1 and 1 °C (N between 105 and 106 Pa), the freeze-on layer grows to achieve ice-equivalent thicknesses between h 0 ≈ 0.1 mm (large u s, small ΔT and N) and h 0 ≈ 10 mm (small u s, large ΔT and N) during the time taken to traverse a cavity of dimension ℓ = 1 m. However, we note that the characteristic sizes ℓ of drainage elements need not be fixed, often increasing with sliding speed and decreasing with effective stress. A simple, illustrative model for cavity size that displays this qualitative behavior can be constructed using Glen's flow law with softness A ≈ 6.8 × 10⁻²⁴ s−1Pa −n (Cuffey and Paterson, Reference Cuffey and Paterson2010) to estimate a characteristic creep rate (e.g. Creyts and Schoof, Reference Creyts and Schoof2009)

so that the distance slipped during creep closure of a cavity in the lee side of an obstacle of height d is

Substituting this and the undercooling expression from Eqn (7) into Eqn (9), while adopting a flow exponent of n = 3, gives (nominal values of physical constants are provided in Table 1)

which is a relatively weak function of the primary variables that characterize the basal environment near the cavity, namely: N, d, and u s. For example, with ϕ ≪ 1, N = 105 Pa and d = 0.1 m, h 0 ≈ 2 mm when u s = 10 m a−1, and this thickness drops only slightly to h 0 ≈ 0.6 mm when u s = 103 m a−1 (with N = 105 Pa and d = 0.1 m) and increases slightly to h 0 ≈ 6 mm when N = 106 Pa and d = 1 m (with u s = 10 m a−1). We emphasize that these values of h 0 should be regarded as order of magnitude estimates rather than precise predictions, particularly given the approximate treatment of the characteristic creep rate v in Eqn (10) and ℓ in Eqn (11).
3.2. Downstream melting
Downstream of the cavity, some of the recently frozen-on water will melt. Upon reloading the basal interface on the opposite boundary of the drainage element, the temperature gradient is perturbed once again. Assuming a symmetrical unloading/reloading cycle so that the interface temperature drops abruptly by ΔT and thereafter remains fixed for x > ℓ (see Fig. 1), the perturbation to the temperature gradient in the ice becomes (see Supplementary Information)

which induces gradual melting so that the net ice-equivalent freeze-on thickness evolves according to

where the approximation on the right is valid for distances x ≫ ℓ. Importantly, even though the changes in interface temperature for this simple scenario are symmetrical – first increasing by ΔT at x = 0, then decreasing by ΔT at x = ℓ – the freezing and melting rates are not symmetrical. For example, the freeze-on thickness remains at $h = ( \sqrt {2}-1) h_0\approx 0.4h_0$ after sliding to x = 2ℓ – a distance equivalent to the drainage element dimension beyond its downstream boundary. This asymmetry in phase change behavior arises because conductive transport ensures that the attenuated history of past temperature perturbations continues to exert an influence on the changes in heat flux imparted by each new jump in interface temperature – essentially, the thermal pulse produced by unloading continues to modify the heat transport even after reloading returns the interface temperature to the background level T premelt. Our treatment assumes an initial steady-state profile that reaches T premelt at the basal interface (consistent with cases in which most of the bed is mantled by films so that ϕ is small), and subsequent perturbations to the temperature field forced by brief episodes with slightly warmer boundary temperatures result in net freeze-on as ice flows across and beyond drainage elements. It is worth noting that the supercooling described here is associated with motion of a cold sliding interface into contact with comparatively warmer water rather than the motion of comparatively colder water into contact with a warmer interface, as occurs during glaciohydraulic supercooling (e.g. Alley and others, Reference Alley, Lawson, Evenson, Strasser and Larson1998).
3.3. Idealized cavity sequences
A natural extension to this idealized treatment can be made by considering slip over cavities of dimension ℓ that are uniformly spaced by ℓ/ϕ, leading to a predicted freeze-on thickness immediately prior to the J + 1st unloading of

where the second approximation is valid for J ≫ 1, or equivalently x ≫ ℓ/ϕ. The next freeze-on episode enables the total thickness to reach

Figure 2 shows the evolution of minimum (dashed) and maximum (solid) freeze-on thicknesses predicted by Eqns (15) and (16) respectively, as a function of the sliding distance scaled to correspond with the number of complete unloading/reloading cycles. Net freeze-on increases gradually with the number of cycles and it also increases with the proportion of the bed occupied by macroscopic drainage elements ϕ. For example, with N = 1 MPa and ℓ = 1 m, the total freeze-on thickness reaches approximately 10 cm after a sliding distance of 10 km when ϕ = 0.1 and u s ≈ 10 m a−1 so that h 0 ≈ 1 cm. Irrespective of cavity dimension ℓ, Eqn (15) indicates that h min is approximately proportional to the product Nϕ and the square root of the total sliding duration x/u s, so two orders of magnitude more time would be required to grow h min to 1 m, and one order of magnitude lower Nϕ would reduce h min to 1 cm. However, the same dynamic considerations that can cause ℓ to vary with basal conditions also make ϕ sensitive to N and u s. For example, estimating the characteristic cavity size using Eqn (11) while treating the obstacle spacing as fixed suggests that the drainage fraction varies in the vicinity of some reference level ϕ 0 according to

where N 0 and u s0 are the reference effective stress and sliding velocity for which ϕ = ϕ 0. Substituting this into Eqn (15) while taking n = 3 and assuming ϕ ≪ 1 leads to the functional behavior

where the numerical factor on the right is valid when the reference drainage fraction ϕ ref = ϕ 0 is defined using N 0 = 105 Pa and u s0 = 10 m a−1. The value of h min predicted by Eqn (18) is notably independent of sliding speed u s since related potential changes in the time available for freeze-on over drainage elements are negated by increases in the drainage element fraction, according to the simple treatment leading to Eqn (17). Moreover, this particular model for the controls on drainage fraction implies that, despite the weak direct dependence of h 0 on effective stress in Eqn (12), h min actually decreases gradually with increased N since the nonlinearity in creep closure rate, described with Glen's flow law exponent n = 3, causes changes in N to affect ϕ more strongly than their linear influence on ΔT.
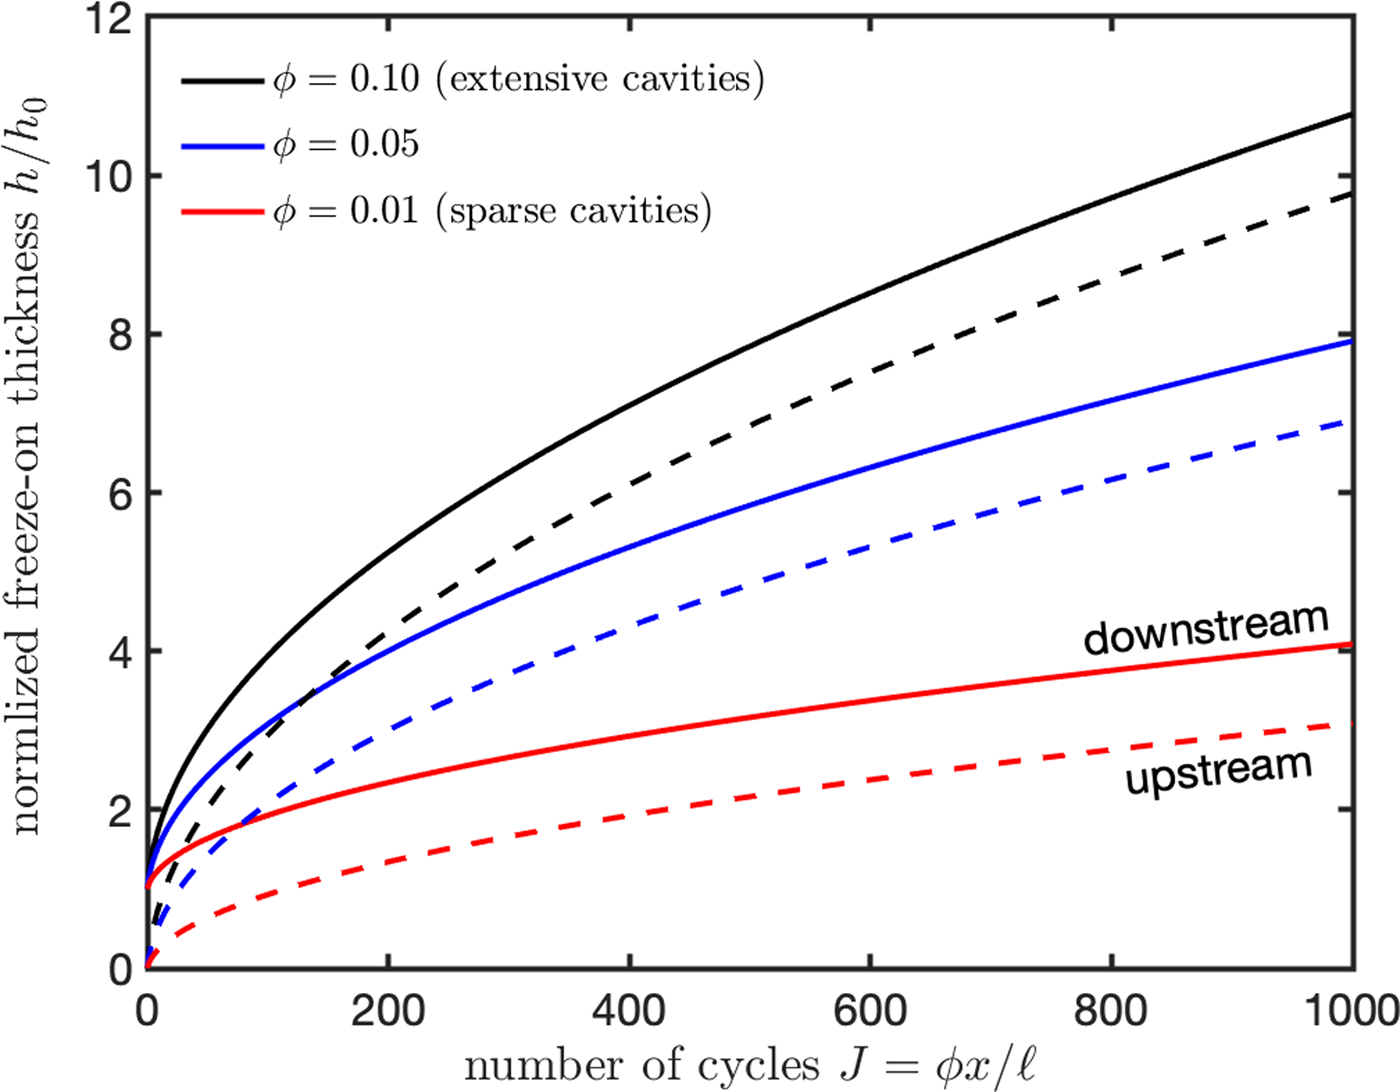
Fig. 2. Evolution of predicted freeze-on thickness with sliding over an evenly spaced sequence of identical cavities. Sliding distance is scaled by the cavity spacing ϕ −1ℓ, with the values of ϕ noted in the legend. For a bed that contains more extensive cavities (high ϕ), there is proportionately less time for melt-out so h is larger for the same number of unload/reload cycles. Here, h is scaled by the characteristic dimension h 0 from Eqn (9). Dashed lines depict h min/h 0, corresponding to predicted thicknesses on the upstream sides of cavities, while solid lines depict thicknesses h max/h 0 on the downstream sides of cavities. At other locations, h is expected to fall between these limits.
4. Discussion and conclusions
The simple cases we consider here, with P and P T in Eqn (4) both constant, represent a considerable idealization. In reality, both of these fields are likely to be heterogeneous, as are the temperature variations ΔT that drive freeze-on and melt-out during each unloading/reloading cycle. Commonly observed temporal variations in basal effective stress further complicate the balance of freezing and melting at the bed (e.g. Iken and Bindschadler, Reference Iken and Bindschadler1986; Huss and others, Reference Huss, Bauder, Werder, Funk and Hock2007; Meierbachtol and others, Reference Meierbachtol, Harper and Humphrey2013; Andrews and others, Reference Andrews2014; Rada and Schoof, Reference Rada and Schoof2018). All of these factors have the potential to leave their imprint on the basal ice and debris record. However, the relatively small variations that we predict for h 0 and h min in comparison with the much larger proportionate changes that we consider in characteristic basal parameters such as N and u s, suggest that the dominant features of basal exchange may nevertheless be captured adequately by our idealized treatment. Extensions to consider more complicated and realistic scenarios with P and P T both functions of time and space are not expected to introduce any significant conceptual hurdles.
In situations where unloading occurs, liquid water at T drainage is invariably exposed to a supercooled surface, initially at T premelt < T drainage. Solidification in a dendritic growth habit may occur – whether downwards from the sliding glacial ice of a cavity roof (hinted at by reports of ‘regelation spicules’ and other similar features seen in cavities beneath relatively shallow ice, e.g. Kamb and LaChapelle, Reference Kamb and LaChapelle1964; LaChapelle, Reference LaChapelle1968; Vivian and Bocquet, Reference Vivian and Bocquet1973; Theakstone, Reference Theakstone1979; Rea and Whalley, Reference Rea and Whalley1994, see Fig. 3A), or upwards as anchor ice growing on the mineral surfaces of a cold channel floor. The liquid water that flows through macroscopic drainage elements is expected to often contain suspended debris and indeed is sometimes observed to be quite turbid (e.g. Rada and Schoof, Reference Rada and Schoof2018). These freezing styles may enhance the potential to incorporate mineral debris into the basal ice, particularly if mechanical disruption upon reloading (e.g. encapsulation in compacted dendritic layers or upwards particle displacement driven by debris–bed contact forces) acts to limit the efficiency of debris removal with small amounts of melt.

Fig. 3. Photos from the subglacial environment. (a) Dendritic ice crystal recovered in 1967 from the wall of a drained subglacial cavity in marginal ice beneath Blue Glacier, WA (reprinted with permission from LaChapelle, Reference LaChapelle1968). (b) Laminated facies photographed by KLR in 2014 beneath interior regions of Larsbreen glacier in Svalbard, accessed through the englacial drainage network and approximately 2.2 km from the glacier terminus.
The approximate perturbation to the temperature gradient described by Eqn (8) does not include the effects of background heat flow (discussed briefly in the Supplementary Information), and neither have we accounted for bed-normal deformation (e.g. Sugden and others, Reference Sugden1987; Knight, Reference Knight1997). Thicker basal ice sequences may develop if the average rate of conductive transport away from the basal interface is greater than the combined effects of geothermal heating and frictional work so that net freeze-on (i.e. congelation) takes place. In such circumstances, the basal mass exchange caused by the unloading/reloading cycles described here are expected to add and then subtract from the total evolving thickness of basal ice layers. Other factors worthy of consideration include: (i) the enhanced thermal conductivity of most common bed materials in comparison with liquid water (tending to focus geothermal heating away from drainage elements and toward premelted regions), (ii) the absence of frictional work along the stress-free ice boundaries of macroscopic drainage elements (tending to favor slightly larger net freeze-on locally), (iii) advective transport of heat with moving meltwater (potentially counteracting or even overwhelming the reduced heat input associated with an absence of frictional work), (iv) longitudinal stress gradients that are often compressive in marginal regions (causing basal layers to thicken), and (v) the potential for intergranular phase changes in temperate ice to reduce conductive heat transport (discussed further in the Supplementary Information). Without accounting for such complications, the simplest scenario to consider is one in which the background rate of freeze-on is constant over the entire glacier bed. To this is added the supercooling-induced freeze-on upon basal unloading and interaction with potentially turbid cavity waters, followed by subsequent melt-out upon re-establishment of ice–mineral stress transmission, as outlined above. Different rates and characters of debris entrainment are expected to accompany slow freezing at the equilibrium melting temperature from premelted films of water over mineral surfaces in comparison with that entrained during more rapid freezing along a supercooled and potentially dendritic interface with macroscopic drainage elements. The effects of subtle differences in freezing environment beneath different portions of the glacial bed are difficult to quantify (e.g. drainage system turbidity, bedrock debris cover and particle size distribution, background freeze-on rate, spatially and temporally varying effective stress), though some effects may be amenable to laboratory investigation. These differences may be preserved as distinct mm-scale layering involving diffuse debris concentrations of a similar nature to those termed ‘clotted ice’, ‘dispersed facies’ or ‘laminated facies’, in reports of basal ice layers (e.g. Sugden and others, Reference Sugden1987; Knight, Reference Knight1997; Hubbard and others, Reference Hubbard, Cook and Coulson2009). Further efforts to develop and test quantitative models that can reproduce specific features of observed basal debris distributions in particular settings hold promise for providing a window on the basal conditions sampled during flow.
The mechanism of debris entrainment introduced here is notably distinct from the ice-lensing phenomena that may sometimes accompany the growth of ‘frozen fringes’ with much higher (i.e. $> 50\percnt$ by volume) debris concentrations beneath soft-bedded glaciers (e.g. Rempel, Reference Rempel2008; Christoffersen and Tulaczyk, Reference Christoffersen and Tulaczyk2003; Meyer and others, Reference Meyer, Downey and Rempel2018, Reference Meyer, Robel and Rempel2019), or any of the other most commonly recognized debris entrainment mechanisms (e.g. Alley and other, Reference Alley1997). As noted previously (e.g. Rempel, Reference Rempel2011), the thicknesses of sediment-rich entrained layers produced by frozen-fringe modeling depends on lensing criteria that can be related to a characteristic temperature offset, and for the low heat fluxes that are typical of subglacial environments this makes it very difficult to use that mechanism to explain mm-scale layering, such as that illustrated in Figure 3B. Particularly intriguing observations of entrained basal debris deep in the interior of Kamb Ice Stream are captured in borehole video accessible through Engelhardt (Reference Engelhardt2013, https://nsidc.org/data/nsidc-0528/versions/1/documentation). In principal, entrainment by glaciohydraulic supercooling can result in diffuse debris contents and fine-scale layering, but this mechanism is normally invoked to describe behavior on adverse bed slopes (e.g. Alley and others, Reference Alley, Lawson, Evenson, Strasser and Larson1998), making it difficult to reconcile with the ubiquity of debris observations. While noting that several other potential mechanisms have been proposed and likely dominate in some environments, we suggest that remnants of the basal mass exchange processes introduced here may often be preserved as dispersed and laminated facies within basal ice layers.
Supplementary materials
The supplementary material for this article can be found at https://doi.org/10.1017/jog.2021.107
Acknowledgements
We thank Lauren Andrews and Mauro Werder for sharing basal temperature records that illuminated a serious misconception held by AWR, and Gwenn Flowers for several discussions that helped propel this work forward. Revisions benefited from comments, questions, assertions and suggestions by Florent Gimbert, two anonymous reviewers, and the Scientific Editor, S. H. Faria. Financial support came from NSF-1603907 and the University of Oregon.


 Open access