


Introduction
During the past decade the multispectral remote-sensing concept has developed, and a number of recognition techniques have been successfully demonstrated using data from the visible and infrared portions of the electromagnetic spectrum (Reference NalepkaNalepka, 1970). The fact that the response of a reflecting or emitting surface is a function of the wavelength at which the measurement is made is of primary importance for such work (Reference EricksonErickson, in press). Empirical data obtained from measurements in the microwave regions of the spectrum have shown a similar wavelength dependence in the response of natural terrain types (Reference Leeman, Leeman, Earing, Vincent and LaddLeeman and others, 1971; Reference Cosgriff, Cosgriff, Peake and TaylorCosgriff and others, 1959). Factors such as the backscatter coefficient and radiometric temperature measurements have been used to advantage in some microwave remote-sensing systems Developments have also been made in recent years in imaging radar systems. The advantages of using a radar are the improved spatial resolution capabilities and the active mode (i. e. energy radiation) of the system. A four-channel microwave radar system (Reference Rawson and SmithRawson and Smith, 1974) is being operated by Environmental Research Institute of Michigan (ERIM) to demonstrate the multispectral technique. To date there have been several demonstration projects (Reference BryanBryan, 1974; Reference Drake, Drake, Shuchman, Bryan, Larson, Liskow and RendlemanDrake and others, 1974).
This paper presents a summary of recent experiments designed to obtain and classify data on fresh-water ice using the four-channel multispectral radar. A brief description of the four-channel synthetic-aperture radar (SAR), a discussion of the experiment technique, and a presentation of the results obtained are included.
Four-Channel Microwave Radar System
The ERIM four-channel microwave radar system utilizes the synthetic-aperture technique to obtain fine resolution in the along-track direction and pulse compression techniques to realize fine resolution in the cross-track direction (Reference BrownBrown, 1967). The system operates in the conventional side-looking mode. Four data channels, two at X-band (3 cm wavelength) and two at L-band (25 cm wavelength), both with like- and orthogonal-polarization reception, can be recorded simultaneously. For both wavelengths the normal operating configuration is in a 4-20 km swath width, antenna depression angles from 8°−90° and a resolution in both azimuth and range of 10 m. The radar signal received in the aircraft is recorded on film using a cathode-ray tube system. An image is obtained by dual-channel (across-track and along-track) matched-filter processing of the radar signal in an optical signal processorFootnote *. This is illustrated in the radar-system block diagram presented in Figure 1. The ERIM fourchannel system is carried in a G-46 aircraft which is also equipped with infrared scanning and photographic equipment.
Utilization of Radar Imagery
One of the prime requirements for proper utilization and interpretation of remotely sensed data, that is the conversion of raw data into useful and usable information is the collection of accurate ground-truth data. The direct relationship between what is visually seen (but not necessarily perceived) and that collected by panchromatic photography is obvious. A major difficulty is the change in perspective of the two views (ground truth and remote sensing). Our eyes observe one aspect of the scene (i.e. the visible), and the remote sensor detects another (e.g. heal). Small and portable instruments (e.g. thermal radiometers or thermometers) are available to aid us in the collection of these thermal data at selected sites.
At even longer wavelengths, the problems of relating the visible scene and that sensed by the remote sensor becomes increasingly difficult. Thus, at the radar wavelengths of concern in this paper (3 and 25 cm), the relationship is not at all obvious. In addition, because persons attempting to interpret radar imagery and those providing the ground-truth information are often from entirely different backgrounds and training, it is of pressing importance that we proceed to quantify both the ground truth and the remotely sensed data (i. e. there is a need for a calibrated imaging SLAR). Only after such quantification will we be able successfully to store, retrieve, and statistically analyze both sets of data and thus properly resolve the problem of environmental monitoring and measurement using airborne radars.
The problem is not only the quantification of the data but also the need to make simultaneous data collections. If, for example, only the size, shape, and relative location of, say, farms, mines, or highways were of interest, we could conduct the ground-truth measurements at any time within several days (or even months) of the remotely-sensed data collection Conversely, when dealing with features which are more unstable and ephemeral (e.g. lake ice) it is necessary to reduce the time lag between the two data collections drastically.
Finally, although it is often possible to remove portions of the scene from their natural locations and study them at the laboratory bench, the sample may be subjected to changes during collection, storage, and transportation. In the case of snow, time alone is sufficient to alter the physical properties (Reference Bader, Bader von, Haefeli, Bucher, Neher, Eckel, Thams and NiggliBader and others, 1939). Thus the nature of the study subject, together with the remote-sensing system, determine the ground-truth procedure which should be used in support of the remote-sensing operation. The organization and implementation of the ground-truth portion of a complete remote-sensing study are discussed in several recent papers (Reference WilsonWilson, 1968; Reference Benson, Benson, Draeger and PettingerBenson and others, 1971).

Fig. 1. Block diagram of the ERIM four-channel microwave radar system.
Numerous papers concerning the interpretation of radar imagery and the nature of radar backscatter from the ground are available (e.g. Reference InnesInnes, 1968; Reference MooreMoore, 1969). There is no need to reiterate these at length. However, it is instructive simply to present the radar equation (Reference BerkowitzBerkowitz, 1966) to illustrate the nature of the parameters affecting the backscatter or reflection or radar waves.

in which P s is the received power (i.e. backscatter), P t the transmitted power, G the antenna gain, λ the wavelength of the emitted electromagnetic wave, σ the echoing (scattering) cross- section, and R the range.
Several of these parameters (P t, G, λ) are functions of the radar instrument design and operation. Range is concerned with the relative location of the scene to the radar antenna. The scattering cross-section σ, a function of the nature of the target, is determined by;
-
a. the roughness of the surface relative to the operating wavelength;
-
b. the electrical properties of the material in the scene; and
-
c. the roughness of any sub-surface layers prior to which the attenuation is insignificant.
Many studies have been conducted in which both theoretical and empirical measurements of the scattering cross-section are considered (e.g. Reference Cosgriff, Cosgriff, Peake and TaylorCosgriff and others, 1959). However there have been few attempts to relate measurements of the surface electrical properties (specifically the dielectric constant) to the radar images.
The response of a “rough surface” to radiation of various wavelengths is illustrated in Figure 2 The radar provides a measure of the distribution of reflectivity (backscatter) in the area being imaged. It is noted that the roughness of a surface is a function of the incident wavelength. At a short wavelength, 3 cm for example (X-band), a rough surface provides a significant amount of backscattered energy. However, the same surface at a longer wavelength say 25 cm (L-band), looks smooth, and therefore less backscattered energy is presented to the receiving radar antenna. Thus, a smooth surface in the (χ, y) direction is defined such that the change in elevation (i.e. roughness), ∆Z λ; for a rough surface ∆Z >λ. Clearly, such a surface would look different in the imagery at the two wavelengths. In addition, the depolarized energy is a function of the surface electrical properties as well as roughness.
Use of Multi-Spectral Radar to Image Ice
The Environmental Research Institute of Michigan (ERIM) together with the National Aeronautics and Space Administration (NASA) Lewis Center, Cleveland, conducted a field experiment during the winter of 1973–74. This experiment was oriented toward determining the information available in the data obtained from the ERIM four-channel synthetic aperture radar system. The study areas for this experiment were Whitefìsh Bay, Lake Superior, and the Straits of Mackinac, Michigan (Fig. 3).
Ice-coring equipment, in addition to two portable instruments designed and fabricated specifically for this purpose by ERIM laboratory personnel, were used. These latter instruments measured (a) the complex dielectric constant of ice (or snow) at 100 MHz and (b) the electrical properties of the ice at the two operating wavelengths of the radar system (3 cm and 25 cm) (Reference Bryan, Larson and ShahrokhiBryan and Larson, 1973).
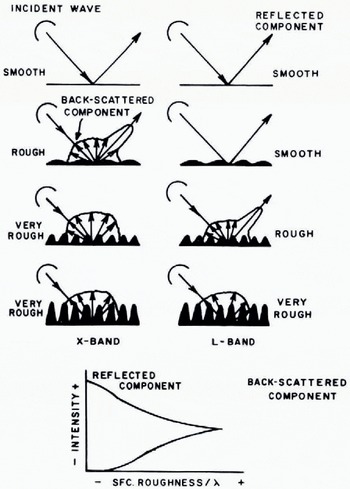
Fig. 2. Response of rough surfaces to radiation of two wavelengths.

Fig. 3. Study area for radar interpretation of fresh-water ice.
Data Analysis
Examples of the four-channel radar imagery from one imaging pass are given in Figure 4. This three-mile (5 km) strip extends from Île Parisienne, Ontario, Canada south to and including Nodoway Point, Michigan, U.S.A. The wavelength, resolution and polarization of each image are as indicated.
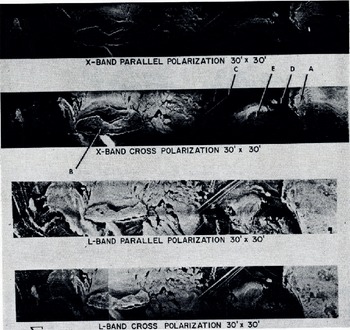
Fig. 4. Simultaneously obtained dual-frequency radar imagery of fresh-water ice in Whitefish Bay, Michigan, 13 March 1974.
Several interpretations are easily made:
-
(1) Area “A”, land mass of the upper peninsula of Michigan and shoreline of Whitefish Bay.
-
(2) Area “B”, Île Parisienne.
-
(3) Various ice types in Whitefish Bay, smooth ice being shown by low reflectivity (dark tone on the image).
-
(4) Area “C”, ships' tracks, where ships have gone through the ice.
-
(5) Area “D”, pressure ridge.
At first glance, for area “C”, the interpretation would be that the passage of the ship has disrupted the ice, forming an area of brash and highly broken ice which, upon refreezing has developed a geometry not unlike that of a pressure ridge. (By comparison, a pressure ridge is clearly seen at point “D” in Figure 4). However, the transit of the ship had the opposite effect when passing through a rougher (brighter) area. In this case, the ship apparently smoothed the surface by breaking of the brash ice blocks into smaller pieces. These then floated lower in the water and refroze as a lower, flatter (smooth) surface. This does not, of course, give an absolute measure of the surface roughness of the ice, but rather indicates the effect of the ship's passage. Given some additional information concerning the time of the ship's passage and the nature of the ship (speed, size, etc.), one could conceivably accurately estimate the relative surface smoothness of the ice. The question which remains unanswered is why the two portions of the ship's track have such different backscattering properties relative to one another.
The simplified interpretation of roughness (as given in Figure 2) is not always the case for imagery similar to that in Figure 4. For example, in Area “E”, midway between Nodoway Point and Île Parisienne, this figure is not applicable. The problem is encountered in that the X-band (HH) image has a darker tone (and, therefore, a smoother surface?) than docs the L-band (HH) image of the same area. Reference to Figure 2 indicates that this is not possible if only the surface roughness is considered as the reflecting medium. Clearly then, the basic interpretation with respect to the surface roughness is, at least in some areas, in error. Alternatively, some additional items are being detected and are contributing to the microwave reflectivity and therefore to the image lone. Such items include the energy polarization, look angle and depression angle of the radar, and the nature of the surface material, among others.
This concept is not new and has often been discussed in the radar literature (see, for example, Reference Cosgriff, Cosgriff, Peake and TaylorCosgriff and others, 1960; Reference Moore and LomaxMoore, 1971). However, with respect to fresh-water lake ice, a situation not often encountered in the natural environment, and seldom studied with imaging radars, is experienced. Simply, the situation is such that a high degree of penetration of the microwave signals below the uppermost surface is possible, and reflections are received from additional lower surfaces within or below the ice sheet.
Electrical Measurements
It has been implied that observable back-scattering of the radar energy is received from the ice/water interface. Dielectric constant measurements indicate that penetration of the ice layer is possible at both X-band and L-band wavelengths. Also, the two-way loss in the ice is not too excessive at L-band so that energy backscatter from the ice/water interface should also be received by the system antenna. However, adequate empirical data to substantiate these conclusions and to determine the reflection coefficients from the ice/water interface are not presently available.
Estimates of the ratio of the back-scattered energy from the air/ice interface (P i) and that from the ice/water interface (P w) have been calculated. The reflection coefficients are approximated by assuming equal roughness factors for the two boundaries. Then, normalized by the surface roughness factor, the air/ice reflection coefficient is approximately — 10 dB. Using published values (Reference CummingsCummings, 1952) for the dielectric properties of water, the ice/water reflection coefficient is approximately —3 to —5 dB.
Reflection coefficients at the ice/air and ice/water interfaces can be measured directly or calculated using measured values of dielectric properties. The latter are preferred due to the difficulty in calculating the interface roughness. However, lacking such empirical data, and using (a) the calculated reflection coefficients for these interfaces, (b) the loss tangent (tan δ) for the ice, (c) a radar depression angle of 20°, and (d) X-band and L-band wavelength values, the calculations show that Pw ≈ P i for 40–50 cm of ice for λ = 3.0 cm (X-band) and 3–4 m of ice for λ = 25.0 cm (L-band). Using the calculated results obtained from the two wavelengths, it can be assumed that the back-scattered energy is coming primarily from the ice/water interface for ice thicknesses less than the calculated values.
In this example, it has been assumed that both air/ice and ice/water interfaces have equal back-scattering factors. Clearly, in many situations this is not the case, and corrections to account for differences in the boundary roughness would be required. This obviously points out the need for additional and meticulous ground-truth efforts to obtain a more complete understanding of the data available in the radar imagery.

Fig. 5. Physical properties of ice cores from Whitefish Bay, Michigan, 13 March 1974.
The data concerning relative dielectric permittivity ε', ice thickness, and loss tangent tan δ for five locations in the study area are given in Figure 5. These data were collected using a 7.62 cm (3 inch) diameter SIPRE corer. Dielectric measurements were taken at a frequency of 100 MHz (Reference Bryan, Larson and ShahrokhiBryan and Larson, 1973). For the wavelengths used in the radar system, the relative dielectric permittivity was calculated to be ε' = 3.0 or slightly higher than that measured at 100 MHz.
These data confirm the comments previously found in the literature and summarized in Figure 6. Specifically, there is every possibility that there was considerable penetration into the lake ice by the microwave energy from the imaging radar and therefore the effects observed in the imagery, that is the brightness of the image tone, are not necessarily a direct function of the roughness of the air/ice interface.

Fig. 6. Summary of microwave interaction with ice. (After Reference Grant and GrantGrant and others, 1973, p. 47.)
Image Interpretation
Figure 7, an enlargement of the southern portion of Figure 4, illustrates an area which was the subject of much of the ground truth. Area 1 is an area of black ice with small (generally less than 1 m) pieces of brash ice imbedded in the black-ice matrix. The ice/air boundary is slightly rough at both wavelengths.

Fig. 7. SLAR imagery of Whitefish Bay, Michigan.
Some energy is returned from the X(HH) and L(HH) signals in this area, but clearly it is considerably less than that from the brash ice in Area 2. It is possible that both the ice/air and ice/water interfaces are (slightly) rough at both the X-band and L-band wavelengths; consequently, there is little return from multiple scattering and depolarization from the surface or from volume scattering within the ice sheet itself. (The majority of the pattern seen in Area I on the X(HH) image (Fig. 7) is the result of coherent speckle, a property of the optical processing technique used on this imagery).
Strong signal returns were observed from Area 2 in all four images. This area is one of rough brash ice, and, in this case, multiple scattering, probably primarily from the surface and the interior of the ice, caused a high intensity of both polarized and depolarized signal returns.
In Area 3, a moderate signal return is seen only on the two L-band images. This entire area was composed of a smooth brash ice surface (quite similar to that in Area 1) and the bright (essentially point) returns are probably from large specular reflectors at the ice/water interface.
Items labeled 4 are ice-foot formations which extend to heights of 3-4 m. These features are clearly seen as very bright reflectors on all images. They are, however, brighter on the X-band images than on the L-band images, but this is probably a result of the (photographic) darkroom techniques used in preparing the imagery rather than an indication of the differential reflectivity of the formations at the two wavelengths. In reality, should it be possible to calibrate the radar system to obtain quantitatively comparable results for the four images, it is doubtful if this wide variation in brightness would be substantiated. One small area of ice foot, extending to the east of Iroquois Island, is clearly visible on both of the X-band images, but on neither of the L-band images. This ice foot is very poorly developed and is only about 1.5 m in height.
Pressure ridges are easily identified in Figure 7 (marked 5). One extending north-northeast from Iroquois Island is observed on all images. This strong return is apparently the result of multiple reflections within the ridge itself. For the ridge extending to the east from the same island it is only faintly visible on the X(HV) imagery and not at all on the X(HH). Ground observations indicate that this latter ridge should have been as readily visible as the others in the imaged areas. It is therefore considered that this lack of a strong radar return is the result of the radar aspect angle rather than the roughness, internal structure, or size of the ice ridge. This emphasizes one of the items of major importance in radar backscatter- that of the angle of the imaged surface relative to the direction of propagation of the microwave energy (cf. Fig. 2).
All areas labeled 6 (both 6a and 6b) in Figure 7 give very low to moderate returns at both wavelengths and polarizations. The interpretation is that both surfaces (ice/air and ice/water interfaces) are smooth and act as specular reflectors directing the radar energy away from the receiving antenna. This has been verified with ground-truth information.
For areas annotated 7, (Fig. 7) the return at both X(HH) and L(HH) is relatively strong, especially in the latter. These areas have smooth ice/air interfaces. It is thought that part of the back-scattering of the radar energy is from the bottom surface (i.e. the ice/water interface) for both wavelengths. This is quite difficult to substantiate for the X(HH) image due to the processing speckle previously mentioned. However, on the L(HH) image this area is clearly and easily defined. The main difference between Areas 1 and 7, based on these images and interpretations presented, is determined to be the difference in roughness of the ice/water interface rather than of the ice/air interface.
Clearly, these interpretations are somewhat speculative and require considerable verification and additional ground work and interpretation for accurate substantiation. Questions concerning determination of the thickness of the ice are still awaiting answers, and it is extremely doubtful if the approach used in this imagery analysis will be able to answer such queries adequately. However, from this brief analysis, it is also possible to obtain, at least relatively, some indication of the ice history—an indication which is not always readily available through other types of remote sensing.
Discussion
Because fresh-water ice has extremely low relative dielectric permittivity at these frequencies (compared with 80 for water) and because the loss tangents are also low, it is concluded that there is considerable penetration of the microwave energy even at these short wavelengths through the ice to the ice/water interface. Thus a situation which is relatively unusual in the natural world, as normally discussed with respect to active microwave imaging systems, exists. For example, at these wavelengths, for soils having 10-20% moisture, the depth of penetration would be on the order of a few centimeters (Reference Grant and GrantGrant and others, 1973). In the case of ice, penetration is at least an order of magnitude greater through ice having thicknesses varying from 25 cm (for new, black ice) to 72 cm (for pancake ice).
Although not specifically identified on these images, areas of open water are quite easily identified because the water generally acts as a specular reflector for all radar energy. The major point of confusion between open water and a type of ice is probably in the area of ice which is thin enough to reflect from the lower ice interface and smooth enough to act as a specular reflector at both surfaces. Such is the condition for areas of new black ice (e.g. Fig. 7, Area 6). In the imagery presented in this paper, areas of open water do not occur, although open water surrounded by ice (e.g. leads or polynyas in brash ice), would appear similar to Area 9, Figure 7.
These data have several applications for the two types of problem previously mentioned. If the imagery can be quickly obtained (that is, in the near real-time context), it is a valuable source of information for conducting winter navigation in the upper Great Lakes. Such an experiment has been conducted by NASA Lewis during the 1973-74 winter season. The (real-aperture) radar imagery was transmitted via a facsimile link directly to the bridge of the ship traversing the ice. This imagery was then interpreted to aid in the plotting of the ship's course. The timeliness of the data was an instrumental part of the success of the project. Generally data in excess of 12 h old is not useful for ice navigation, although the allowable delay might vary depending on the nature of the ice conditions, the weather, and the strength and speed of the ship negotiating the ice. The advantage of using radar over other operating sensors is the independence of data collection from weather, atmospheric, and lighting conditions and the fact that it may be operated by the user in near real-time. Also, giving the original data directly to the user without the need for the interpretation and cartographic steps, allows the user to conduct his own “ground truth” and thus become more familiar with the relationships between the imagery and the ice situation. The users would thus become more proficient in the application of the data and learn to discriminate the data for themselves.
For other problems, those dealing with ice hydrology and the interpretation of past ice events, it is felt that a considerable amount of information is obtainable from this imagery. For example, the surface reflectivity of the ice is often an indicator of the ice history—smooth ice (i.e. a dark area) is either new black ice, ice which had been flooded and thus had the surface irregularities removed, or ice which has been smoothed through the formation of white ice. Ice having very dark and even tones in all images, and for the moderate thicknesses discussed in this paper (i.e. which allow penetration of the microwave energy and reflection from the ice/water interface), has smooth surfaces at both interfaces. In both cases, such smoothness of the ice may be more easily distinguished from open water by using a time-series of radar imagery. This may indicate a certain stability in the meteorological and spatial contexts in which the ice was formed. For example, the areas identified as 6a and 6b on Figure 6 are behind the ice foot or enclosed in large brash-ice areas. These were probably subjected either to flooding or ice removal and refreezing. The ice in these areas was of two different thicknesses. In Area 6a (formed by the removal of ice and the development of new black ice) it averaged only about 25-35 cm in thickness. In Area 6b the ice thickness was as high as 65-70 cm. This area was the result of flooding of old ice and consequent smoothing of the ice/air interface. This was coupled with the downward growth of ice, which then smoothed the lower (ice/water) interface. Area 8 (Fig. 7) closely follows the shoreline and apparently has a similar history. Its slightly higher return on the images is probably the result of the snow drifting and crusting combined with its surface and internal structure. All of these are common events occurring along the Lake Superior coast.
In areas where the upper surface is smooth and the lower surface is rough (as seen, for example, in Area 1, Fig. 7), several interpretations are possible. The most commonly observed feature during the field work was the freezing of pancake ice into a matrix of black ice. What had happened was the opening of the water, the development of pancakes, and their drifting into that open-water area. During a subsequent period of quiescence, the refreezing process locked the pancakes into a matrix of relatively shallow black ice. The pancakes, generally round and with diameters of up to 8 m, had thicknesses of 60-80 cm. The black-ice matrix, on the other hand, was much thinner (25-30 cm). The modeling of the cross-section of these areas presents a rather unusual, rectangular ice/water interface which effectively scattered the microwave energy. In time this lower surface will be smoothed with the downward growth of the black-ice matrix and, ideally, subsequent radar imaging flights should detect a decrease in the return (assuming other things being equal) from such areas. It is not inconceivable that these data could be used for energy-balance studies, especially when coupled with some basic ice-thickness data. This approach, in addition to others, might prove to be especially useful in areas where continuous and detailed ground work could not be easily conducted.
Conclusion
Although the interpretation of multi-wavelength, multi-polarization data obtained with an active microwave imaging system is qualitative and still in its infancy, it clearly provides types of data which are not easily obtainable by other remote-sensing systems. The fact that fresh-water ice has an extremely low dielectric constant and low loss tangent allows the collection of good sub-surface information by airborne remote sensors. These data can, in turn, provide the interpreter with information which will allow the reconstruction of certain events of the ice history and also provide information which is directly applicable, in real time, to navigation problems in the upper Great Lakes. As with other emerging data sources, there is a tremendous need for additional research to verify the work which has been conducted and to expand the understanding of the interaction of different types of fresh-water ice and microwave energy. These efforts should include, among others, the collection of a set of “ice signatures”, the calibration of the data collection and processing system, the combination of the SLAR imagery and other sensors (especially thermal sensors) for their mutual interpretability, and the development and conduction of an expanded ground-truth operation.
Acknowledgements
The work reported in this paper was supported, in part, by the National Aeronautics and Space Administration, Lewis Research Center, Cleveland, Ohio, under contract NAS3-18239. R. Gedney was the NASA-Lewis project manager.


