


Introduction
The aim of this exploratory study is to investigate whether the thermoluminescence (TL) signal held in suspended sediment undergoing fluvioglacial transportation varies over time at a given location and, if so, to determine the factors controlling those fluctuations.
Thermoluminescence is the light emitted by a mineral grain, previously exposed to ionizing radiation, upon heating. TL dating utilizes the amount of light emitted by mineral grains in a sediment to determine the total amount of ionizing radiation (the equivalent dose, ED) experienced by the grains since they were last bleached or “zeroed” by exposure to sunlight or to intense heat. The ED value is then divided by the environmental dose rate, as measured by monitoring at the site or by laboratory assay. Several techniques exist for the determination of the ED value (Winde and Reference Huntley, Berger, Divigalpitiya and BrownHuntley, 1982; Reference BergerBerger, 1988). All techniques are based on the assumption that the grains experienced a measureable degree of bleaching during transportation prior to deposition. If they did not, then they will carry a residual geological TL signal which can lead to over-estimation of the amount of radiation received since the most recent depositional event, and hence to an over-estimate of the age of that event.
Any technique which allows direct dating of the deposition of fluvial and fluvioglacial sediments has immense potential utility in the elucidation of Quaternary events. TL has become an increasingly used tool for dating aeolian sediments such as loess and dune sand, and has also been held to give acceptable ages for some fluvial sediments though with certain qualifications (see Reference BergerBerger, 1988, Reference Berger1990). There is also some hope for accurate dating of colluvial deposits using this technique (Reference Forman, Jackson, McCalpin and MaatForman and others, 1988).
Less hope has been expressed for the dating of some other types of sediment because of uncertainty about the degree of “zeroing” or resetting of the TL “clock” that they will have experienced prior to deposition and burial. These sediments include fluvioglacial and many glacial deposits. Some workers (e.g. Reference Butrym and MaruszczakButrym, 1986) think that pressure and intergranular friction during transport may reduce stored TL in certain sediments, including subglacial tills. This conclusion has been directly contradicted by Reference Busuoli, Oberhofer and ScharmannBusuoli (1978), who considered that abrasional friction might result in increased TL levels, and indirectly by the findings of several other researchers (Reference GemmellGemmell, 1988a; Reference FormanForman, 1990). In contrast, there is general agreement that supraglacial tills and resedimented flow tills will have been at least partly bleached prior to deposition (Reference GemmellGemmell, 1988a) and thus be more amenable to dating by TL.
Although modern, zero-age river-transported sediments, in particular alluvial deposits, have been investigated by various workers over the years, it is becoming increasingly clear that it is only by studying the transport routeways of sediment prior to deposition that the TL age of glacial and fluvioglacial deposits can be confidently related to their geological age (see, for example, Reference GemmellGemmell, 1988a,b; Reference FormanForman, 1990). One of the principal problems is determination of the rate of zeroing of the TL signal during fluvial transport. It is known that bleaching of feldspar grains can take place under 7 m of still lake water (Reference KronborgKronborg, 1983), but the rate of bleaching is also affected by flow speed and turbulence (Reference GemmellGemmell, 1985) and in particular by the filtering effect on light of suspended sediment within the water column. To some extent, these problems can be overcome by the utilization of appropriate filters in the laboratory bleaching process (Reference BergerBerger, 1988, Reference Berger1990) during TL dating. Such techniques have yielded low ED values for modern (zero-age) silt-sized river sediments undergoing transport or on mud banks within the active channel of a river (e.g. Reference Huntley, Berger, Divigalpitiya and BrownHuntley and others, 1983; Reference BergerBerger, 1990). Analysis of these sediments generally yielded ED values < 5Gy, approximately equivalent to a zero-age TL date.
Surprisingly, one of the fluvial samples reported by Reference Huntley, Berger, Divigalpitiya and BrownHuntley and others (1983) had an ED of c. 25 Gy, while Reference GemmellGemmell (1988b) had reported EDs of up to 240 Gy for suspended sediment in a meltwater stream in Austerdalen, western Norway. Clearly, these sediments had not been fully zeroed, a fact which Reference GemmellGemmell (1988b) attributed to the mixing of sediments of different ages within the fluvioglacial environment, and in particular the re-entrainment of older sediment by erosion of the bed and banks of the river. Reference Huntley, Berger, Divigalpitiya and BrownHuntley and others (1983) considered that the “erroneous” value obtained in their study was possibly a consequence of the sample having been collected in winter at a time of low solar insolation and hence of limited bleaching. If Gemmell’s interpretation is the correct one for this phenomenon, then it may prove possible to use TL analysis as a sediment source-tracing technique. The present study continues the investigation of this phenomenon.
Hypotheses to be Tested
The studies discussed above have several limitations in common. The source of the suspended sediment is not usually known, and therefore the distance of travel and duration of exposure to sunlight of the sediment prior to sampling cannot be determined. Reference GemmellGemmell (1985) demonstrated in a laboratory experiment that zeroing is affected by speed of flow of the water, which can also influence the duration of transport of the sediment.
The majority of studies of the TL of river-borne sediments has been based on spot samples, often only a single sample at any one location. Reference GemmellGemmell (1985) showed the pattern of bleaching over time at a fixed location, but only in a laboratory context where light exposure was continuous. The same author has also followed the course of a stream (Austerdalselven, western Norway), taking samples in an attempt to determine down-flow bleaching patterns in a field situation. In this case, the conclusion reached was that the suspended sediment was probably a mixture of glacially derived sediment, bleaching cumulatively downstream, and of material derived from the bed and banks of the flow and hence likely to have an “older” TL signal. The problem of dating sediments containing mixed populations of “young” and “old” grains has already been recognized and a technique devised to correct for this (Reference JungnerJungner, 1983). This assumes that the sediment is a mixture of bleached and unbleached grains but makes no allowance for partially bleached grains, and so is of limited applicability.
It is well known that fluvioglacial streams possess a complex flow regime (Reference Röthlisberger, Lang, Gurnell and ClarkRöthlisberger and Lang, 1987) with a strong diurnal rhythm and often a seasonal rhythm as well, especially outside the tropics. It therefore seemed appropriate to investigate whether or not the TL signal of suspended sediment carried by a glacial meltwater stream showed a similar diurnal rhythm, and therefore whether the “anomalous” EDs previously reported might be a function of the timing of the act of sampling. More specifically, the following hypotheses were tested:
-
(a) That the level of natural TL (NTL) in the suspended sediment passing a fixed point in the river channel shows diurnal fluctuations.
-
(b) That the level of NTL in the suspended sediment correlates positively with the concentration of such sediment carried by the river.
-
(c) That fluctuations in the level of NTL in the suspended sediment reflect the difference between day- and night-time light intensities.
-
(d) That the level of NTL in the suspended sediment in the river is a function of the depth of flow.
Field Area and Procedures
Field work was conducted along the course of a small meltwater stream draining southward from the snout of Solheimajökull, an outlet glacier of the Mýrdalsjökull ice cap in southern Iceland (Fig. 1). Outcrops within the drainage basin suggest that geologically it is formed entirely from rock of volcanic origin, including palagonites, ash and breccias. The area is subject to very high rates of erosion (Reference Lawler, Maizels and CaseldineLawler, 1991), a situation attributable to the friable nature of the rocks.

Fig. 1. Map of south-west Iceland showing the location of the field area.
Two rivers emanate from the terminus of Sólheimajökull, the more westerly being a large, turbulent and fast-flowing stream, Jökulsá á Sólheimasandi. The easterly outlet, a much smaller stream, was used to test the hypotheses. On emerging from the glacier, this stream flows 400 m across a small sandur before entering a rock gorge, in which it descends about 15 m via a series of waterfalls and rapids. Below the gorge, the river flows over an extensive area of gravel in a braided manner for about 1 km (Fig. 2). At the southern end of this section, the stream channels are diverted eastward by deposits of the Holar moraine and outwash system, the flow becoming concentrated into a single channel 3-4 m in width. It was along this last section that the sampling point used for the experiment was sited (Fig. 2).

Fig. 2. Morphology of the field area, showing the location of the sampling point. The dotted line east of the sampling point marks the probable route of avulsion flood water following the storm of 8 August 1989.
Sólheimajökull has been advancing steadily since 1968 (Reference BjörnssonBjörnsson, 1979) and the snout is heavily charged with both englacial and supraglacial sediment. The meltwater streams are already carrying a significant sediment load by the time they emerge from the snout of the glacier (Table 1). Erosive scars are visible where the channel impinges on till and recent moraines as it crosses the upper sandur, and increasing sediment loads indicate that these must be considered another source of material for transportation down-flow (Table 1). Downstream from the waterfall and the rock gorge, the potential sources for further inputs of sediment to the river become fewer as the flow spreads out on to the gravel sandur, though gullies leading down from the steep slopes bordering the valley to the east may feed colluvium on to the sandur surface during storm events. There is also evidence of limited bank erosion where the flow is diverted by the Holar deposits, probably 14th century in age (Reference Maizels and MaizelsMaizels, 1991).
Table 1. Suspended-sediment concentrations downstream from Sólheimajökull

Methodology
During the period 7-9 August 1989, samples of water and suspended sediment were taken from the sampling site at hourly intervals, with the depth of water being recorded at 0.5 m intervals across the stream at the same time. Each sample was taken by dipping a plastic bottle (capacity 300 ml) into the stream to a depth of 20 cm at a point 1.5 m from the west bank, allowing it to fill, and then transferring the sealed bottle to a light-tight box as quickly as possible. In no case was a bottle exposed to light following sampling for more than 1 min, and in the majority of cases the potential exposure time was less than 30 s.
It had been intended to take samples at hourly intervals over a 48 h period, so as to collect suspended sediment in a range of flow conditions. In the event, there is a break in the record (from 1000 to 13 00h on 8 August) due to storm conditions. The heavy rain which accompanied the storm did, however, offer an opportunity to study the impact of a flood event on the TL of sediment undergoing fluvioglacial transportation.
Methods of Analysis
The water plus sediment samples were taken for analysis to the TL laboratory at the University of Aberdeen. Samples were dried at 50°C and the concentration of sediment in the water calculated and noted. Polyminerallic fine-grain (2-8 μm) sub-samples of the sediment were obtained by suspension in acetone and deposited on aluminium discs. No pre-treatments were applied. The proportion of the suspended sediment in this size range was very small, so only three or four discs could be made from each sample, each disc containing c. 1 mg of sediment.
Natural TL was measured in an atmosphere of oxygen-free nitrogen at a heating rate of 5°Cs-1, using a combination of Corning 7-59 and 4-69 filters in front of an EMI 9135Q, photomultiplier tube. All results were normalized using zero glow normalization (see Reference AitkenAitken, 1985).
Any fluctuations in NTL of the fluvioglacial sediment detected upon measurement have been assumed to be due to natural zeroing caused by exposure to light during transportation, as any anomalous fading potential of the NTL signal would have been realized long before entrainment and transportation. Any tendency to fade would, however, be significant were an attempt be made to obtain an ED for such a sediment. To test for this phenomenon, two bulk samples from recently deposited sediment at the snout of Sólheimajökull, and which form a potential source of sediment for the meltwater stream, were analysed.
Samples were prepared using the same procedures as for the suspended-sediment samples. Each disc was given a laboratory irradiation of 235 Gy, using a 90Sr β source delivering 6.53 radiations min-1, and was then stored in the dark at room temperature (c. 20°C) for various periods of time before being glowed out. Fading was calculated as the percentage of ATL lost over time (ATL = TLirrad-NTL).
It can be seen from Figure 3 that fading of the TL signal is significant in one of the samples. This fading of the TL signal meant that any attempt to use a single-disc procedure to calculate the ED of any of the suspended-sediment samples, as had successfully been attempted by Reference GemmellGemmell (1988b) for Norwegian examples, would have been impracticable. NTL levels are therefore used here as a surrogate for ED values, although it is recognized that the correspondence may be far from precise.

Fig. 3. Results of TL fading tests conducted on two bulk samples. Sample 1, which clearly fades significantly, is supraglacial sediment taken from the eastern margin of Sólheimajökull. Sample 2 is water-washed ice-marginal sediment from the same locality. All data refer to the 325°C peak.
Results
Pattern of water depth and flow velocity
Water depth at the sampling point was measured by using a surveying staff as a depth gauge. The flow depth fluctuations exhibited are very much as might be expected, with a distinct diurnal pattern being evident (Fig. 4b), although distorted by the flood peak associated with the storm on 8 August, which gave significant water depths at a time when a low flow would normally have been anticipated.
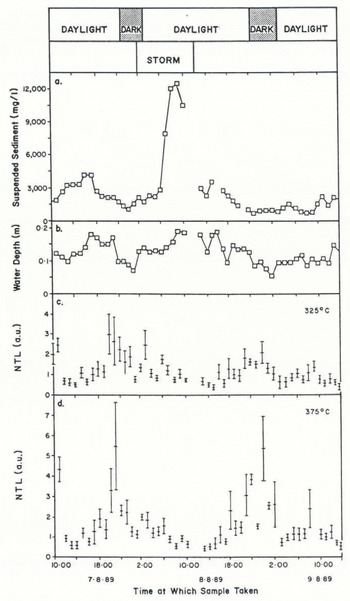
Fig. 4. a. Fluctuation of suspended-sediment concentration during the sampling period. The break immediately following the peak concentration is due to no samples being taken at that time; the other gaps are because sample bottles split in transit and material was lost. b. Fluctuation in depth of water at the sampling point. The values are for the depth 1.5 m from the west bank of the stream, c. Fluctuation in NTL (natural thermoluminescence) level of 325°C peak of glow curve during sample period, d. Fluctuation in NTL level of 37°C peak of glow curve during sample period.
An attempt was made to measure flow velocity through the measured cross-section to enable construction of a rating curve to determine discharge. Equipment malfunction prevented the construction of all but the most rudimentary rating curve. The errors associated with this are so great that it was felt unsafe to use this curve, and consequently flow velocity has not been included as a variable in the analysis. Flow depth has been used instead as a surrogate for velocity.
Suspended-sediment Load
Suspended-sediment fluctuations are shown in Figure 4a. The main feature of the graph is the massive sediment spike associated with the passage of the flood peak following the storm event. Sediment concentrations at this time reached 12 000 mg l-1, a level considerably in excess of the maximum suspended-sediment concentration reported by Reference Lawler, Maizels and CaseldineLawler (1991) for the neighbouring river Jökulsá during the period 1973-88. Note that the sampling procedure used in the present study usually yields slight over-estimates of the suspended-sediment concentration (Reference Gurnell, Gurnell and ClarkGurnell, 1987). The data Lawler discussed were obtained by “instantaneous” measurements of suspended-sediment concentration obtained at a frequency of around 12 samples/annum. As Lawler indicated, there is a high probability that the sampling scheme he reported on missed short-lived but highly significant peak flows, which would have carried sediment concentrations approaching the peak obtained in the present study. Such a sediment concentration in a meltwater stream is far from unique (see, for example, Reference Gurnell, Gurnell and ClarkGurnell, 1987), although such high concentrations are generally short-term peaks rather than steady loads.
Suspended-sediment concentrations were high throughout the period of sampling. The minor peak between 1600 and 17 OOh on 7 August overlaps the late afternoon diurnal flow peak (Fig. 4b). It may therefore be the product of increasing stream erosional power at that time. Other small fluctuations show no particular pattern and are probably the product of minor erosional events upstream from the sampling point.
It is clear from Figure 4a that suspended-sediment concentrations were generally lower following the flood event than preceding it. This may reflect exhaustion of sediment sources such as the river channel as a consequence of increased entrainment during the flood.
Thermoluminescence fluctuations
The TL glow curves show low levels of luminescence (Fig. 5) with no clear peaks in the majority of samples. In order to clarify any patterns in the TL, levels of luminescence at 325°C and 375°C have been plotted against time of sampling (Fig. 4c and d). These values have been chosen as they represent quartz-dominated TL peaks, one of which is easily bleached (325°C) while the other is resistant to bleaching (375°C), according to Reference Spooner, Prescott and HuttonSpooner and others (1988). It was hoped that comparison of the fluctuations of the level of the two peaks might reveal changes in sediment-supply sources. Quartz peaks were chosen for specific examination as they are not prone to anomalous fading, unlike feldspar peaks (Reference WintleWintle, 1973).
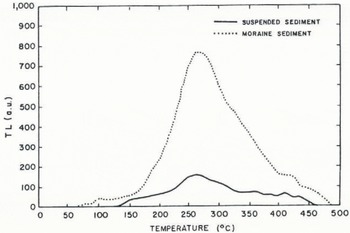
Fig. 5. Typical glow curves showing the NTL of the suspended sediment, compared with that of an older and relatively unbleached ice-marginal sediment from the snout of Solheimajökull.
The fluctuations of the readily bleachable 325°C peak (Fig. 4c) show a pattern which suggests that a non-random distribution was being sampled. The highest levels of TL associated with this peak occurred about 2000-21 00h on the evening of 7 August, at a time when stream-flow depth was stable or falling slightly. At this time, fluctuations of the 325°C NTL peak led those of flow depth by roughly 1 h, but later in the period of measurement no obvious correspondence could be seen. Although precise calculations are not possible, the flow-velocity measurements indicate that this is about the minimum time water might take to flow the 2.7 km from the glacier snout to the sampling point. The 325°C curve shows clearly that the levels of NTL were quite high in the hours leading up to the onset of darkness on the night of 7-8 August but that they fell back during the storm. Following the storm, the 325°C NTL levels rose to a peak in the late evening of 8 August, but again fell back with the onset of night. Daylight on 9 August was accompanied by rising 325°C NTL until 09 00 h, after which time levels started to fall again. The pattern for these hours closely reflected fluctuations in the flow depth but was out of phase with sediment concentration.
When the graph of the 375°C TL peak (Fig. 4d) is examined, it shows some similarity to the behaviour of the 325°C peak for most of the observation period (Table 2). The principal differences are that the peaks at 11 00h on 7 August, 24 00 h on 8 August and 09 00 h on 9 August are significantly higher than the corresponding lower-temperature peaks, and the highest level of TL observed at this temperature (21 00h on 7 August) is an hour later than the highest 325°C TL peak. There is a tendency for rising levels of 375°C NTL to occur during both afternoons and early evenings, probably relating to erosion of “older” bed and bank material associated with the increase in melt-related flow. During both nights there was also a reduction in 375°C peak height during the period of darkness.
Table 2. Correlations (r) between key variables

Analysis of data
In an attempt to determine whether fluctuations in NTL levels could be related to alterations in the balance of bleached and unbleached mineral grains within the suspended sediment mixture, the 325°C/375°C ratio was plotted (Fig. 6). Since the 325°C peak was the more easily bleached, it was anticipated that the ratio would be highest for samples taken during the hours of darkness and for situations where older material had been entrained from the bed and banks of the river. Thus, the flood peak (08 00-13.00 h, 8 August) should be reflected in an increased 325°C/375°C ratio. This latter point is substantially supported by the data in Figure 6, and by the correspondence between the TL ratio, flow depth and suspended-sediment concentration (Table 2). The graphs indicate little support, however, for any association of a high NTL peak ratio with the hours of darkness.

Fig. 6. Fluctuation of the ratio of NTL levels for 325°C and 375°C during the sampling period. The bars represent one standard error above and below the mean value for the ratio. Each point represents a minimum of three separate measurements. The 3h running mean value for the ratio is also plotted.
The plot of the TL ratio (325 °C/375 °C) shows rapid fluctuation about a general oscillatory trend, indicating that fluctuations in the TL levels of the two temperature peaks are slightly out of phase. If the short-term oscillations in the TL ratio are smoothed with a 3h running mean (Fig. 6), it becomes evident that there is a clear correspondence between high 325 °C signals, relative to 375 ¼ signals, and the period of the storm. At all other times, the smoothed curve shows the 325°C peak is weak relative to the 375 ° C peak.
Discussion
Interpretation of NTL fluctuations
Flow depth and sediment concentration are used as indices of the efficiency of bleaching of NTL during transportation, and show only weak correlation with NTL levels (Table 2). The patterns of NTL levels therefore appear to reflect changes in the sources of sediment entrained by the river rather than transport processes.
The relatively high levels of NTL in the late afternoon and early evening probably relate to the increase in stream flow at that time. The increased flow power permits the entrapment of “older” bed and bank material by the stream, giving a rising NTL level in the suspended-sediment mix. The fall in NTL levels during the hours of darkness is more difficult to explain, as it had been anticipated that a reduction in bleaching activity (and hence an increase in particular in 325°C NTL) would be evident at night. It is most likely that as flow reduced with the night-time cooling of the air inhibiting ice melt, so the ability of the stream to entrain “old” sediment from the channel boundaries diminished. The sediment mix in the stream would then be dominated by “young” fine-grained surficial sediment from the stream bed and banb and by material supplied directly from the glacier. This latter material, particularly if supraglacial in origin, would already be well-bleached (Reference GemmellGemmell, 1988a).
During the storm of 7-8 August, the high concentration of suspended sediment would have screened many mineral grains from light. Massive entrainment of “old” material from the channel bed and banks would also have been expected. However, the anticipated rise in NTL levels clearly did not materialize (Fig. 4c and d).
Following the storm, an examination of the stream course up-flow from the sampling point revealed signs of recent avulsion. Fresh sediment had been deposited on top of living vegetation at some locations, and there were many other signs that the river had spread over its floodplain in the recent past. If the flow over the floodplain had been reasonably strong, sediment would have been lifted from the surface of the floodplain. This material would probably have been well zeroed, as has been found to be the case for similar sediments in Canada (Reference Huntley, Berger, Divigalpitiya and BrownHuntley and others, 1983; Reference BergerBerger, 1990). In addition, the rain would have caused further augmentation of the sediment load by washing well-bleached material down from the valley sides. The admixture of sediment of low NTL levels into the suspended load would have caused an overall depression in NTL levels for the duration of the storm and for the following hours of continued high flow.
While absolute NTL levels during the flood are indeed quite low (Fig. 4), the 325°C/375°C ratio is high (Fig. 6), a phenomenon which does not accord with the idea of a well-bleached floodplain surface as the principal source of the increased sediment input to the stream. The high ratio points instead to substantial entrainment at this juncture of “older”, unbleached sediment with a substantial 325°C signal. It is therefore suggested that “older” floodplain or Hiorainic sediment was also entrained in large quantities, possibly due to bank collapse or bed erosion, as a result of increased flow power during the storm.
Implications
This study demonstrates that environmental conditions affect TL levels in sediment undergoing fluvial transport. TL dating of Pleistocene fluvial sediments has so far only been attempted in a limited number of studies. The data presented here suggest that the conditions of transport and the source material of fossil fluvioglacial sediments will affect their TL age. Material eroded and deposited by small fluvioglacial streams close to the source is likely to be poorly zeroed except, perversely, where it is a flood deposit which may incorporate well-bleached sediments from the floodplain and flanking hillslopes.
Sediments deposited by larger rivers may have had sufficient travel time for full zeroing to take place prior to deposition. The mixture of sediments from different sources within the basin with commensurately different periods of transportation is likely to include grains with differing degrees of bleaching, as cited by Reference JungnerJungner (1983) for Quaternary sands from Finland. Jungner suggested that the critical factor affecting the zeroing of the sediment was the presence of impurities on the surface of the feldspar grains. Such a factor may also be relevant to the present study but it would be either a constant factor or totally random, and unlikely therefore to be a cause of the fluctuations detailed above. The longer the travel path of the sediment, both in time and space, the more likely it is to be fully zeroed prior to deposition. Also, the more slowly a deposit has accumulated, the more likely it is to have been fully zeroed and thus amenable to accurate TL dating.
Although techniques have been developed to deal with problems of TL dating of partially bleached sediment (for examples, see Reference Wintle and HuntleyWintle and Huntley, 1982; Reference BergerBerger, 1990), the accuracy of results is difficult to guarantee with sediment of mixed bleach character. This difficulty will be compounded in the case of fossil fluvioglacial deposits by the grain (and bleach) mix varying during deposition with fluctuations in the controlling variables.
The analyses indicate that, in suspended sediment that has experienced only limited fluvioglacial transport, the degree and pattern of bleaching of the NTL signal may be used to differentiate sediment-source areas. Flow depth and suspended-sediment concentration do not correlate well with absolute NTL levels (Table 2) but do explain a significant part (multiple correlation, r = 0.6) of the variation of the 325°C/375°C NTL ratio, probably through their influence on the bleaching of the 325°C signal. Fluvial transport during daylight therefore causes the previous NTL ratio to be over-written with a ratio which is a function of post-entrainment light exposure, provided that the source material is “old” and unbleached. Material that has already been fully zeroed prior to entrainment should not show any such fluctuations, either in terms of absolute NTL or of NTL ratios, with light exposure during transport.
When the NTL ratio (325°C/375°C) is normalized for presumed light exposure during transportation by regressing it against flow depth plus suspended-sediment concentration, the fluctuations of the residuals (Fig. 7) are interpreted as indicating changes in the source and pre-entrainment “age” of the sediment being transported past the sampling point. Positive residuals represent samples with a relatively unbleached 325°C TL signal and are considered to indicate “older” sediments dominating the mix, while negative residuals indicate that “young” material is dominant.

Fig. 7. Fluctuations in residual levels of the NTL ratio (325°C 375°C) when regressed against flow depth and suspended-sediment concentration.
The fluctuation of the NTL ratio residuals during the storm are of particular interest. Three positive peaks are evident during this time (Fig. 7). The first peak may simply be a lagged response to the effect of darkness on the rate of bleaching during transport, as a similar response can be seen in the signal ratio following the night of 8-9 August. The greater lag in the latter case is possibly a function of reduced flow velocity compared with that during the storm. The two later residual peaks during the storm are thought to relate to erosional events causing the incorporation of slugs of “older” sediment into the stream’s load, but the major dip in the NTL ratio which separates these peaks is co-incident (within the resolution of the sampling interval) with river-flow depth being near its maximum. It is tentatively suggested that this event marks overflowing of the stream on to the floodplain and its resultant entrainment of well-bleached sediment.
The limited duration of the experiment means that further observation is needed to determine the universality of the TL fluctuations described in this paper. In particular, techniques are needed to filter out the “noise” element in the TL pattern and allow event-related fluctuations to be seen more clearly. To this end, studies based on sampling of suspended sediment at shorter time intervals are currently in progress. In the meantime, the results quoted in this paper suggest that TL analysis may prove to be a useful tool in the identification of sources of sediment undergoing fluvial or fluvioglacial transport.
Conclusions
In terms of the original hypotheses, the results show some support for the acceptance of hypotheses (a) and (c), and rejection of hypotheses (b) and (d)-at least on the basis of available evidence. Correlations between the TL ratio for 325°C and 375°C and flow depth and sediment concentration suggest that, had hypotheses (b) and (d) been phrased in terms of TL ratios rather than absolute levels of NTL, they too could have been accepted.
The TL levels in sediment undergoing fluvioglacial transportation vary with a number of factors, including flow variability, suspended-sediment concentration and the proportion of transport which takes place at night rather than in daylight but, in particular, with changes in the resource base from which the river obtains its suspended-sediment load. The reliability of a TL date obtained from a Pleistocene fluvioglacial sediment there-fore depends not only on the stratigraphical accuracy of sampling but also on the speed of deposition of the sediment and on the prior history of the constituent material. Given the inherent flow variability in a fluvioglacial river and the effect that it will have on the TL characteristics of the suspended-sediment load, it is suggested that samples be taken from individual beds or layers within a fossil fluvioglacial lithofacies, and the youngest TL date obtained be considered the date of deposition for that lithofacies. Bulk samples are likely to produce over-estimates of the age of deposition.
It is not anticipated that the same problem will apply to those fluvioglacial sediments which accumulate more slowly, for example, in lakes or on bars in braided channels (see Reference BergerBerger, 1990).
Sediment sources and sinks in the proglacial area are important determinants of the component “mix” of suspended sediment in meltwater streams. This study introduces the possibility that the source of different components of the suspended-sediment load of fluvioglacial rivers might be reflected in the TL characteristics of that sediment. If future studies prove this to be the case, then thermoluminescence studies of modern sediments may enable tracing of sediment sources and travel paths within the fluvioglacial environment.
Acknowledgements
I thank the Icelandic Research Council for a research permit to work in the Sólheimajökull area. The Carnegie Trust for the Universities of Scotland and the University of Aberdeen kindly provided financial support for the research. Dr J. Maizels, E. Anderson, A. Leitch, L. Menzies, S. Park and I. Smyth assisted in the collection of samples in the field. The assistance of M. Lamb with the laboratory work and A. Sandison with the illustrations is gratefully acknowledged. Comments from Dr J. Maizeb and Dr A. Murray greatly improved earlier versions of this paper.
The accuracy of references in the text and in this list is the responsibility of the author, to whom queries should be addressed.


