


Introduction
Globally, childhood malnutrition poses a serious public health challenge(Reference Black, Victora and Walker1). Undernutrition is responsible for approximately 45 % of deaths among children under the age of five, particularly in low- and middle-income countries (LMICs)(2). Inappropriate infant and young child feeding (IYCF) practices contribute to more than half of under-five children's mortality(3). The first 2 years of life are recognised as a critical window in which children require more energy and nutrient-dense foods for optimal growth, physical and mental development(4). Furthermore, appropriate feeding practices for infants and young children reduce morbidity, mortality and risk of other chronic diseases. Thus, ensuring adequate nutrition during the period of 6–23 months of age is a major global health priority. However, meeting nutritional needs during this age interval is challenging(Reference Dewey5).
The World Health Organization (WHO) has developed a set of core indicators to assess IYCF practices among children aged 6–23 months considering both breast- and complementary feeding-related practices(6). Dietary diversity is one of the key indicators identified as a useful predictor of the nutrient adequacy of children's dietary patterns(Reference Nti7). It is a measure of the number of different food items/groups consumed over 24 h(6). The WHO identified eight food groups (breast milk, grains, roots and tubers; legumes and nuts; dairy products; flesh foods (meats/fish/poultry); eggs; vitamin A-rich fruits and vegetables; and other fruits and vegetables) which provide the required amount of macro and micronutrients for children aged 6–23 months. It is recommended that children aged 6–23 months consume at least five or more food groups daily(8).
Consumption of diversified food has been linked to the better nutritional status of children in LMICs(Reference Arimond and Ruel9,Reference Sawadogo, Martin-Prével and Savy10) . On the other hand, inadequate dietary diversity has been linked to stunting and being underweight among children. Children who do not meet the minimum dietary diversity requirements are more likely to be stunted, underweight and anaemic(Reference Rah, Akhter and Semba11–Reference Belachew and Tewabe13). Furthermore, inadequately diversified diets predispose children to infection and severe illnesses(Reference Caulfield, de Onis and Blössner14).
Globally, only 28⋅2 % of children aged 6–23 months get the recommended level of dietary diversity. The situation is exacerbated in LMICs, particularly in South Asia, Eastern, West Southern and Central Africa(Reference White, Bégin and Kumapley15). Despite efforts to improve children's dietary diversity, Ethiopia remains the country with the lowest adequate dietary diversity among East African countries(Reference Kang, Chimanya and Matji16). In 2016, only 14 % of Ethiopian children had been given a sufficient number of food groups and were considered to have an adequately diverse diet(17).
Few studies in Ethiopia had attempted to assess the determinants of dietary diversity among children, particularly those aged 6–23 months(Reference Kuche, Moss and Eshetu18–Reference Disha, Tharaney and Abebe21). However, available studies are restricted to certain areas and contexts, and comprehensive evidence-based nationally representative data are scarce. Hence, we investigated the community and individual-level determinants of minimum dietary diversity among children aged 6–23 months in Ethiopia, using an advanced statistical method, and considering the hierarchical nature of the Ethiopia Demographic and Health Survey (DHS) data.
Methods
Study setting
The study was carried out in Ethiopia, a country located in Northeastern Africa. The country has a total estimated population of 109⋅2 million people and covers about 1⋅1 million square kilometres of area and has great geographical diversity, ranging from 4550 m above sea level to 110 m below sea level. The data were collected based on the country's previous nine administrative regions and two administrative cities(17), but the country now has two additional regions (Sidama region and South West Ethiopia Region) that are separate from the Southern Nations, Nationalities and Peoples’ Region (SNNPR). The administrative region is divided into zones, districts, towns and kebeles (the smallest administrative units).
Study design
The present study used a cross-sectional, secondary data analysis design. We used the most recent and nationally representative 2016 Ethiopian Demographic Health Survey (EDHS) data(17). A stratified two-stage cluster sampling technique was applied. A total of 645 enumeration areas (EAs) were chosen in the first stage, using probabilities proportionate to EA size (202 in urban and 443 in rural) (based on the 2007 EPHC frame). A fixed number of twenty-eight households in each cluster were chosen using an equal probability systematic sampling technique in the second stage. For this study, Kids Record (KR) file containing information about women and children was used, and important variables related to inadequate dietary diversity were extracted from the dataset. In the present study, 2960 weighted data of children aged 6–23 months were used for analysis.
Measurement of outcome
Based on the updated WHO guideline(8), minimum dietary diversity was defined as the proportion of children aged 6–23 months who consumed at least five food groups out of the eight referenced food groups within 24 h. These food groups are (1) breast milk; (2) grains, roots, and tubers; (3) legumes and nuts; (4) dairy products; (5) flesh foods (meats/fish/poultry); (6) eggs; (7) vitamin A-rich fruits and vegetables; and (8) other fruits and vegetables. The total dietary diversity score ranges from 0 to 8, with 1 point given for each of the 8 food groups consumed. Children with dietary diversity scores ≥5 were classified as they attained the minimum dietary diversity, whereas those with scores <5 were classified as unmet MDD. The outcome variable was coded as 1 for adequate dietary diversity and 0 for inadequate dietary diversity.
Determinants
We selected possible determinants based on evidence from literature and the availability of variables in the EDHS-2016. We investigated the effect of explanatory factors on dietary diversity at both the individual and community levels.
The study included individual-level determinants such as child, maternal and paternal characteristics. The children's characteristics included sex, age (in months), birth order and episodes of cough or fever in the last 2 weeks. Maternal characteristics included: age (years), highest educational level, frequency of listening to the radio, frequency of watching television, attending Antenatal care (ANC) follow-up, place of delivery, postnatal care visit and maternal empowerment(Reference Choudhury, Headey and Masters22). Paternal characteristics included paternal characteristics including the highest educational level and occupation. Household characteristics include the household wealth index, the gender of the household head, the number of children under the age of five and the number of total household members. Parents’ occupations were classified as Not working (unemployed), Nonagricultural works (professional, technical, managerial, clerical, sales, services, skilled manual and unskilled manual), Agricultural works (agricultural – employee) and others.
The community-level determinants included contextual region (agrarian dominant, city dwellers dominant and pastoralist dominant), place of residence (either urban v. rural) and aggregate variables such as community poverty (higher v. lower), community distance to a health facility (distance a big problem v. distance, not a big problem) and remoteness of the location. Community poverties were created from mean values of wealth index categories of the individual mothers for each cluster. The two values for the community poverty level were higher poverty and lower poverty.
The EDHS did not capture data that can directly describe the characteristics of the community/clusters except the place of residence, mean rainfall, mean temperature and altitude. Hence, we created community variables by aggregating the individual-level characteristics within their clusters. The aggregates were computed using the average values of the proportions of women in each category of a given variable. Likewise, based on the national median values aggregate values were categorised into groups. These aggregate community-level determinants include contextual region, community distance to a health facility and remoteness of the location. We used GIS estimates of travel time to cities to construct a ‘living in a remote location’ dummy variable that equals 1 if the DHS cluster has more than a one-hour travel time to a town/city of 20 000 people or more(Reference Choudhury, Headey and Masters22).
Contextual region: For this study, the administrative regions were categorised into agrarian, pastoralist and city, based on their settings that may have a relationship with child dietary diversity. Since regions used for administrative purposes might not necessarily be related to the child feeding practice of the population. The regions of Tigray, Amhara, Oromia, SNNPR, Gambella and Benshangul-Gumuz were recorded as agrarian. The Somali and Afar regions were combined to form the pastoralist region and the city administrations – Addis Ababa, Dire Dawa and Harar – were combined as a city. Though Gambela and Benshangul-Gumuz have been considered pastoralists in recent times, their living settings approached the agrarian(Reference Yebyo, Alemayehu and Kahsay23).
Ecological level variables such as mean rainfall per year, 1985–2015 (mm), mean temperature, 1985–2015 (Celsius) and altitude (metres) were also included.
Data management and analysis
The data were analysed using STATA version 16 (StataCorp, College Station, TX, USA). In this analysis, households with children aged 6–23 months old with no missing information on dietary diversity were included. To adjust for the redistribution of samples to different regions and the possible variation in response rates, we used sampling weight in all the analyses. The ‘Svy’ command was used to allow for adjustments for the cluster sampling design. Categorical variables were reported using absolute and relative frequencies; whereas continuous variables were summarised using mean with standard deviation (sd) or median and interquartile range (IQR) for variables that deviate from normal distribution after visual examination using a histogram.
Due to the nature of the EDHS data, being a hierarchical structure, data are often correlated and thus cannot be assumed, independent. Hence, to identify individual and community-level determinants of dietary diversity, we performed a multilevel logistic regression. A multilevel approach adequately adjusts the unexplained variability of the nested structure and can estimate cluster-level effects on the outcome variable. Therefore, in the present study, a two-level mixed-effect logistic regression analysis was employed to estimate the independent (fixed) effects of the explanatory variables on dietary diversity adjusting for cluster and regional-level random effects. To investigate the community and individual-level determinants of minimum dietary diversity among children aged 6–23 months, any variable with a P-value of 0⋅25 on a univariable test was a candidate for the multivariable model, along with all variables of known clinical importance. Four models were fitted and compared. Model 1 was an empty model which was fitted without independent variables to test random variability using the Intraclass correlation coefficient (ICC); Model 2 include individual-level factors (age of the child, mother's educational level, frequency of listening a radio and wealth quintile of household); Model 3 include community-level factors (place of residence (either urban v. rural), mean annual rainfall of the cluster 1985–2015 (mm) and mean temperature 1985–2015 (Celsius)) and Model 4 include both individual and community-level factors. The relative fits of these models were then compared using the Akaike (AIC) and Bayesian Information Criterion (BIC), and the difference in model fit was compared using the χ 2 test. Finally, the adjusted odds ratios (AORs) with the 95 % confidence intervals (95 % CI) were reported.
Ethical considerations
We requested access to the datasets from the Demographic and Health Surveys (DHS) program/ICF International, and permission was granted by DHS program data archivists to download the dataset for this study. Before the authors could access the data, it was de-identified. The data were only used for the registered research topic and were not shared with anyone else.
Results
Participant's characteristics
Out of a total of 2960 children, the majorities (53⋅0 %) were girls, with 36⋅7 % aged 12–17 months. Nearly one-third (32 %) of children were second or third born for their families. The majority (52⋅0 %) of mothers were between the ages of 20 and 29 years, and 802 (60⋅9 %) had no formal education. More than half of the mothers (61⋅5 %) gave birth at home, and 1018 (34⋅0 %) did not seek ANC during their most recent pregnancy. The proportion of mothers who never watched television and never listened to the radio was 81⋅6 and 72⋅5 %, respectively. Two hundred and seven (7⋅4 %) of fathers and 1802 (57⋅5 %) of mothers were unemployed. Most children (87⋅8 %) resided in rural areas and agrarian dominant regions (91⋅8 %) (Table 1).
Table 1. Children's, parental, household, healthcare and community-level characteristics of living children aged 6–23 months, Ethiopia 2016

Dietary diversity
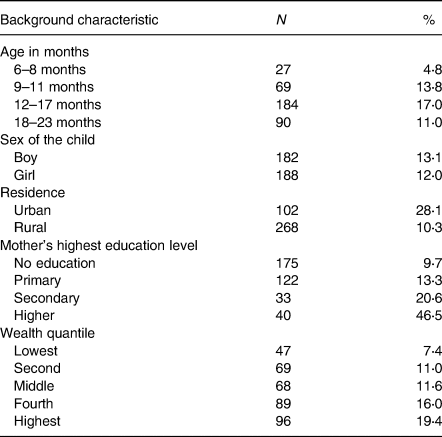
For children aged 6–23 months, the median dietary diversity score was 4 (IQR: 2–4), with only 12⋅5 % achieving the minimum dietary diversity (Fig. 1). The proportion of children who met the required minimum dietary diversity was higher among those who reside in urban (28⋅1 %) than rural (10⋅3 %). The percentage of children who achieved the minimum dietary diversity was lower among children belonging to households in the lower quantiles (7⋅4 %) compared to second, middle, fourth and highest households. Only 9⋅7 % of children whose mother has no education has achieved the minimum dietary diversity, which is much lower compared to children whose mothers have primary (13⋅3 %), secondary (20⋅6 %) and tertiary education (46⋅5 %) education (Table 2).

Fig. 1. Distribution of the dietary diversity score and prevalence of the minimum dietary diversity for 6–23 months children in Ethiopia 2016.
Table 2. The distribution of children 6–23 months who achieve the minimum dietary diversity in Ethiopia 2016

Food groups consumed
Grain, roots and tubers (63⋅6 %) were the most consumed food items 24 h preceding the survey. However, only 8⋅7 and 17⋅2 % of children, respectively, have consumed flesh foods and eggs in the past 24 h preceding the survey. In addition, only 2⋅8 % of children aged 6–8 months consumed flesh foods such as meat and poultry (Table 3).
Table 3. The distribution of intake of eight food groups for children 6–23 months of age, in Ethiopia 2016

Determinants of minimum dietary diversity
Compared to those mothers who had no exposure to listening to a radio, those who had listened to the radio at least once a week (AOR 1⋅6; 95 % CI 1⋅1, 2⋅4) or less than once a week (AOR 1⋅6; 95 % CI 1⋅1, 2⋅4) are nearly twice more likely to meet the minimum dietary diversity. Furthermore, compared to the children from the lowest wealth quintile household, those who were from the second wealth quintile household were nearly two times more likely (AOR 1⋅8; 95 % CI 1⋅1, 3⋅0), from the fourth wealth quintile household were nearly three times more likely (AOR 2⋅8; 95 % CI 1⋅6, 4⋅9) and from the highest wealth quintile household were two times more likely (AOR 2⋅1; 95 % CI 1⋅1, 4⋅0) to meet the minimum dietary diversity (Table 4).
Table 4. Determinants of minimum dietary diversity in children aged 6–23 months in Ethiopia 2016

COR, crude odds ratio; AOR, adjusted odds ratio; CI, confidence interval.
Discussion
The present study aimed to assess the determinants of dietary diversity using nationally representative 2016 EDHS data. We found that only 12⋅5 % of children aged 6–23 months have adequate minimum dietary diversity, indicating a suboptimal level of dietary diversity score. In addition, we observed that only a small proportion of children consumed animal-source foods. Furthermore, the child's age, caregivers’ frequency of radio listening, residence and household wealth index were all significantly associated with children's minimum dietary diversity.
The prevalence of minimum dietary diversity was found to be lower in this study than in the 2016 EDHS report(17). This could be due to the disparity in cut-off points and the number of food groups used to calculate the dietary diversity score. The previous dietary diversity score was constructed based on seven food groups and a child consuming at least four food groups is considered to have achieved the minimum dietary diversity; however, according to the most recent WHO guidelines, the dietary diversity is based on eight food groups, and a child consuming at least five of the food groups is considered to have achieved the minimum dietary diversity(6,8) . Furthermore, the low level of dietary diversity in the study indicates that the majority of children consume a monotonous diet that focuses on a limited number of food groups. Similarly, a systematic review of Ethiopian studies found a low suboptimal level of dietary diversity (23⋅25 %) among children aged 6–23 months(Reference Temesgen, Negesse and Woyraw24). According to studies conducted in India, Rwanda and Burundi, only a small proportion of children receive the required minimum dietary diversity(Reference Beckerman-Hsu, Kim and Sharma25,Reference Custodio, Herrador and Nkunzimana26) . This low dietary diversity may indicate an insufficient intake of micronutrients(Reference Kennedy, Pedro and Seghieri27). Therefore, National Nutrition Program in collaboration with other sectors needs to put an effort to improve the accessibility and utilisation of diversified food types to improve the dietary diversity of children.
Our study showed that grains, roots and tubers were the most consumed food items. Another study conducted in southern Ethiopia found that grains, roots and tubers are the primary staples of children aged 6–23 months(Reference Temesgen28). Meanwhile, animal-source foods such as meat, dairy products and eggs are consumed only by a small proportion of children in the present study, which is consistent with studies conducted in other parts of Ethiopia(Reference Feyisa, Tefera and Endris29,Reference Tessema, Belachew and Ersino30–Reference Beyene, Worku and Wassie32) . Similarly, animal-source food consumption is lower in sub-Saharan African countries than in other parts of the world(Reference Choudhury, Headey and Masters22). Animal-source foods contain a variety of vitamins and minerals, including calcium, iron, vitamin B-12, vitamin A, riboflavin and zinc, which are difficult to obtain in sufficient quantities from plant-based foods alone(Reference Neumann, Harris and Rogers33). Hence, inadequate intake of animal-source foods may lead to inadequate intake of these micronutrients(Reference Dror and Allen34). One reason for the low consumption could be that most animal-source foods were intended for market and a profitable income rather than consumption by family members. Another reason could be a lack of knowledge about the nutritional benefits of these foods(Reference Haileselassie, Redae and Berhe35). A study conducted on Ethiopian mothers showed that mothers are afraid of feeding their children animal-source foods because they believe their children are incapable of digesting them(36). As a result, we recommend that public health practitioners should increase parental and caregiver awareness of the importance of animal-source foods for child growth and development.
Additionally, low consumption of animal-source foods may be due to a lack of access caused by economic constraints(Reference Gebremedhin, Baye and Bekele37). The high price of animal-source foods does not encourage consumption by poor households. This can further be explained by the observed association between household economic status – as measured by wealth quantile and inadequate dietary diversity in this study. Children from the highest wealth quintile of households were more likely to achieve the minimum dietary diversity than children from the lowest wealth quintile of households. This finding is in line with several studies conducted in different parts of Ethiopia and other parts of the world(Reference Beyene, Worku and Wassie32,Reference Joshi, Agho and Dibley38–Reference Belew, Ali and Abebe40) . This association could be explained by the fact that second, middle, fourth and highest households are more likely to be food secure and can purchase a variety of foods(Reference Dafursa and Gebremedhin41).
In our study, older children had a higher odds of achieving minimum dietary diversity than younger children, indicating that infants receive inadequately diversified food when compared to older children. This might be due to the delayed introduction of complementary foods or to the use of only milk and cereals as complementary foods. Another possible explanation is that mothers believe that certain foods, such as bananas, eggs, pumpkin, carrots, green vegetables and meat, are difficult for young children to digest(Reference Tassew, Tekle and Belachew42). This finding is supported by similar studies conducted in Ethiopia among children aged 6–23 months(Reference Beyene, Worku and Wassie32,Reference Belew, Ali and Abebe40,Reference Tegegne, Sileshi and Benti43,Reference Patel, Pusdekar and Badhoniya44) .
The present study showed that mothers who listen to the radio at least once a week are more likely to feed their children a diverse diet than those who do not. Consistently, a study done in India found that listening to the radio was a significant factor in children's dietary diversity(Reference Patel, Pusdekar and Badhoniya44). Similar studies conducted in Northwest Ethiopia and Bangladesh found that a mother's exposure to mass media was a significant predictor of her children's dietary diversity(Reference Beyene, Worku and Wassie32,Reference Blackstone and Sanghvi45) . This suggests that disseminating information about IYCF through the media may have a positive impact on their children's dietary diversity(Reference Bedada Damtie, Benti Tefera and Tegegne Haile46).
Even though studies conducted in Ethiopia and Asia have found a positive association between maternal education and children's dietary diversity(Reference Tegegne, Sileshi and Benti43,Reference Gautam, Adhikari and Khatri47–Reference Khan, Kayina and Agrawal49) , we did not find a statistically significant association between mother's educational status and children's minimum dietary diversity. This suggests that, regardless of the mother's educational attainment, there may be difficulties in translating education into improved dietary practices and subsequent improvements in nutritional status(Reference Khan, Kayina and Agrawal49). The other reason might be due to the presence of a very low number of mothers with the highest educational level.
The study's findings should be interpreted considering the following strengths and limitations. First, the use of nationally representative survey data from Demographic Health Surveys enhances the generalizability of our findings. Second, the application of multilevel analysis to account for individual and community-level contributors to children's dietary diversity. In Ethiopia due to religious or societal reasons, animal-source foods are commonly consumed during feast days, holidays and on special occasions or avoided during the fasting period(Reference Haileselassie, Redae and Berhe35). We do not know whether the data were collected on a representative day, and the data collection period could have resulted in misclassification bias. The data collection period coincided with the longest religious fasting period, which may have resulted in an underestimation of animal-source food consumption, and as a result, a low dietary diversity score.
In conclusion, a suboptimal level of dietary diversity has been observed among Ethiopian children aged 6–23 months. This low dietary diversity is more prevalent in rural children and children from low-income families. The present study also found that individual and community-level factors such as a child's age, frequency of radio listening, residence and household wealth status influence children's dietary diversity. Nutrition programmes promoting dietary diversity should be implemented throughout the country, particularly for those from low-income families living in rural areas, in collaboration with health workers and/or the media. Furthermore, reinforcing optimal feeding practices through nutrition education provided by the healthcare providers will assist parents and other caregivers in providing a more diverse diet for their children. Further studies should assess community and individual-level determinants of adequate minimum dietary diversity using representative data.
Acknowledgements
We would like to show gratitude to the DHS program for making the data freely available.
The authors’ roles were as follows: B. G. S., T. A., B. R. J. and N. W. were conceptualised and designed the study. B. G. S. and H. Y. H. were checked the data and performed the analysis; and all authors wrote and corrected the paper, as well as read and approved the final manuscript.
The authors declare that there is no conflict of interest.
Data that support the findings of this study are available from the DHS program.


 Open access