

In our daily life, we frequently face conflicts in decision making between a small but immediate reward (SIR), such as eating high-cholesterol cheesecake, and a large but delayed reward (LDR), such as having a healthy body shape. The rational choice is simple, which is to choose LDR over SIR. However, in reality we find it difficult to resist SIR, because in our mind the present value of LDR is significantly reduced because of the delay in time. Kirby and Marakovic (Reference Kirby and Maraković1995) coined this phenomenon as “delay discounting”, which refers to the reduction in the present value of a future reward as a function of the delay to that reward. The consequence of the lack of delay discounting can be devastating, as individuals who prefer SIR are more likely to perform worse in scholastic tests (Mischel, Shoda, & Rodriguez, Reference Mischel, Shoda and Rodriguez1989), have more impulsive behaviors (Richards, Zhang, Mitchell, & Wit, Reference Richards, Zhang, Mitchell and Wit1999), and suffer misconducts such as gambling (Alessi & Petry, Reference Alessi and Petry2003), cigarette smoking (Bickel, Odum, & Madden, Reference Bickel, Odum and Madden1999), alcohol consumption (Vuchinich & Simpson, Reference Vuchinich and Simpson1998), substance abuse (Bickel & Marsch, Reference Bickel and Marsch2001; Madden, Petry, Badger, & Bickel, Reference Madden, Petry, Badger and Bickel1997; Petry, Reference Petry2002, Reference Petry2003; Petry & Casarella, Reference Petry and Casarella1999), and mental illness (Allen, Moeller, Rhoades, & Cherek, Reference Allen, Moeller, Rhoades and Cherek1998; Crean, de Wit, & Richards, Reference Crean, de Wit and Richards2000). Here in this study, we examined the neuroanatomical correlates of delay discounting, which may shed light on its underlying mechanism.
A great number of studies have been conducted to study the neural correlates of delay discounting from neurophysiological (Kalenscher, Windmann, Diekamp, Rose, & Colombo, Reference Kalenscher, Windmann, Diekamp, Rose and Colombo2005; Montague & Berns, Reference Montague and Berns2002), neuropsychological (Cardinal, Pennicott, Lakmali, Robbins, & Everitt, Reference Cardinal, Pennicott, Lakmali, Robbins and Everitt2001; Sellitto, Ciaramelli, & di Pellegrino, Reference Sellitto, Ciaramelli and di Pellegrino2010), and neuroimaging perspectives (brain structure: Bjork, Momenan, & Hommer, Reference Bjork, Momenan and Hommer2009; Yu, Reference Yu2012; brain function: Casey et al., Reference Casey, Somerville, Gotlib, Ayduk, Franklin, Askren and Teslovich2011; Shamosh et al., Reference Shamosh, DeYoung, Green, Reis, Johnson, Conway and Gray2008; brain connectivity: Christakou, Brammer, & Rubia, Reference Christakou, Brammer and Rubia2011; Peters & Büchel, Reference Peters and Büchel2010). These studies have identified that multiple regions are involved in delay discounting, such as the hippocampus (Bar, Reference Bar2009; van der Meer, Johnson, Schmitzer-Torbert, & Redish, Reference van der Meer, Johnson, Schmitzer-Torbert and Redish2010), the medial prefrontal cortex (Kable & Glimcher, Reference Kable and Glimcher2007; Luhmann, Chun, Yi, Lee, & Wang, Reference Luhmann, Chun, Yi, Lee and Wang2008; McClure, Ericson, Laibson, Loewenstein, & Cohen, Reference McClure, Ericson, Laibson, Loewenstein and Cohen2007; McClure, Laibson, Loewenstein, & Cohen, Reference McClure, Laibson, Loewenstein and Cohen2004; Peters & Büchel, Reference Peters and Büchel2009; Weber & Huettel, Reference Weber and Huettel2008), the orbitofrontal cortex (OFC; Myerson, Green, Scott Hanson, Holt, & Estle, Reference Myerson, Green, Scott Hanson, Holt and Estle2003; Roesch, Taylor, & Schoenbaum, Reference Roesch, Taylor and Schoenbaum2006), the anterior cingulate cortex (ACC; Hoffman et al., Reference Hoffman, Schwartz, Huckans, McFarland, Meiri, Stevens and Mitchell2008; Marco-Pallarés, Mohammadi, Samii, & Münte, Reference Marco-Pallarés, Mohammadi, Samii and Münte2010; McClure et al., Reference McClure, Ericson, Laibson, Loewenstein and Cohen2007; Pine et al., Reference Pine, Seymour, Roiser, Bossaerts, Friston, Curran and Dolan2009), the posterior cingulate cortex (Ballard & Knutson, Reference Ballard and Knutson2009; Kable & Glimcher, Reference Kable and Glimcher2007; Luhmann et al., Reference Luhmann, Chun, Yi, Lee and Wang2008; McClure et al., Reference McClure, Ericson, Laibson, Loewenstein and Cohen2007; McClure et al., Reference McClure, Laibson, Loewenstein and Cohen2004; Peters & Büchel, Reference Peters and Büchel2009; Weber & Huettel, Reference Weber and Huettel2008), the ventral striatum (Ballard & Knutson, Reference Ballard and Knutson2009; Kable & Glimcher, Reference Kable and Glimcher2007; Luhmann et al., Reference Luhmann, Chun, Yi, Lee and Wang2008; McClure et al., Reference McClure, Ericson, Laibson, Loewenstein and Cohen2007; McClure et al., Reference McClure, Laibson, Loewenstein and Cohen2004; Peters & Büchel, Reference Peters and Büchel2009; Weber & Huettel, Reference Weber and Huettel2008; Wittmann, Leland, & Paulus, Reference Wittmann, Leland and Paulus2007), and the dorsolateral prefrontal cortex (Leon & Shadlen, Reference Leon and Shadlen1999; Roesch & Olson, Reference Roesch and Olson2003; Schultz, Tremblay, & Hollerman, Reference Schultz, Tremblay and Hollerman2000; Tanaka et al., Reference Tanaka, Doya, Okada, Ueda, Okamoto and Yamawaki2004; Tsujimoto & Sawaguchi, Reference Tsujimoto and Sawaguchi2005; Wallis & Miller, Reference Wallis and Miller2003). Specifically, the ACC and OFC are the two classic brain regions that are involved in delay discounting. The OFC is involved in delay discounting via representing the incentive value of rewards (Peters & Büchel, Reference Peters and Büchel2011), whereas the ACC is involved in delay discounting via conflict monitoring and strategy adaptation (Hoffman et al., Reference Hoffman, Schwartz, Huckans, McFarland, Meiri, Stevens and Mitchell2008; Marco-Pallarés et al., Reference Marco-Pallarés, Mohammadi, Samii and Münte2010; Pine et al., Reference Pine, Seymour, Roiser, Bossaerts, Friston, Curran and Dolan2009).
Most of these studies have focused on the functionality of these regions in delay discounting, and only three studies have explored the neuroanatomy (Bjork et al., Reference Bjork, Momenan and Hommer2009; Cho et al., Reference Cho, Pellecchia, Aminian, Ray, Segura, Obeso and Strafella2013; Yu, Reference Yu2012) that is the basis of the functionality. However, the findings from these three studies are not consistent. Bjork et al. (Reference Bjork, Momenan and Hommer2009) used a region of interest approach and found greater discounting of delayed rewards was correlated with a small cluster of the inferolateral frontal cortex and the dorsolateral frontal cortex, whereas with a whole-brain, voxel-based analysis approach, Yu (Reference Yu2012) and Cho et al. (Reference Cho, Pellecchia, Aminian, Ray, Segura, Obeso and Strafella2013) failed to find any neuroanatomical correlates in the gray matter. The inconsistency possibly resulted from the lack of sufficient power to detect the neuroanatomical correlates. For example, Yu’s study (Reference Yu2012) reported several gray matter volumes (GMV) correlated with delay discounting, but the correlation did not reach significance after whole-brain correction. Cho et al. (Reference Cho, Pellecchia, Aminian, Ray, Segura, Obeso and Strafella2013) relied on small volume correction to identify the association between the GMV of the ACC and the OFC and delay discounting. This may explain why Bjork et al. (Reference Bjork, Momenan and Hommer2009) chose to focus on a small portion of the brain (i.e., the frontal cortex), but this approach provides incomplete information for the relation between neuroanatomy and functionality in delay discounting in the whole brain.
To reveal the neuroanatomical correlates of delay discounting across the whole brain, here we measured the degree of delay discounting of a larger sample of participants (N = 325), and then used the individual difference approach to correlate the behavioral performance with GMV across the whole brain to identify the neuroanatomical correlates of delay discounting.
Materials and Methods
Participants
We used G*Power to estimate the sample size needed in the present study (Faul, Erdfelder, Buchner, & Lang, Reference Faul, Erdfelder, Buchner and Lang2009). Assuming small-to-moderate effect sizes (i.e., r = .1, p = .001), based on the literature (Li et al., Reference Li, De Beuckelaer, Guo, Ma, Xu and Liu2014), and setting power at 0.8, a sample size of 224 people was suggested. Because multiple corrections are required for a whole-brain analysis in magnetic resonance imaging (MRI) studies, in this study we thus recruited 325 college students from Beijing Normal University, Beijing, China. Participants reported no psychiatric illness, hearing impairment, or neurological disorders (e.g., epilepsy, traumatic brain injury, neurodegenerative disorders, or cerebrovascular disease). This study was approved by the Institutional Review Board of Beijing Normal University. Prior to the experiment, written informed consent was obtained from all participants.
Assessment of delay discounting
The degree of delay discounting was assessed with the Monetary Choice Questionnaire (MCQ; Kirby, Petry, & Bickel, Reference Kirby, Petry and Bickel1999). The MCQ is a self-report measure that consists of a set of 27 choices between pairs of two monetary rewards – one small but immediate reward (SIR) and one large but delayed reward (LDR), such as “Would you prefer ¥55 today or ¥75 in 61 days?”, and the participants indicated their preferred reward. In the questionnaire, the SIRs ranged from ¥11 to ¥80, whereas the LDRs ranged from ¥25 to ¥85, with delays ranging from 1 week to 6 months.
Each participant completed his/her own questionnaire separately. To ensure the participants made choices based on their genuine preference, besides the monetary compensation for the experiment, they also received the reward based on their choice randomly selected among 27 choices of the completed questionnaire. There was no time limit for finishing the MCQ.
The degree of delay discounting, also coined as a k value, shows the steepness of the reduction in present value as a function of delay in time (Kirby et al., Reference Kirby, Petry and Bickel1999). The larger the k value, the steeper the reduction, and the more likely that the participants choose SIRs over LDRs. In other words, a larger k value indicates stronger preference for SIR and thus more impulsiveness in decision making.
The k values were calculated with a standardized procedure of the MCQ (Kirby, Reference Kirby2009; Kirby et al., Reference Kirby, Petry and Bickel1999). There are 10 k values in the MCQ, ranging from 0.00016 to 0.25, and each k value is associated with a choice pattern. Each participant’s choice pattern was matched to the 10 patterns accordingly, and a k value whose pattern showed the highest consistency to the participant’s was the k value indicating this participant’s degree of delay discounting. Note that if a participant’s highest consistency was lower than 85%, the match was considered not successful, and the participant was then excluded from further analyses. Four participants did not satisfy this criterion. Finally, the k values were log-transformed (Ln(k), natural log transformation) to approximate a normal distribution.
MRI acquisition
Participants were scanned using a Siemens 3T-scanner (MAGENTOM Trio, a Tim system) with a 12-channel phased-array head coil at BNU Imaging Center for Brain Research, Beijing, China. Magnetic resonance (MR) structural images were acquired using a 3D magnetization-prepared rapid gradient-echo (MP-RAGE) T1-weighted sequence (TR/TE/TI = 2530/3.39/1100 ms, flip angle = 7 degrees, FOV = 256 × 256 mm). To cover the whole brain, 128 contiguous sagittal slices were acquired with 1 × 1 mm in-plane resolution and a 1.33-mm slab thickness.
Image processing for VBM
VBM was used to explore the neuroanatomical correlates of delay discounting. VBM provides a quantitative measure of tissue volume for each voxel (Ashburner & Friston, Reference Ashburner and Friston2000), which was performed using SPM8 (Statistical Parametric Mapping, Wellcome Department of Imaging Neuroscience, London, UK), with an optimized VBM protocol (Good et al., Reference Good, Johnsrude, Ashburner, Henson, Friston and Frackowiak2001) on T1-weighted structural images. First, the quality of structural images was assessed manually by visual inspection. Six participants were removed from further analyses because of extraordinary scanner artifacts (e.g., head movement during MRI scanning) or abnormal brain structure (e.g., unusually large ventricles). Second, the brain origin for each participant was manually set to the anterior commissure. Third, using a unified segmentation approach, four distinct tissue classes: gray matter (GM), white matter, cerebrospinal fluid, and everything else (e.g., skull and scalp) were segmented from the structural images (Ashburner & Friston, Reference Ashburner and Friston2005). Fourth, the GM images were spatially normalized to the Montreal Neurological Institute (MNI) 152 space using the Diffeomorphic Anatomical Registration through Exponential Lie algebra (DARTEL) registration method (Ashburner, Reference Ashburner2007). DARTEL registration involves repetitively computing the study-specific template and warping the GM images to the generated template. Fifth, to preserve the original gray matter volume (GMV) for each participant, the normalized individual GM images were modulated by multiplying each voxel’s GM value with the voxel-specific Jacobian determinants derived from the spatial normalization. The modulated GM images, depicting a GMV measure for each voxel, were then smoothed using an 8-mm, full-width at half-maximum (FWHM) isotropic Gaussian kernel. Finally, the modulated GM images were masked using an absolute masking with a threshold of 0.2. That is, all voxels with a GMV value less than 0.2 were excluded. The masked-modulated GM images were further examined with a statistical analysis.
Statistical analysis
A whole-brain GMV analysis was performed to explore neuroanatomical correlates of delay discounting. Because four participants were excluded in the behavioral assessment on delay discounting and six participants showed unsatisfied MR image quality, 315 participants (96.9% of the total participant population) were included in this analysis (169 females, 18–25 years of age, mean age = 21.85 years, SD = 0.99). Voxel by voxel, a generalized linear model (GLM) was performed using the GMV extracted from the GM images as the dependent variable, with the Ln(k) values as the covariate of interest. Given that the modulated GM images contained variations in brain size, we took the total GMV as a confounding covariate in the statistical model. In addition, gender difference in GMV has been reported (e.g., Luders, Gaser, Narr, & Toga, Reference Luders, Gaser, Narr and Toga2009); therefore, gender was also included as a confounding covariate. The whole-brain correction (WBC) for multiple comparisons was performed by setting the voxel-wise intensity threshold at p < .001 and a cluster-level threshold determined by the AlphaSim program in AFNI with Monte Carlo simulations (Ward, Reference Ward2000).
Results
Participants’ Ln(k) values were used as an index for the degree of their delay discounting, with a higher Ln(k) value indicating greater discount of future values and thus stronger preference for SIRs. The kurtosis (-0.07) and skewness (-0.09) of the Ln(k) values indicated the normality of the data (Marcoulides & Hershberger, Reference Marcoulides and Hershberger1997). The mean of the Ln(k) values is -5.16 and the standard deviation is 1.43, suggesting a significant amount of individual differences.
To explore the neuroanatomical correlates of delay discounting, we correlated the GMV of each voxel across the whole brain with the Ln(k) value of each participant. We found that the Ln(k) value was negatively correlated with the GMV of a cluster in the left orbitofrontal cortex (OFC; MNI coordinate: 53,68,23; cluster size: 227; p < .001, WBC; Table 1, Figure 1). Moreover, similar to the left OFC, we also found that the Ln(k) value was negatively correlated with the GMV of a cluster in the right OFC (MNI coordinate: 36,67,23; cluster size: 100; uncorrected; Table 1, Figure 2), but the significance level did not surpass the strict probability levels determined by the WBC for multiple comparisons. One possibility of the trend observed in the right OFC might come from correlation transmissibility because the left OFC’s GMV was highly correlated with the right OFC (r = .74, p < .001). To rule out this possibility, a partial correlation analysis was performed between the right OFC and the Ln(k) value after controlling for the left OFC’s GMV. The correlation coefficient at the peak voxel of the right OFC was reduced from -.22 (p < .001) to -.12 (p = .04), but the correlation was still significant. Therefore, the correlation between the right OFC’s GMV and the Ln(k) value was not completely derived from the association observed in the left OFC. In short, participants with a larger OFC’s GMV may discount the future value less steeply, and thus prefer to choose LDRs.
Table 1. Clusters of voxels correlated with delay discounting

Note: MNI = Montreal Neurological Institute.
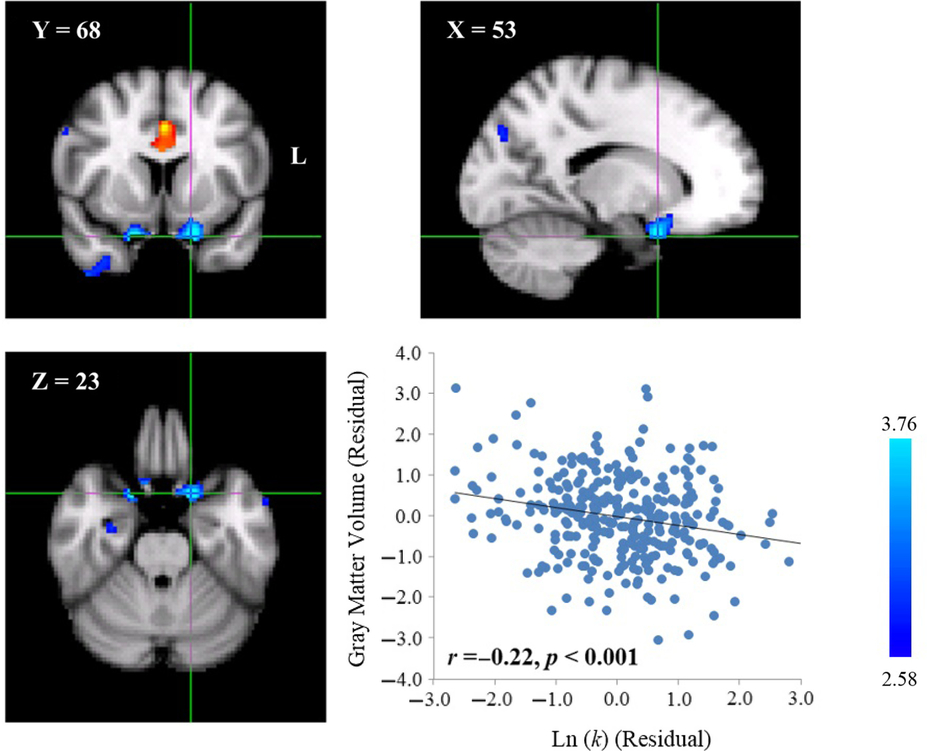
Fig 1. Neuroanatomical correlates of delay discounting in the left OFC. A cluster with a negative correlation between GMV and the Ln(k) value was found in the left OFC (MNI coordinate: 53,68,23; cluster size: 227; p < .001, WBC) in the MNI space. The scatter plot between the distributions of the Ln(k) value and GMV in the peak voxel of the cluster after controlling for gender and total GMV is shown for display purposes. Each dot represents one participant.
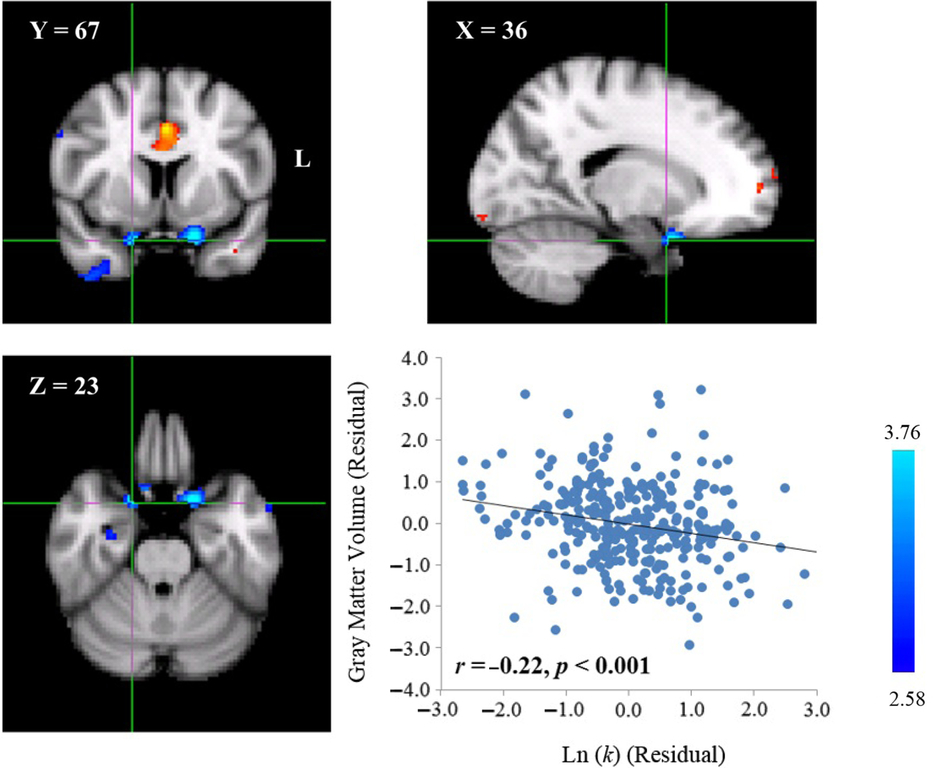
Fig. 2. Neuroanatomical correlates of delay discounting in the right OFC. A cluster with a negative correlation between GMV and the Ln(k) value was found in the right OFC (MNI coordinate: 36,67,23; cluster size: 100; uncorrected). The scatter plot is shown for display purpose. Each dot represents one participant.
In contrast, the Ln(k) value was positively correlated with the GMV of a cluster in the ACC (MNI coordinate: 46, 67, 55; cluster size: 338; p < .001, WBC; Table 1, Figure 3). That is, participants with larger ACC’s GMV likely discounted the future value more steeply, and therefore may chose SIRs.
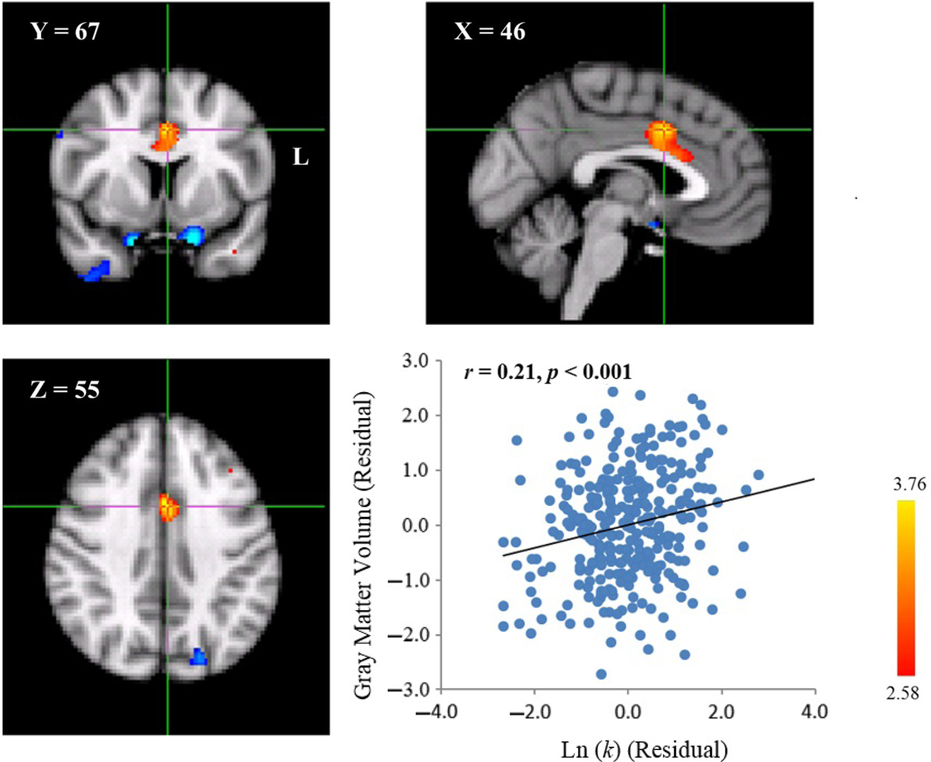
Fig. 3. Neuroanatomical correlates of delay discounting in the ACC. A cluster with a positive correlation between GMV and the Ln(k) value was found in the ACC (MNI coordinate: 46, 67, 55; cluster size: 338; p < .001, WBC) in the MNI space. A scatter plot between the distributions of the Ln(k) value and GMV in the peak voxel of the cluster after controlling for gender and total GMV is shown for display purpose. Each dot represents one participant.
In summary, three brain regions have been found to be associated with delay discounting in this study: the ACC, the left OFC and the right OFC (Table 1). Here, we further asked how these three brain regions were related to delay discounting. Did they independently contribute to delay discounting, and how much did individual differences of these three regions explain individual differences of delay discounting? To answer these questions, we performed a stepwise multiple regression analysis, where the Ln(k) value of each participant was an independent variable and five factors as dependent variables. To avoid the bias in signal-to-noise ratio when calculating mean GMVs from different cluster sizes, we used the peak voxel of a cluster to represent this cluster. These five dependent variables were gender, the total GMV, the GMV of the peak voxel of the ACC, and the left and right OFC. The stepwise regression analysis showed that four variables were left in the regression model, F(4, 310) = 10.80, 95% CI [0.15, 0.59], p < .0001, Cohen’s d = 0.37: gender and the GMV of the peak voxel of the three clusters (Table 2), suggesting that these three regions contributed to delay discounting relatively independently. In total, these four variables explained 12.2% of the total variation of the Ln(k) value.
Table 2. The variables explained the individual differences in delay discounting

Discussion
In the present study, we used the individual difference approach to investigate the neuroanatomical correlates of delay discounting across the whole brain. First, we found negative correlations of the left and right OFC’s GMV with the Ln(k) value, suggesting that individuals with larger OFC’s GMV discounted the future value less steeply, and are more likely to choose LDR over SIR. Second, we found a significant positive correlation of ACC’s GMV with the Ln(k) value, suggesting that individuals with a larger GMV in the ACC discounted the future value more steeply, and may prefer SIR. Third, a stepwise regression analysis showed that these three regions contributed to delay discounting relatively independently, which in total explained 12.2% variance of delay discounting along with gender. A great number of neuroimaging studies have shown that both the ACC and the OFC are activated when participants perform tasks on delay discounting (e.g., Peters & Büchel, Reference Peters and Büchel2011). Our study complements these findings by demonstrating that the brain structure of the OFC and the ACC was also related to participants’ performance in delay discounting.
The finding that larger OFC’s GMV was associated with the preference to LDRs is consistent with previous studies. In neuropsychological studies, the lesion of the OFC in both humans (Berlin, Rolls, & Kischka, Reference Berlin, Rolls and Kischka2004; Sellitto et al., Reference Sellitto, Ciaramelli and di Pellegrino2010) and animals (Mobini et al., Reference Mobini, Body, Ho, Bradshaw, Szabadi, Deakin and Anderson2002; Rudebeck, Walton, Smyth, Bannerman, & Rushworth, Reference Rudebeck, Walton, Smyth, Bannerman and Rushworth2006) leads to steep discounting of future values and strongly prefers SIRs. In addition, a neuroimaging study reveals that the weaker the activation of the bilateral OFC is, the more likely that individuals choose SIRs (Boettiger et al., Reference Boettiger, Mitchell, Tavares, Robertson, Joslyn, D’Esposito and Fields2007). Our finding provides a possible interpretation on these studies because smaller OFC’s GMV suggests a smaller number or a smaller body size of neurons in the OFC. As a result, the OFC was unable to generate sufficient neural activation to serve its role properly as a part of the cool system (Metcalfe & Mischel, Reference Metcalfe and Mischel1999) that represents the incentive value of rewards (Chib, Rangel, Shimojo, & O’Doherty, Reference Chib, Rangel, Shimojo and O’Doherty2009; Kable & Glimcher, Reference Kable and Glimcher2009; Kringelbach & Rolls, Reference Kringelbach and Rolls2004; Peters & Büchel, Reference Peters and Büchel2010) and engages cognitive control to suppress impulsivity.
In contrast, as a part of the hot system (Metcalfe & Mischel, Reference Metcalfe and Mischel1999), the ACC is located in the limbic system. The limbic system, which is a core region in representing rewards (Gregorios-Pippas, Tobler, & Schultz, Reference Gregorios-Pippas, Tobler and Schultz2009) and pleasure (Haines & Ard, Reference Haines and Ard2006), has a great preference for instant gratification. Therefore, it is not surprising that individuals with larger ACC’s GMV prefer SIRs. Besides, the ACC is thought to be involved in delay discounting through conflict monitoring and strategy adaptation (Peters & Büchel, Reference Peters and Büchel2011). Indeed, the degree of decision conflicts is found to be correlated with the neural activation of the ACC, with higher activation for a harder decision (Hoffman et al., Reference Hoffman, Schwartz, Huckans, McFarland, Meiri, Stevens and Mitchell2008; Marco-Pallarés et al., Reference Marco-Pallarés, Mohammadi, Samii and Münte2010; Pine et al., Reference Pine, Seymour, Roiser, Bossaerts, Friston, Curran and Dolan2009). That is, for the same conflict between SIR and LDR, individuals with larger ACC’s GMV may consider the conflict more severe, which requires more resources to solve the conflict. Therefore, they may choose the SIR that consumes less amount of resources, which finally leads to a steep reduction in future values.
In sum, we demonstrated the neuroanatomical correlates of the OFC and the ACC in delay discounting. This finding relied heavily on a large number of participants because the correlation between the GMV of these two regions and the behavioral performance in delay discounting was moderate. Indeed, previous efforts with a whole-brain analysis in establishing such a relationship apparently suffered insufficient statistical power (Cho et al., Reference Cho, Pellecchia, Aminian, Ray, Segura, Obeso and Strafella2013; Yu, Reference Yu2012). For example, 112 participants in Yu’s (Reference Yu2012) and 36 participants in Cho et al.’s (Reference Cho, Pellecchia, Aminian, Ray, Segura, Obeso and Strafella2013) studies were much smaller than the number of participants suggested by the power analysis. Therefore, future studies in establishing neuroanatomical correlates may need a large number of participants or data gathered from multiple studies. Second, we also suggested the division of labor of these two regions, as their correlation to delay discounting is in the opposite direction. That is, the OFC is in the prefrontal cortex, which belongs to the cool system, whereas the ACC is a part of limbic system, which is the core of the hot system. Therefore, our finding fits nicely with the hot versus cool system, with the ACC competing for SIRs and the OFC suppressing impulsive behaviors with cognitive control (Hirsh, Guindon, Morisano, & Peterson, Reference Hirsh, Guindon, Morisano and Peterson2010). Future studies are needed to elucidate the role of the hot versus cool system in delay discounting on how a balanced hot and cool system leads to an optimal choice between presence and the future.
Acknowledgements
We thank Zonglei Zhen, Lijie Huang, Xiangzhen Kong, and Xu Wang for technical supports on data analyses.


 Open access