


1. Introduction
Objective numeracy—called numeracy throughout the rest of this article—refers to the ability to understand and use numeric information (Peters et al., Reference Peters, Västfjäll, Slovic, Mertz, Mazzocco and Dickert2006; Peters and Bjälkebring, Reference Peters and Bjälkebring2015; Reyna et al., Reference Reyna, Nelson, Han and Dieckmann2009; Steen, Reference Steen1990). With lower levels of numeracy, people can complete basic mathematical processes such as counting, sorting, basic arithmetic, and understanding simple percentages (Peters, Reference Peters2020). Greater numeracy is required for the successful completion of unfamiliar or less explicit numeric tasks, data interpretation, and problems involving multiple steps. As reviewed below, studies have linked these numeric abilities to decision-making and life outcomes, making it important to assess numeracy well. Overall, effective measures should 1) avoid ceiling and floor effects by including a broad range of easy and difficult items, 2) provide a more fine-grained, precise numeracy assessment along the full difficulty continuum of interest without gaps; 3) be brief for time efficiency, and 4) have novel, unfamiliar items to reduce memory and learning effects. The use of item response theory (IRT), in particular, then can maximize the information from each item, thus creating briefer scales that will save time for researchers and participants. Finally, any new measure should demonstrate predictive validity similar to or better than existing measures. In this article, we develop and fully test 3 new numeracy measures: an adaptive measure, a 4-item, nonadaptive measure, and a single-item measure.
2. Numeric abilities are linked with better decision-making
Being numerate is important for effective decision-making (Peters, Reference Peters2020). Even everyday problem-solving like weighing numerical information, using statistical information in text and figures, comprehending risk, and weighing numerical information in decisions all require some numeric proficiency (Peters et al., Reference Peters, Västfjäll, Slovic, Mertz, Mazzocco and Dickert2006). Despite its importance, the Organization for Economic Cooperation and Development estimated that 29% of U.S. adults are able to do only simple processes with numbers like counting and sorting; they cannot perform math involving 2 or more steps and are unable to understand and use percentages, fractions, simple measurements, and figures (Desjardins et al., Reference Desjardins, Thorn, Schleicher, Quintini, Pellizzari, Kis and Chung2013). For example, among people with diabetes, less numerate people were worse at identifying abnormally high or low blood glucose levels and managing their health as measured by their levels of hemoglobin A1c (Cavanaugh et al., Reference Cavanaugh, Huizinga, Wallston, Gebretsadik, Shintani, Davis, Gregory, Fuchs, Malone and Cherrington2008; Zikmund-Fisher et al., Reference Zikmund-Fisher, Exe and Witteman2014). Furthermore, experimentally improving numeracy protected healthy behaviors and financial literacy of college students across a semester (Peters et al., Reference Peters, Shoots-Reinhard, Tompkins, Schley, Meilleur, Sinayev, Tusler, Wagner and Crocker2017) and produced greater consistency of risk perceptions in an online sample (Chesney et al., Reference Chesney, Shoots-Reinhard and Peters2021).
Numerous reasons likely exist for better outcomes among the highly numerate. People higher in numeracy are more likely to understand and respond consistently to numeric information (Del Missier et al., Reference Del Missier, Mäntylä and de Bruin2012; McAuliffe et al., Reference McAuliffe, DiFranceisco and Reed2010; Sinayev and Peters, Reference Sinayev and Peters2015; Woloshin et al., Reference Woloshin, Schwartz, Moncur, Gabriel and Tosteson2001). They also have more precise emotional responses to numbers that appear to allow them to use numbers more in judgments (Peters et al., Reference Peters, Västfjäll, Slovic, Mertz, Mazzocco and Dickert2006; Västfjäll et al., Reference Västfjäll, Slovic, Burns, Erlandsson, Koppel, Asutay and Tinghög2016). People higher in numeracy also perform more mathematical operations in judgments and decisions that may help them ascertain the meaning of numbers for their decisions (Peters and Bjälkebring, Reference Peters and Bjälkebring2015). In contrast, less numerate people tend to rely more on qualitative information (e.g., anecdotes, emotions incidental to a decision, and heuristics; Burns et al., Reference Burns, Peters and Slovic2012; Dieckmann et al., Reference Dieckmann, Slovic and Peters2009; Hart, Reference Hart2013; Peters et al., Reference Peters, Dieckmann, Västfjäll, Mertz, Slovic and Hibbard2009). For example, less numerate individuals are more susceptible to attribute-framing effects (e.g., the difference in ratings of meats marked 75% lean vs. 25% fatty; Peters et al., Reference Peters, Västfjäll, Slovic, Mertz, Mazzocco and Dickert2006). Finally, more numerate people use more and more complex information in judgments and decisions involving quantities compared with the less numerate (Pachur and Galesic, Reference Pachur and Galesic2013; Peters and Levin, Reference Peters and Levin2008). In the present validation study, we used tasks focused on comprehension and judgments involving numeric information to test the predictive validity of our numeracy measures. As in many of the previous studies, we also adjust for other forms of intelligence given that numeracy correlates with them. Of course, none of the scales measure with perfect reliability or validity, making this attempt imperfect. Nonetheless, tests of specific abilities are useful.
3. Measures of numeracy
Several scales exist to measure numeracy; however, each scale has distinct problems. First, many measures do not include a sufficient range of difficulty. Some measures include too many easy problems, thus leading to ceiling effects that make it difficult to distinguish among participants higher in ability (e.g., Numeracy Assessment [Schwartz et al., Reference Schwartz, Woloshin, Black and Welch1997] and Numeracy Scale [Lipkus et al., Reference Lipkus, Samsa and Rimer2001]). Another factor affecting existing measures may be familiarity. The cognitive reflection task (CRT) has been widely published (Frederick, Reference Frederick2005), and was expanded to combat familiarity as a result. However, these and other numeracy items have been reused in newer scales, making all of them problematic in terms of the use of familiar items (e.g., Rasch-Based Numeracy Scale; Weller et al., Reference Weller, Dieckmann, Tusler, Mertz, Burns and Peters2013). Other measures are too difficult for many populations (e.g., older adults), which can result in floor effects (Berlin Numeracy Test [BNT; Cokely et al., Reference Cokely, Galesic, Schulz, Ghazal and Garcia-Retamero2012] and cognitive reflection task [CRT; Frederick, Reference Frederick2005; Toplak et al., Reference Toplak, West and Stanovich2014]).
Other measures may be too long to be cost-effective (Expanded Numeracy Scale; Peters et al., Reference Peters, Dieckmann, Dixon, Hibbard and Mertz2007). In this respect, adaptive measures are particularly useful as they focus participants on questions just above, within, and below their ability so that they do not take more time than needed. In general, researchers prefer measures that use less participant time and effort while measuring numeracy in a reliable and valid manner.
One possible solution to these issues is measuring numeracy without a math test (Fagerlin et al., Reference Fagerlin, Zikmund-Fisher, Ubel, Jankovic, Derry and Smith2007). Fagerlin et al. asked participants to self-report their mathematical ability and math preferences and used their combination as a proxy for numeracy. However, Peters and Bjälkebring (Reference Peters and Bjälkebring2015) concluded that this Subjective Numeracy Scale captured a related but separate numeric competency, suggesting that self-assessment of numeric ability cannot replace objective measures of numeracy. Subjective numeracy appears to relate more to motivations to use numeric ability rather than the ability itself (Choma et al., Reference Choma, Sumantry and Hanoch2019; Miron-Shatz et al., Reference Miron-Shatz, Hanoch, Doniger, Omer and Ozanne2014; Peters et al., Reference Peters, Fennema and Tiede2019; Peters and Shoots-Reinhard, Reference Peters and Shoots-Reinhard2022).
An ideal measure would be developed by applying IRT—rather than classical test theory—to a large range of novel items not easily found online. By doing so, one can create short-form measurements that discriminate among wide ranges of ability (Smith et al., Reference Smith, McCarthy and Anderson2000). IRT also produces more consistent item-difficulty parameters across samples and less measurement error relative to classical testing theory (Magno, Reference Magno2009). Where possible, adaptive measures can further reduce retest effects as participants see different question items (Arendasy and Sommer, Reference Arendasy and Sommer2017). Moreover, adaptive testing allows for accurate ability estimates using fewer items and less time (Legree et al., Reference Legree, Fischl, Gade and Wilson1998). Such finer measurement of numeracy is important to improve the understanding of how numeracy relates to decisions and behaviors and how it interacts with other numeric competencies, such as numeric self-efficacy (i.e., numeric confidence; Peters and Bjälkebring, Reference Peters and Bjälkebring2015; Peters et al., Reference Peters, Fennema and Tiede2019). Moreover, more precise measurements may also contribute to understanding how numeracy as a specific ability can improve prediction in tasks involving numbers (i.e., Coyle and Greiff, Reference Coyle and Greiff2021).
4. The current article
The current article introduces a new online adaptive test (A-NUM) and a nonadaptive test of numeracy (4-NUM). The goal of these measures is to assess numeracy effectively while allowing for granular measurement across a meaningful range of abilities. Because researchers are sometimes interested in using as brief a measure as possible, we also explore the feasibility of measuring numeracy with a single item (1-NUM). We present the numeric understanding measures (NUMs) for numeracy developed using IRT and compare their performance with currently used numeracy measures. The hypotheses, methods, and analyses for the validation study were preregistered on the Open Science Framework (OSF; https://osf.io/9tjgz), although not all hypotheses and their tests are reported herein. In particular, associations with Big 5 Personality Measures for discriminant validity can be found in Appendix G of the Supplementary Material. For the data, please visit https://osf.io/kv7cn.
We hypothesized that the new measures would load onto the same latent factor as older numeracy measures. Additionally, we expected that the new measures would be positively associated with subjective numeracy and 2 nonnumeric intelligence measures: Raven’s progressive matrices and vocabulary (Cokely et al., Reference Cokely, Galesic, Schulz, Ghazal and Garcia-Retamero2012; Peters et al., Reference Peters, Baker, Dieckmann, Leon and Collins2010; Peters and Bjälkebring, Reference Peters and Bjälkebring2015). Together, these patterns of association would provide convergent validation. Further, to evaluate predictive validity, we examined common decision-making tasks previously shown to be associated with numeracy. We expected to replicate these numeracy associations for existing measures and the new measures. Specifically, we expected the new measures to predict behavior similarly to established measures regarding probability interpretation and benefit perceptions (as in Cokely et al., Reference Cokely, Galesic, Schulz, Ghazal and Garcia-Retamero2012), attribute-framing effects (as in Peters et al., Reference Peters, Västfjäll, Slovic, Mertz, Mazzocco and Dickert2006), the effect of a small loss on bet attractiveness (as in Peters et al., Reference Peters, Västfjäll, Slovic, Mertz, Mazzocco and Dickert2006; Peters and Bjälkebring, Reference Peters and Bjälkebring2015), and risk consistency (as in Del Missier et al., Reference Del Missier, Mäntylä and de Bruin2012).
Together, support for these hypotheses would indicate the NUMs to be valid. To foreshadow our results, the NUM measures demonstrated good convergent validity; they loaded onto a single factor with established measures and showed patterns of correlations similar to them. The A-NUM demonstrated predictive validity for all tasks that established measures also predicted. The 4-NUM showed similar patterns of predictive power, and the 1-NUM demonstrated predictive power for most tasks despite being comprised of a single item. Unlike established measures, these new measures offer a fresh start of sorts, by using unfamiliar items whose answers are not easily available online.
5. Study 1: Calibration study
5.1. Participants
Due to the large number of new items being calibrated, 2 participant samples were recruited, and each one completed half of the new items. The first sample consisted of 264 participants (53.4% female; $\bar{x}_{age}$
= 40.47; 79.2% Caucasian, 9.5% Asian, 7.2% African American, 6.8% Hispanic), randomly selected from a cohort of about 1,000 Mechanical Turk workers. The second sample was randomly selected from the same cohort (no overlap of participants existed between the 2 samples) and included 226 participants (50.0% female;
$\bar{x}_{age}$
= 40.47; 79.2% Caucasian, 9.5% Asian, 7.2% African American, 6.8% Hispanic), randomly selected from a cohort of about 1,000 Mechanical Turk workers. The second sample was randomly selected from the same cohort (no overlap of participants existed between the 2 samples) and included 226 participants (50.0% female; $\bar{x}_{age}$
= 41.37; 85.0% Caucasian, 6.6% Asian, 4.4% African American, and 6.2% Hispanic).
$\bar{x}_{age}$
= 41.37; 85.0% Caucasian, 6.6% Asian, 4.4% African American, and 6.2% Hispanic).
5.2. Procedures
Following informed consent, each participant was assigned to complete one of the 2 blocks of the total 84 items (42 items each), with each participant responding to only one block. New items were largely generated based on previous scales. After a generation, the authors discussed and refined the items, then sorted them into bins based on perceived difficulty. The authors also attempted to include items from various domains in the final set of items (e.g., medical and financial) and to cover a wide range of math processes (e.g., arithmetic, probability transformation, and cumulative risk). The final set was piloted with research assistants to ensure that they were neither too hard nor too easy and were easy to understand. Each block was designed to contain both easy and hard questions. To ease participants’ burden and prevent a potential uneven dropout of participants with high math anxiety or low numeric self-efficacy, each 42-item block was broken into subblocks of 21 items completed in 2 separate sessions, spaced approximately 7 days apart. Overall, 91.7% and 88.6% of participants returned for the second part of the study in the first and second samples, respectively. The order of the subblocks was counterbalanced to prevent any order effects. All items were open-ended, and only numeric responses were allowed. Some items were modified from previous numeracy scales, and additional new questions were created; none of their answers could be found online. In addition, all participants completed a common question to test if the samples differed in ability. Participants did not significantly differ in terms of their accuracy on this common question, χ 2 (df = 2, N = 490) = 5.14, p = .08.
5.3. Item calibration
The 84 items were calibrated for difficulty and discriminability using a 2-parameter logistic model (2PL) for dichotomous responses (correct vs. incorrect) using FlexMIRT (Cai, Reference Cai2013). A 2-parameter model estimates how well an item discriminates between levels of ability (αi ) and at what level of ability half of the participants are expected to get an item correct (βi ; An and Yung, Reference An and Yung2014). The probability that an examinee at some ability level, θj , will get an item correct is represented by the following equation:
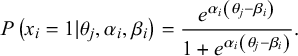 $$\begin{align*}P\left({x}_i = 1|{\theta}_j, {\alpha}_i, {\beta}_i\right) = \frac{{e}^{\alpha_i\left({\theta}_j-{\beta}_i\right)}}{1+{e}^{\alpha_i\left({\theta}_j-{\beta}_i\right)}}.\end{align*}$$
Rather than assuming that the abilities of the participants are perfectly normally distributed, the distribution of ability was empirically estimated using quadratures (De Boeck and Wilson, Reference De Boeck and Wilson2004; Woods, Reference Woods2007). To aid the convergence of the 2PL, discriminabilities were estimated using Bayesian methods. A 3-parameter model is not employed because all responses to the numeracy items were open-ended and none of the responses are commonly guessed values (e.g., 0, 1, 50, and 100).
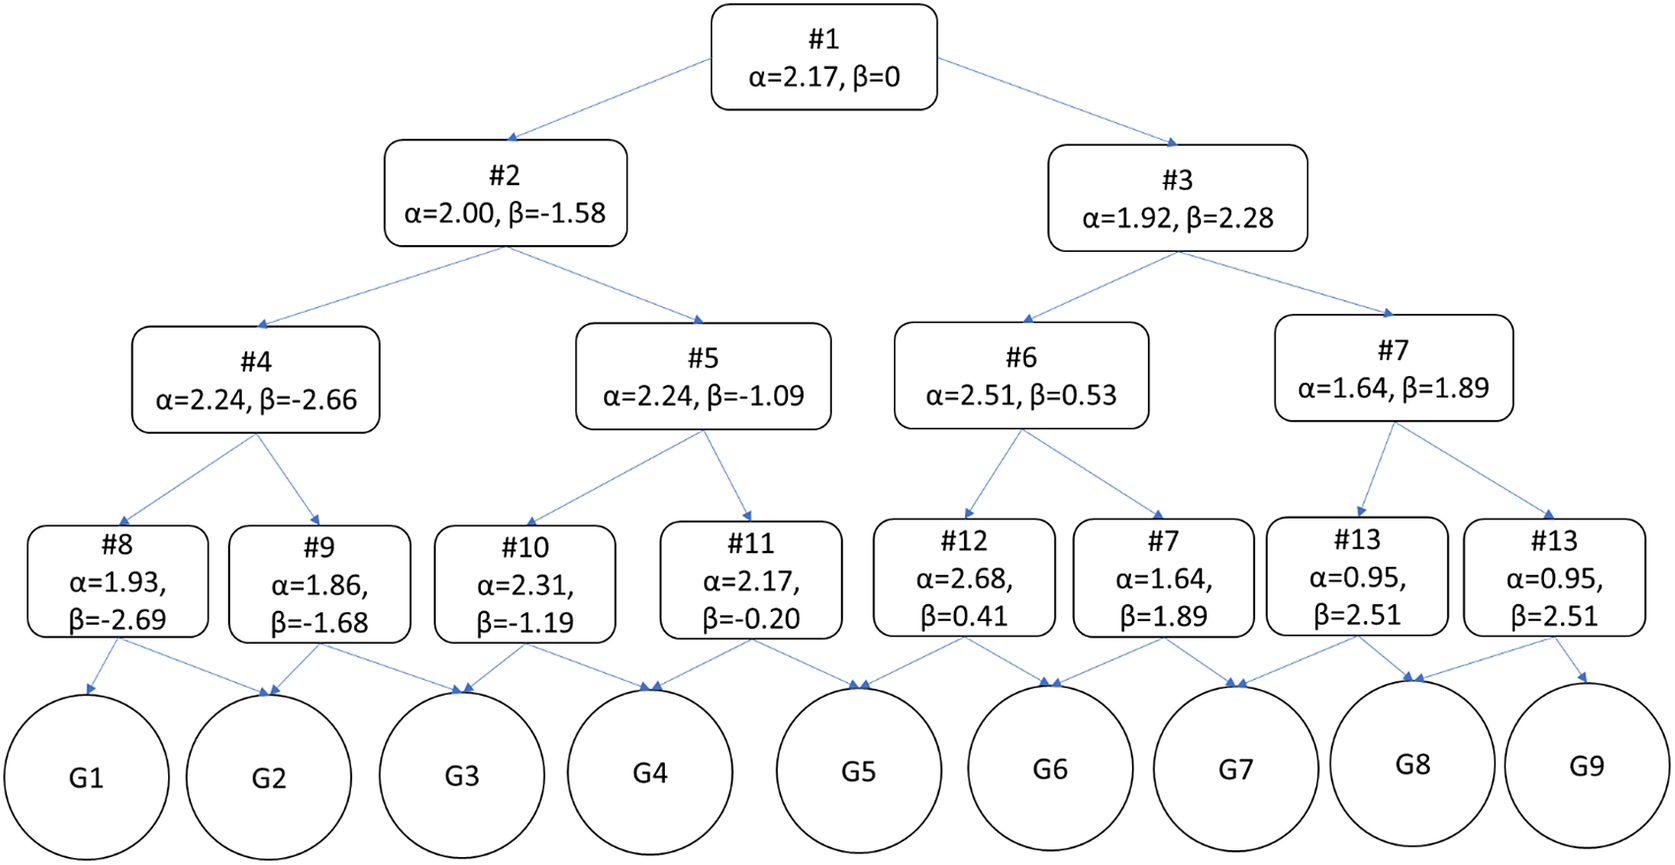
Figure 1 The structure of the adaptive numeric understanding measure with item parameters included (from Study 1; N’s = 224 and 264).
Table 1 Items that compose the adaptive numeric understanding measure in Figure 1’s order
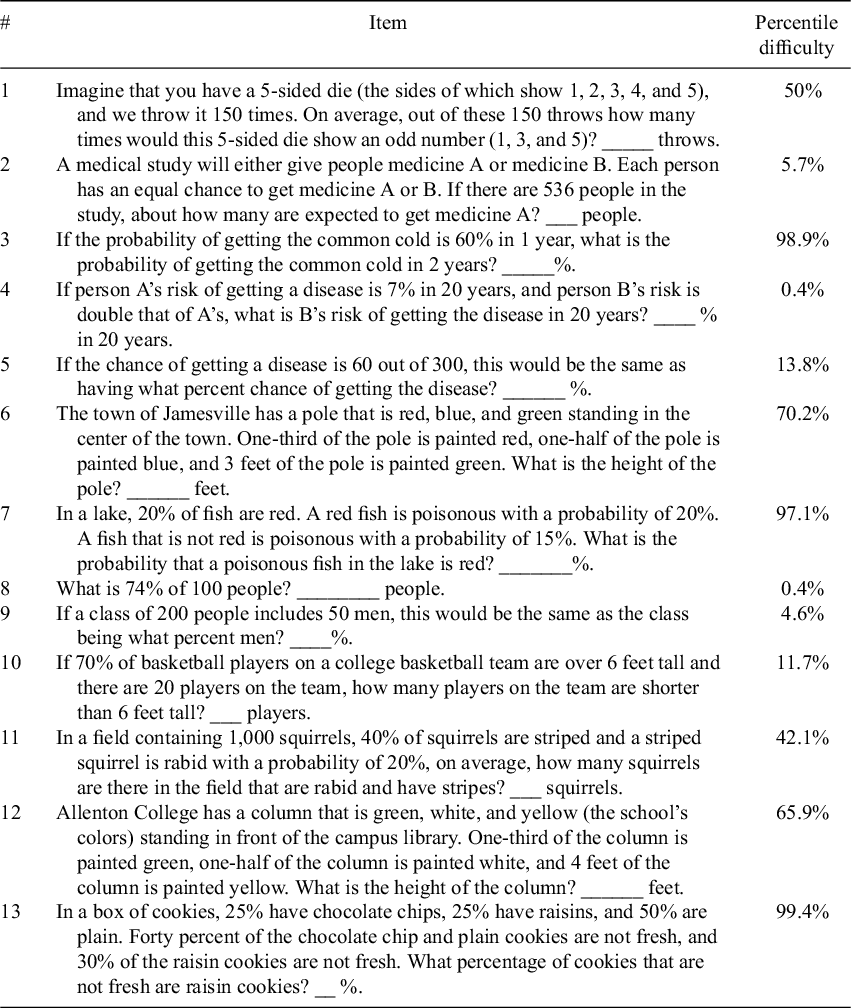
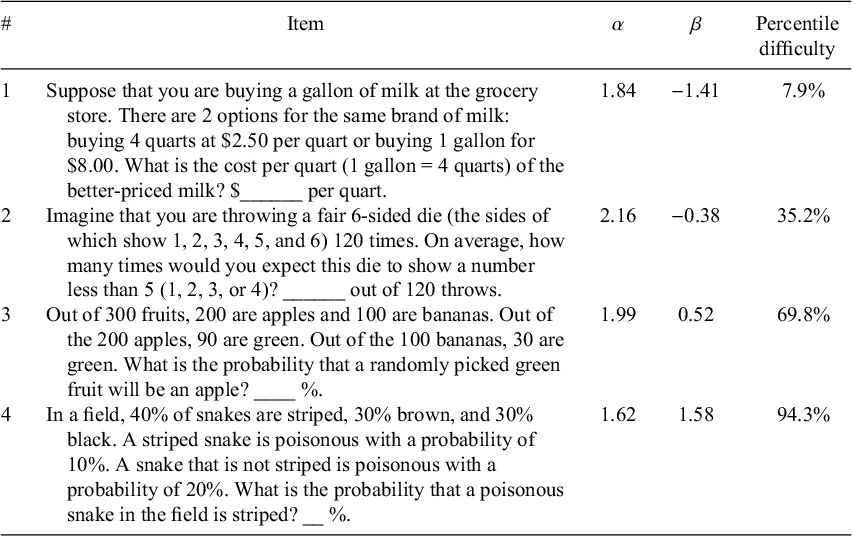
Table 2 The items that compose the 4-item numeracy measure in order of difficulty (easiest to hardest) with item parameters (from Study 1, N’s = 224 and 264)
Within FlexMIRT (Cai, Reference Cai2013), 2 separate 2PLs were estimated with a lognormal prior on the discriminability parameter—one for each sample and set of 42 items. The prior distribution was determined by fitting a 1PL (creating an equality constraint across the items’ discriminability to estimate the average discriminability; i.e., a’s = 1.54 and 1.62), then the mean of the lognormal distribution was set to the log(a) (i.e., means = 0.432 and 0.476) and the standard deviation was set to (log(a × 2) − log(a/2))/4 (i.e., SD’s = 0.347 and 0.347). For the first set of items, 10 items demonstrated a lack of fit with the model and were excluded as potential items (G 2 (df = 177) = 6,175.36, p < .001, RMSEA = .36). For the second set of items, 8 items demonstrated a lack of fit with the model and were excluded (G 2 (df = 138) = 4,842.93, p < .001, RMSEA = .39). Poor item-level goodness of fit suggests that the estimated parameters for a particular item do not accurately capture a plausible data-generating process. This left 66 candidate numeracy items with difficulties ranging from β = −2.69 to β = 4.91 (for all item parameters, see Appendix A of the Supplementary Material).
5.4. Measure construction
5.4.1. Adaptive numeric understanding measure
The adaptive measure was developed from the 66 remaining items and simulated using catR (Magis et al., Reference Magis, Raiche and Magis2018). We assumed the population's numeracies to be distributed normally about average ability (z = 0). For intermittent ability and final estimates, expected a posteriori (EAP) estimates were used; it further used the global discrimination index to select items (Kaplan et al., Reference Kaplan, de la Torre and Barrada2015). The measure began with a fixed item chosen for its average difficulty and high discriminability (α = 2.17, β = 0.00) and ended once the participant had responded to 4 items. Thirteen unique questions comprise the resulting adaptive measure, from which any one test taker would be asked to respond to 4 items (constituting 7 unique exams). This approach categorizes participants into 1 of 9 categories or 16 unique expected a posteriori (EAP) scores. Participants’ ability is calculated as a z-score based on responses to viewed items and the item parameters (range z = −2.57 and z = 2.21; see Figure 1 for measure structure and Table 1 for the items). A simulation was conducted to test whether the setup of the A-NUM (i.e., a measure using the same item parameters, structure, and length) could accurately assess ability. Five thousand thetas were generated from a standard normal distribution. Measure responses were then simulated for all of the thetas using catR (Magis et al., Reference Magis, Raiche and Magis2018); then, the theta estimates (using EAP) were compared with the true thetas. Ability estimates based on simulated responses were highly correlated with the randomly generated abilities (r = .85, p < .001; see Appendix B of the Supplementary Material for further details). There is an alternative scoring method for the A-NUM. Rather than using EAP scores, participants can be sorted into groups, as shown in Figure 1. It categorizes people into 9 levels based on the structure of the measure and the pattern of responses (possible scores range from 1 to 9) This method is similar to the scoring used by the adaptive version of the BNT but sorts participants into more categories. A Qualtrics file (Qualtrics Survey Format) for the A-NUM can be downloaded from OSF (https://osf.io/frq2n). This file can be downloaded and imported to any Qualtrics account for easy use of the adaptive scale.
5.4.2. Four-item nonadaptive numeric understanding measure
We removed the 13 items used in A-NUM from the pool of items so that A-NUM and 4-NUM did not share any items. The remaining candidate items lacked items with difficulties between β = 0.83 and β = 1.89 (approximately the 80th and 97th percentiles, respectively), so previously created and calibrated items modified from BNT items with unpublished answers were also considered. The 4-NUM items chosen from these items were highly discriminating (ranging from α = 1.62 to α = 2.16) and covered a wide range of ability levels with item difficulties ranging between β = −1.41 and β = 1.58 (see Table 2 for the items). Like for the A-NUM, a simulation study was conducted for the 4-NUM to test if the setup of the 4-NUM (i.e., a measure using the same item parameters, structure, and length) could accurately assess ability. Using catIRT (Nydick and Nydick, Reference Nydick and Nydick2013), 5,000 thetas were generated from a standard normal distribution. Measure responses were then simulated for all of the thetas using catIRT (Nydick and Nydick, Reference Nydick and Nydick2013) and the theta estimates (using EAP) were compared with the true thetas. Ability estimates based on simulated responses were highly correlated with the randomly generated abilities (r = .80, p < .001; see Appendix C of the Supplementary Material for simulation details). As an alternative to EAP scores, the 4-NUM can be scored as a sum of correct responses. A Qualtrics file (Qualtrics Survey Format) for the 4-NUM can be downloaded from OSF (https://osf.io/4tk2f). This file can be downloaded and imported to any Qualtrics account for easy use of the adaptive scale.
6. Study 2: Validation
6.1. Participants
Based on power analysis using results from Weller et al. (Reference Weller, Dieckmann, Tusler, Mertz, Burns and Peters2013), 614 MTurk participants were recruited. After our preregistered data cleaning (https://osf.io/9tjgz), 14 participants were excluded from the analyses (all for indicating that they looked up answers or used a calculator), leaving a final N = 600 (47.17% female; $\bar{x}_{age}$
= 41.19; 75.7% Caucasian, 8.2% Asian, 8.5% African American, and 3.2% Hispanic).
$\bar{x}_{age}$
= 41.19; 75.7% Caucasian, 8.2% Asian, 8.5% African American, and 3.2% Hispanic).
6.2. Procedures
After providing consent, participants were randomly assigned to the conditions of 4 decision tasks and completed other measures to test further the predictive, convergent, and divergent validity of the new numeracy measures; random assignment occurred separately for each task. First, they completed either a positively or negatively framed judgment task of students’ grades. Then, they rated the attractiveness of either a bet with no loss or a similar bet with a small loss. Participants further completed a probability interpretation task and a benefit perception task. To assess convergent/discriminant validity, participants were then asked to complete a short Big 5 personality measure and the Subjective Numeracy Scale. Next, participants were asked to complete a risk-consistency task by estimating the probability of 4 events occurring in the next year and then, separately, the probability of the same 4 events in the next 5 years.
In a randomized order, participants then completed the adaptive form of the BNT (Cokely et al., Reference Cokely, Galesic, Schulz, Ghazal and Garcia-Retamero2012), a Rasch-Based Numeracy Scale (Weller et al., Reference Weller, Dieckmann, Tusler, Mertz, Burns and Peters2013), the new 4-item numeracy measure (4-NUM), and the new adaptive numeracy measure (A-NUM). Following the first completed measure, participants were asked about their experience with the numeracy assessment up to that point. Following the 4 numeracy measures, participants completed 2 nonnumeric cognitive measures. Finally, they completed an exploratory mood measure for an unrelated purpose and that is not included in any of the analyses here.
6.3. Measures
6.3.1. Numeracy
Numeracy was assessed using 4 measures. Two established measures were used to test for the convergent validity of our 2 new measures and to evaluate comparative predictive validity. Moreover, the sets of established and new measures each included one nonadaptive measure (i.e., a measure in which all participants complete the same items) and one adaptive measure (i.e., a measure that modifies the items participants see based on previous responses). An additional, single-item measure (i.e., the 1-NUM) was explored to see how well it would perform. Missing responses were counted as incorrect for all numeracy scales.
6.3.2. Weller
Weller et al. (Reference Weller, Dieckmann, Tusler, Mertz, Burns and Peters2013) Rasch-Based Numeracy Scale (Weller) is an 8-item nonadaptive measure assessing numeracy. It was scored as the number of items answered correctly. Possible scores range from 0 to 8.
6.3.3. BNT
The BNT is an adaptive measure assessing numeracy in which each participant responds to 2–3 items (Cokely et al., Reference Cokely, Galesic, Schulz, Ghazal and Garcia-Retamero2012). Based on the structure of the test and the pattern of responses, participants are categorized into 4 quartiles. Possible scores range from 1 to 4.
6.3.4. A-NUM
The adaptive numeric understanding measure (A-NUM) is the new adaptive measure assessing numeracy described above.
6.3.5. 4-NUM
The 4-item numeric understanding measure (4-NUM) is the new nonadaptive measure assessing numeracy described above.
6.3.6. 1-NUM
Lastly, the 1-item numeric understanding measure (1-NUM) is a 1-question measure assessing numeracy; it is the first item of the A-NUM. This item has high discriminability (α = 2.17; λ = .79) and is of average difficulty (β = 0), making it ideal for discriminating between participants above and below average in numeracy. Specifically, the question is, ‘Imagine that you have a 5-sided die (the sides of which show 1, 2, 3, 4, and 5), and we throw it 150 times. On average, out of these 150 throws how many times would this 5-sided die show an odd number (1, 3, and 5)?’ It is scored as correct or not so that the possible scores are 0 or 1. All participants answered this question as part of the A-NUM.
6.3.7. Negative subjective exam experience
Directly following the first numeracy measure, participants were asked, ‘How is your experience of answering the math questions so far?’ Participants indicated their agreement with 4 statements (i.e., ‘The questions are tedious’; ‘The questions are stressful’; ‘The experience is negative’; and ‘The experience is positive’) on a 7-point Likert scale (1 = Strongly Disagree to 7 = Strongly Agree). Responses were averaged after reverse-scoring some items so that higher scores indicated a more negative subjective exam experience.
6.4. Decision-making tasks to test predictive validity
6.4.1. Framing task
Modified from Peters et al. (Reference Peters, Västfjäll, Slovic, Mertz, Mazzocco and Dickert2006), participants were presented with the exam scores and course levels from 3 courses (200, 300, or 400—indicating varying difficulty levels of classes) of 5 students and were asked to rate the quality of each student’s work on a 7-point scale (−3 = very poor to +3 = very good). The frame was manipulated between subjects by presenting the grades as either percent correct or percent incorrect (average percent correct scores for the 5 students over the 3 courses were 66.3, 78.3, 79.0, 83.0, and 87.3). For example, ‘Mike’ was described as receiving either 78% correct on his exam or 22% incorrect in a 200-level course.
6.4.2. Bets task
Based on Peters et al. (Reference Peters, Västfjäll, Slovic, Mertz, Mazzocco and Dickert2006), a random half of participants rated the attractiveness of a no-loss gamble (7/36 chances to win $9; otherwise, win $0); the other half rated a similar gamble with a small loss (7/36 chances to win $9; otherwise, lose 5¢). Participants indicated their preference on a slider scale from 0 (not at all attractive) to 20 (extremely attractive).
6.4.3. Probability interpretation task
Based on Cokely et al. (Reference Cokely, Galesic, Schulz, Ghazal and Garcia-Retamero2012), participants indicated their response to a probability interpretation task with multiple-choice options. Participants were asked to select the correct interpretation of a weather forecast. Participants were asked, ‘Imagine that there is a 30% chance of rain tomorrow. Please indicate which of the following alternatives is the most appropriate interpretation of the forecast’. They were given 3 options, and the correct answer was ‘It will rain on 30% of the days like tomorrow’.
6.4.4. Benefit perception task
Based on Cokely et al. (Reference Cokely, Galesic, Schulz, Ghazal and Garcia-Retamero2012), participants indicated their response to a benefit perception task with multiple-choice options. Participants were asked to choose which piece of additional information would most inform about a toothpaste. Participants read an ad for ‘Zendil’ which they were told caused a ‘50% reduction in the occurrence of gum inflammation.’ Then, they were asked ‘Which one of the following would best help you evaluate how much a person could benefit from using Zendil?’ They were given 6 options, and the correct answer was ‘The risk of gum inflammation for people who do not use Zendil.’
6.4.5. Risk inconsistency
From Bruine de Bruin et al. (Reference Bruine de Bruin, Parker and Fischhoff2007), participants were asked to indicate the likelihood of 4 events occurring in the next year and then again in the next 5 years. They responded using a slider from 0 (no chance) to 100 (certainty). Each repeated pair was scored as correct if the probability of the event happening the next year was no larger than for it happening in the next 5 years. Within each time frame, one item is a subset of another (e.g., dying in a terrorist attack is a subset of the superset dying from any cause). To be scored as correct, the probability of a subset event should not exceed that of its more general event. Therefore, the maximum score is 8, and the minimum is 0.
6.5. Convergent validity measures
6.5.1. Subjective numeracy
This 8-item measure from Fagerlin et al. (Reference Fagerlin, Zikmund-Fisher, Ubel, Jankovic, Derry and Smith2007) has 2 subscales: numeric confidence (e.g., ‘How good are you at working with fractions?’) and preference for numeric information (e.g., ‘How often do you find numerical information to be useful?’). Participants responded on 6-point Likert-type scales. Subjective numeracy was calculated as an average of all items. Numeric self-efficacy was calculated as the average of the first 4 items and numeric preference as the average of the last 4 items.
6.5.2. Big 5 personality traits
Participants responded to the 30 items of the Big Five Inventory–2 Short Form using a 5-point Likert scale from 1 (Disagree Strongly) to 5 (Agree Strongly; Soto and John, Reference Soto and John2017). Items for each personality trait were averaged together. Associations with Big 5 Personality Measures can be found in Appendix G of the Supplementary Material.
6.5.3. Raven’s progressive matrices
Participants completed 10 six-alternative multiple-choice questions in which they had to complete the pattern in a matrix (Raven, Reference Raven2000). The number of correct responses was summed.
6.5.4. Vocabulary
Participants took a 12-item vocabulary test. The items were 6-alternative multiple-choice questions with the 6th option being ‘Skip.’ The items were created by Ekstrom and Harman (Reference Ekstrom and Harman1976). The original 36-item test was shortened based on IRT analysis. The number of correct responses was summed.
7. Results
7.1. Descriptive
Of the 600 participants, 149 participants completed the A-NUM (that includes the 1-NUM) first, 150 completed the BNT first, 153 completed the Weller first, and 148 completed the 4-NUM first. An exploratory multivariate ANOVA revealed no significant differences in scores on the 5 measures by which the measure was completed first (F(3, 596) = 0.98, p = 0.47; Wilk’s lambda = 0.98). The average score on the A-NUM was 4.70 (SD = 1.49; 52%) on the 1–9 scale and − 0.14 (SD = 0.95) using EAP estimation. The 2 scoring methods were highly correlated (r = .99). Thus, further analyses only examined scores calculated using the 1–9 scale. The average score on the 4-NUM was 1.84 (SD = 1.17; 46%) on a 0–4 scale (Guttman’s λ6 = .59). The average score on the BNT was 2.32 (SD = 1.19; 58%) on a 1–4 scale. The average score on the Weller was 5.30 (SD = 1.98; 66%) on a 0–8 scale (Guttman’s λ6 = .74). About half (48%) of participants answered the exploratory 1-NUM correctly.
7.2. Test of whether all numeracy measures would load onto a single latent variable
This hypothesis was investigated using a robust confirmatory factor analysis which specified a model in which the scores from each numeracy measure load onto a single factor. The model resulted in an adequate fit, χ 2(2) = 7.97, p = .02, CFI = .99, TLI = 0.97, RMSEA = .07, SRMR = .02 (Figure 2). An exploratory factor analysis also supported a single-factor solution, χ 2(2) = 9.08, p = .01, RMSEA = .08, TLI = .98. The Kaiser–Meyer–Olkin measure verified the sampling adequacy for the analysis, KMO = .83. Bartlett’s test of sphericity indicated that the correlation structure is adequate for factor analyses, χ 2 (6) = 1,329.28, p < .001.
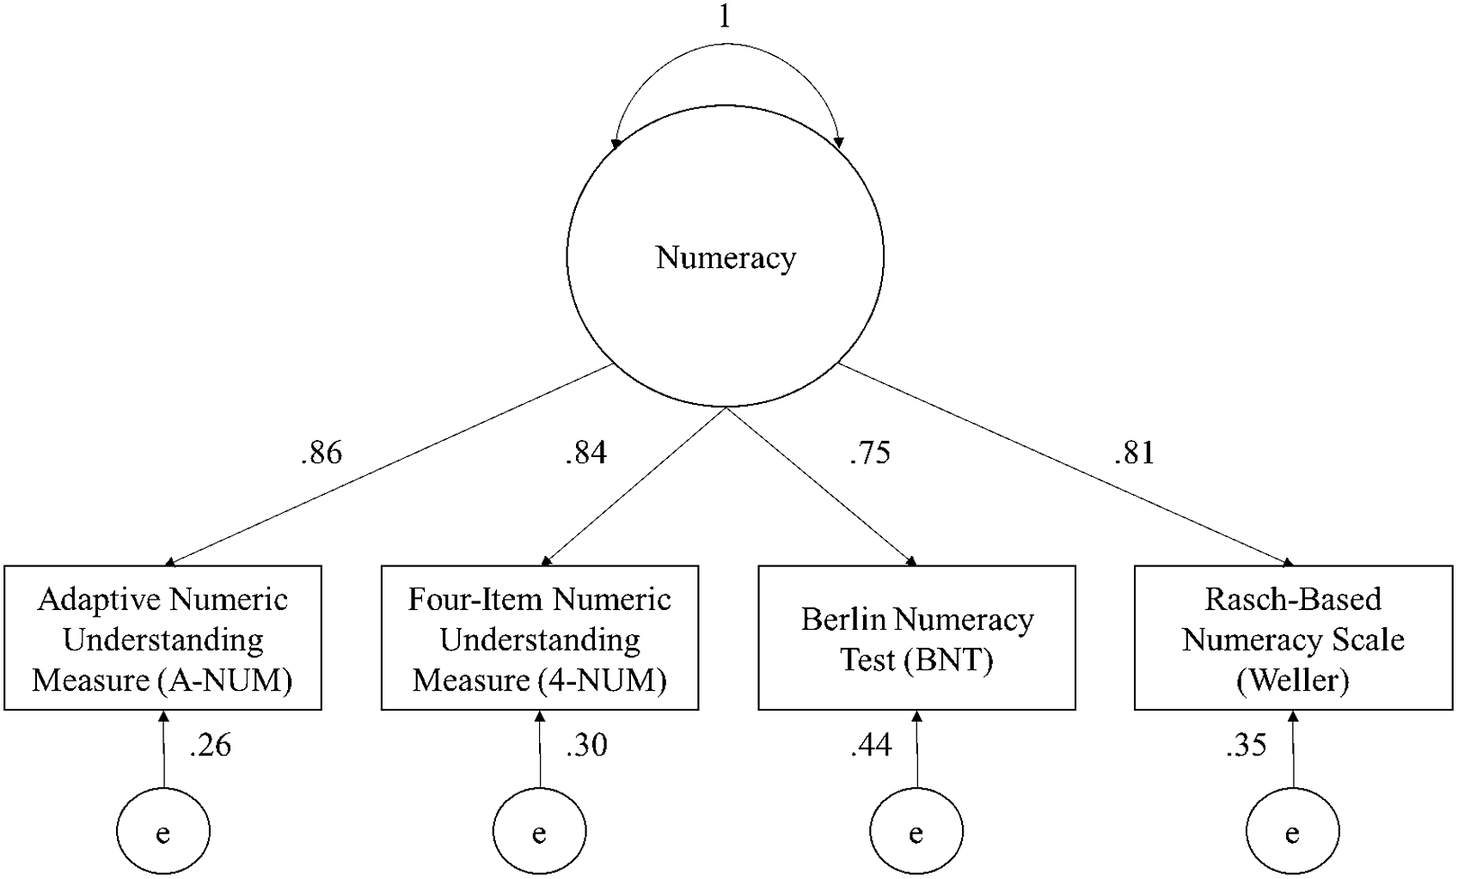
Figure 2 The results of the confirmatory factor analysis of the A-NUM, 4-NUM, BNT, and Weller numeracy measures. The values on the lines from numeracy to the measures represent the loading of each measure onto the latent factor. The values below the measures represent the error variance of the measures (i.e., the variance in scores unexplained by the latent factor). Note: p-values are <.001 for all paths.
A follow-up exploratory factor analysis was conducted, replacing the A-NUM with the 1-NUM because they share one item; it also supported a single-factor solution, χ 2(2) = .06, p = .97, RMSEA < .001, TLI = 1. The Kaiser–Meyer–Olkin measure verified the sampling adequacy for the analysis, KMO = .82. Bartlett’s test of sphericity indicated that correlation structure is adequate for factor analyses, χ 2 (6) = 1,024.76, p < .001. Latent numeracy accounted for 45.7% of the variance in the 1-NUM. Latent numeracy accounted for 71.8% of the variance in the 4-NUM, 60.1% of the variance in the BNT, and 60.4% of the variance in the Weller. The A-NUM, 4-NUM, and 1-NUM loaded onto a single latent factor with other numeracy measures. Additionally, latent numeracy accounted for a larger proportion of their variance than it did for the BNT and Weller scales, a point to which we return in the discussion.
7.3. Test of whether the new measures would demonstrate convergent validity
To test convergent validity, the new measures (i.e., A-NUM, 4-NUM, and exploratory 1-NUM) were correlated with the 2 existing measures (i.e., Weller and BNT), subjective numeracy and its subscales (i.e., numeric self-efficacy and numeric preference), and 2 nonnumeric intelligence measures(i.e., Raven’s progressive matrices and vocabulary; see Table 3 for all bivariate correlations). We expected the new numeracy measures to correlate strongly and positively with the Weller and BNT numeracy measures. Moreover, we expected moderately strong relationships between numeracy and subjective numeracy as well as its subscales of numeric self-efficacy and numeric preference. We expected moderate positive associations between numeracy and both vocabulary and Raven’s matrices. Overall, we expect the pattern of associations for the new measures to be like those for the other numeracy measures. Indeed, the new numeracy measures strongly correlated with established measures and had moderate to strong relationships with subjective numeracy and the 2 nonnumeric intelligence measures.
Table 3 Means, standard deviations, and correlations for all constructs used to test convergent validity
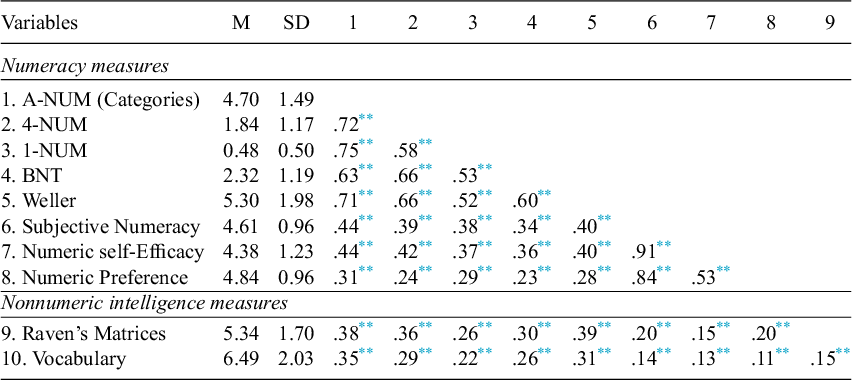
Note: M and SD are used to represent mean and standard deviation, respectively. Abbreviations: 1-NUM, single-item numeric understanding measure; 4-NUM, 4-item numeric understanding measure; A-NUM, adaptive numeric understanding measure; BNT, Berlin Numeracy Test; Weller, Rasch-Based Numeracy Scale.
* p < .05.
** p < .01.
7.4. Predictive validity
7.4.1. Test of whether people scoring higher on the NUM and other numeracy measures would have superior probability interpretation than those scoring lower in numeracy
Overall, 51.0% of participants responded correctly to the probability interpretation task. To assess if greater numeracy predicted more correct responses in the probability interpretation task, multiple binary logistic regressions were used to predict correctness from each of the 4 measures one at a time. As hypothesized, the new numeracy measures and the established measures predicted correct probability interpretation. The strongest predictor of correct interpretation was the 1-NUM, possibly due to the similar difficulty of the numeracy item and the interpretation task (i.e., both nearly split the sample in half; see Table 4 for effect sizes). For full models, see Table S1 in Appendix D of the Supplementary Material.
Table 4 Effect sizes of focal numeracy effects in predictive validity tasks without and with adjusting for assessed Raven’s progressive matrices and vocabulary
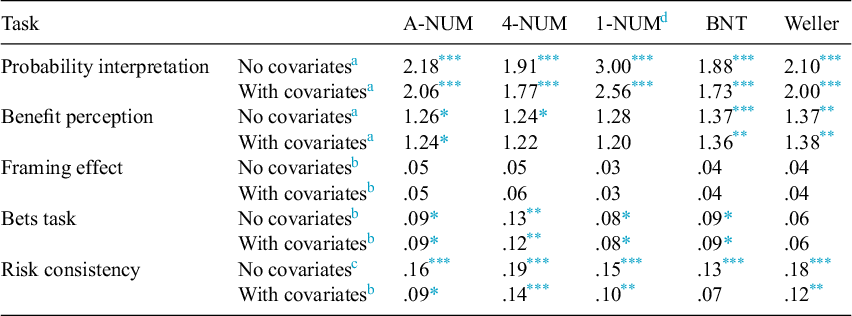
Abbreviations: 1-NUM, 1-item numeric understanding measure; 4-NUM, 4-item numeric understanding measure; A-NUM, adaptive numeric understanding measure; BNT: Berlin Numeracy Test; Weller: Rasch-Based Numeracy Scale.
a Standardized odds ratio.
b Partial R of the focal effect.
c R.
d Analyses using the 1-NUM are exploratory.
* p < .05.
** p < .01.
*** p < .001.
7.4.2. Test of whether people scoring higher on the NUM and other numeracy measures would have more accurate benefit perceptions than those scoring lower
Overall, 25.7% of participants responded correctly to the benefit perception task. To assess if greater numeracy predicted correct responses for the benefit perception task, multiple binary logistic regressions were used in predicting correctness from each of the 4 measures. The A-NUM, BNT, and Weller predicted correct benefit perceptions similarly. Although the 4-NUM and 1-NUM did not attain significance as a predictor of benefit perceptions after adjusting for assessed vocabulary and Raven’s matrices, the effect size of numeracy with covariates was similar to its effect size without covariates (see Table 4 for effect sizes). For full models, see Table S2 in Appendix D of the Supplementary Material.
7.4.3. Test of whether the more numerate would demonstrate smaller framing effects
The framing effect was evaluated using multilevel linear regressions predicting participant’s ratings of the student from frame condition (positive vs. negative), numeracy as assessed by the 4 measures, a frame-by-numeracy interaction, and random intercepts for each student being evaluated and each participant. Although the frame significantly influenced judgments, numeracy (as operationalized by any of the measures) did not significantly modify the effect of the frame on the judgments of the students as indicated by the nonsignificant Frame × Numeracy interactions (see Table 4 for effect sizes). For full models, see Tables S3 and S4 in Appendix D of the Supplementary Material. Appendix E of the Supplementary Material contains exploratory analyses examining the pattern of results across student scores indicating that the numeracy by frame results appeared when the proportions used were more extreme (e.g., 87% vs. 63% correct; Peters et al., Reference Peters, Västfjäll, Slovic, Mertz, Mazzocco and Dickert2006). It may be that the use of higher average grades across the stimuli would have resulted in a replication of the original effect.
7.4.4. Test of whether the highly numerate—more than the less numerate—would rate the small-loss condition of the bets task as more attractive than the no-loss condition
The bets task was evaluated with a simple linear regression predicting attractiveness ratings from the loss condition (no-loss vs. small-loss), numeracy as assessed by the 4 measures, and a loss-by-numeracy interaction. In each case where the interaction was significant, the highly numerate rated the loss bet as more attractive than the no-loss bet, whereas the less numerate rated them more similarly. The significant measures appear to demonstrate similar effect sizes (see Table 4 for effect sizes). For full models, see Table S5 in Appendix D of the Supplementary Material.
7.4.5. Test of whether the highly numerate would show more risk consistency than the less numerate
Risk consistency was evaluated using simple linear regressions predicting the number of risk-consistent responses (out of 8) from numeracy as assessed by the 4 measures. The significant measures appear to demonstrate similar effect sizes (see Table 4 for effect sizes). Adjusting for assessed vocabulary and Raven’s matrices reduced the effect sizes for numeracy suggesting that these other cognitive abilities may, in part, account for the predictive power of the numeracy measures. For full models, see Table S6 in Appendix D of the Supplementary Material.
Overall, established associations between decision-making tasks and numeracy were largely replicated using the A-NUM and mostly replicated using the other numeracy measures. However, numeracy as measured by each of the included assessments did not moderate the framing effect in the present study. Adjusting for nonnumeric intelligence measures had little to no influence on the effect sizes of numeracy in predicting the behaviors evaluated in this article. This pattern of results could suggest that the assessed traits for covariates largely did not account for the effect of numeracy on these behaviors. However, the models with covariates were not corrected to account for the imperfect reliability of measures. One exception to the noted pattern was in predictions of risk consistency where numeracy’s effect size was reduced when adjusting for assessed Raven’s matrices and vocabulary (see Table 4). Together, these results demonstrate predictive validity for the new numeracy measures.
7.5. Negative subjective exam experience
We were also interested in whether participants’ subjective exam experiences differed across the measures. More negative subjective experiences were evaluated using a multivariate analysis of variance (MANOVA) predicting the 4 subjective-experience responses after the first numeracy measure was completed. The MANOVA revealed no significant differences overall between numeracy measures for reported negative test experience (overall means were 3.74, 3.48, 3.56, and 3.76, respectively, on a 7-point scale for A-NUM, 4-NUM, BNT, and Weller; F(3, 596) = 1.60, p = 0.08; Wilk’s lambda = 0.968), indicating that the experience across measures was generally neither positive nor negative.
8. Discussion
In the present article, we sought to develop new measures of numeracy—developed using IRT—that provided granular measurement across a meaningful range of ability and with a minimum number of items. Using largely newly developed math problems, we ultimately produced 3 numeracy measures that fulfilled our aim: a nonadaptive 4-item measure, an adaptive measure (on which participants would respond to 4 out of 13 items), and a single-item measure. All 3 measures demonstrated convergent and predictive validity (Campbell and Fiske, Reference Campbell and Fiske1959; Cronbach and Meehl, Reference Cronbach and Meehl1955). Thus, by using IRT, we were able to develop brief measures of numeracy that captured many levels of difficulty, without sacrificing the scope of the construct. Our new 1- and 4-item numeracy measures and our new online adaptive numeracy measure all provide researchers with short-form assessments of numeracy using unfamiliar items that address retest-effect issues caused by using the same items for all participants over many studies (these measures can be downloaded for Qualtrics from https://osf.io/pcegz/). Unlike other current numeracy measures, answers for these items also cannot be located easily online at this time.
To address construct validity, we first sought to demonstrate that the new measures assess the same latent trait as established numeracy measures. Indeed, factor analysis suggested one latent trait was responsible for most of the variance in responses to each of the numeracy measures. The A-NUM and 4-NUM appeared to reflect latent numeracy better than the 2 established measures. One potential reason for this greater shared variance is participants did not have prior experience with the items so that less of the variability in scores can be explained by either prior experience or the ability to find the correct answers online. Alternatively, it is possible that the greater difficulty ranges in items allowed for more shared variance between the new measures and latent numeracy. Further, we attempted to demonstrate convergent validity by assessing the associations of the new measures with established numeracy measures and measures of subjective numeracy as well as nonnumeric intelligence. Generally, the new measures correlated with other measures as expected. Interestingly, the new single-item measure has the potential to divide samples in half by numeracy level, and even it performed similarly to the longer measures although more weakly than them.
Next, we were able to generally demonstrate the predictive validity of our measures using established numeracy tasks. As expected, numeracy measures predicted performance in the probability interpretation and benefit perceptions tasks (Cokely et al., Reference Cokely, Galesic, Schulz, Ghazal and Garcia-Retamero2012). Numeracy also moderated the relative attractiveness ratings of small-loss and no-loss bets (Peters et al., Reference Peters, Västfjäll, Slovic, Mertz, Mazzocco and Dickert2006). Participants higher in numeracy made 1-year and 5-year risk judgments that were more consistent with each other than those lower in numeracy (Del Missier et al., Reference Del Missier, Mäntylä and de Bruin2012). New numeracy measures demonstrated similar predictive power to established measures. Results of a framing task did not support numeracy-by-frame interactions for any numeracy measure (Peters et al., Reference Peters, Västfjäll, Slovic, Mertz, Mazzocco and Dickert2006; see Appendix E of the Supplementary Material for exploratory analyses indicating that stimuli choices may have played a role). Together, support for these hypotheses suggest construct validity by demonstrating convergent and predictive validity for all 3 of the NUMs (see Table 5 for metrics of each measure).
Table 5 Summary of measure metrics
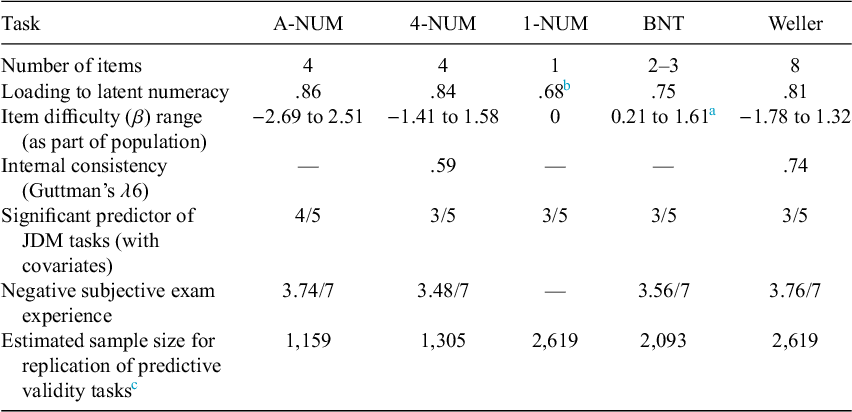
Abbreviations: A-NUM, adaptive numeric understanding measure; 4-NUM, 4-item numeric understanding measure; 1-NUM, single-item numeric understanding measure; BNT, Berlin Numeracy Test; Weller, Rasch-Based Numeracy Scale.
a Item parameters from Allan (Reference Allan2021).
b 1-NUM loading based on analysis excluding the A-NUM.
c See Appendix F of the Supplementary Material for details.
While all measures provide predictive validity, the most consistent predictor of decision performance across tasks was the A-NUM that placed participants in 1 of 9 categories based on their responses to 4 out of 13 new math problems (compared with 4 categories for the adaptive BNT). These findings could suggest that its more granular and accurate assessment provided more power to identify effects in studies involving numeracy. The effect size of A-NUM was largely consistent as a predictor of the effects after adjusting for assessed vocabulary and Raven’s matrices. This pattern suggests that the new A-NUM and 4-NUM measures are ideal for assessing the unique covariance of numeracy with behaviors.
Another strength of the A-NUM is the difficulty range it covers. The A-NUM is expected to measure ability in MTurk and similar populations ranging between the 0.5th percentile and the 98.6th percentile (about 98% of participants). By comparison, a participant who gets the minimum score of 1 on the BNT—which is geared toward the more highly numerate—is expected to achieve a score of 3.67 on the A-NUM (using the 1–9 categorical scale; a score of −0.81 using the EAP method). The BNT has a difficulty range falling between β = 0.21 and β = 1.61 (Allan, Reference Allan2021) compared with A-NUM’s difficulty range falling between β = −2.69 and β = 2.51. The BNT’s truncation means little distinction exists among examinees below approximately the 58th percentile in numeracy, based on the calibration by Allan (Reference Allan2021). This limited range is problematic when assessing numeracy in lower ability populations (e.g., older age and less educated populations) and when changes in numeracy at lower parts of the ability spectrum predict changes in outcomes (Desjardins et al., Reference Desjardins, Thorn, Schleicher, Quintini, Pellizzari, Kis and Chung2013; Peters et al., Reference Peters, Fennema and Tiede2019). Overall, the A-NUM is expected to have the capacity to assess numeracy at lower levels than the BNT.
The present study was limited in several ways. First, this validation used an online convenience sample in the United States and thus may not generalize widely. However, American MTurkers do not significantly differ from the U.S. population in global cognitive ability as measured by the 16-item International Cognitive Ability Resource (Merz et al., Reference Merz, Lace and Eisenstein2022). Additionally, unlike classical test theory, IRT can produce unbiased estimates of item parameters without a representative sample (Embretson and Reise, Reference Embretson and Reise2013). The present study did not assess the length of time to take each assessment; however, we have minimized the number of items with limited sacrifice of the breadth of numeracy assessed. The present article only reports internal consistency for the 4-NUM and the Weller. Internal consistency cannot be calculated for the other measures (see Figure S3 in the Supplementary Material or the A-NUM test information curves as an indicator of reliability). However, the new numeracy measures do address reliability; they are expected to reduce learning and memory effects stemming from high usage of numeracy measures in 2 ways. First, the new NUM measures use new items that are not easily found and are relatively unknown to participants. Second, the adaptive nature of the A-NUM has the potential to reduce learning and memory effects since a participant who correctly answers an item that they had previously gotten wrong is presented an item novel to them. To ensure reliability, highly discriminating items were used whenever possible. The present study does not specifically investigate the dimensionality of numeracy as a construct. However, its results suggest that the included numeracy measures load onto a common factor despite being comprised of different items, thus supporting construct validity.
Although the A-NUM reduces many problems with previous measures (such as those assessed in this study), it does have limitations. First, no items were available in some parts of the difficulty range; the calibrated items and items drawn for the measures were lacking items with difficulties between β = 0.83 and β = 1.89 (approximately the 80th and 97th percentiles, respectively; Appendix A of the Supplementary Material). Thus, the standard error of the measure is larger in this range (see Figure S1 in the Supplementary Material). This ability range corresponds approximately to an ability level needed to complete a novel, multistep numeric problem (Desjardins et al., Reference Desjardins, Thorn, Schleicher, Quintini, Pellizzari, Kis and Chung2013). Nevertheless, the pattern of responses to items surrounding this missing range provides some information about the ability range therein. Future research should develop more items to assess numeracy in this ability range.
Second, the A-NUM prioritized a short test length resulting in a larger error in the estimate when calculating ability using EAP scores. Rather than using EAP estimation, we have sorted participants into 1 of 9 ability levels which combine similar ability levels from EAP scores. The EAP method would provide a measure of ability based on a z-score and require no other standard for comparison, whereas sum scores require comparison to a standard (e.g., the average within the population of interests; Embretson and Reise, Reference Embretson and Reise2013). However, with a larger error in the estimate, discriminating between close scores may result in inaccurate rank-order estimates. Sorting participants into categories as we have done throughout the article produces a less granular measure but should allow for more accurate rank-order estimates, address concerns with estimation errors, and provide a simpler way to score the measure. The A-NUM uses highly discriminating items which means that the items are more informative (i.e., they more closely assess latent numeracy). However, the most difficult item of the A-NUM (i.e., item 13; Table 1) has a relatively lower discriminability. Several possible explanations exist for the lower discriminability. One is that the item simply is not as reflective of latent numeracy. Another possibility that we favor is that the type of problem (i.e., a Bayesian reasoning problem) could be solved in multiple ways: employing logic or employing Bayes’ theorem. We suspect that people of different numeracy levels employ different strategies to solve the Bayesian reasoning problem (Pachur and Galesic, Reference Pachur and Galesic2013). Nevertheless, the discriminability of item 13 is adequate with an equivalent factor loading of λ = .49 (as discriminability in a 2PL and factor loadings can be calculated from each other directly).
One way that current measures can be further improved is through the ongoing creation and calibration of new numeracy items. Items with similar parameters could replace current items or, with sufficient items, the measure could randomly draw from pools of items with similar difficulties. This approach would go further to address retest effects in numeracy assessment. However, the creation of new items to create such a measure is complicated by the need to empirically investigate the difficulty of items prior to use. In studies with large samples, new uncalibrated numeracy items could be included and calibrated to continually grow the bank of potential numeracy items. Then, promising items could be recalibrated together and used to improve the A-NUM and create new measures. Many different labs could potentially create and calibrate new items for this purpose using similar methods as those described in the present article. Future research should seek to calibrate new items to address current information gaps and build up interchangeable items. Translation and validation of these measures in other languages and other countries also are needed. In addition to developing more questions, researchers should examine the effect of different contexts, such as financial and health contexts, on understanding across countries.
9. Conclusion
Numeracy appears to be an important construct in judgments and decision-making as well as in health and financial outcomes and well-being (Bjälkebring and Peters, Reference Bjälkebring and Peters2021; Peters, Reference Peters2020; Peters et al., Reference Peters, Fennema and Tiede2019). Moreover, the study of numeracy has led to a greater understanding of motivated reasoning (Kahan et al., Reference Kahan, Peters, Dawson and Slovic2017; Shoots-Reinhard et al., Reference Shoots-Reinhard, Goodwin, Bjälkebring, Markowitz, Silverstein and Peters2021). However, current measures of numeracy are flawed. Many measures assess truncated levels of numeric ability (e.g., Numeracy Scale [Lipkus et al., Reference Lipkus, Samsa and Rimer2001] and BNT [Cokely et al., Reference Cokely, Galesic, Schulz, Ghazal and Garcia-Retamero2012]), whereas others are comprised of well-known items that might mask participants’ true ability (e.g., CRT [Frederick, Reference Frederick2005]; and Rasch-Based Numeracy Scale [Weller et al., Reference Weller, Dieckmann, Tusler, Mertz, Burns and Peters2013]).
In the current research, we developed and validated 3 novel measures of numeracy: an adaptive measure in which participants respond to 4 out of 13 items (A-NUM), a 4-item nonadaptive (4-NUM) measure, and a single-item nonadaptive (1-NUM) measure. Both the A-NUM and 4-NUM demonstrated convergent and predictive validity, suggesting that they have good construct validity (Cronbach and Meehl, Reference Cronbach and Meehl1955). Thus, using IRT, we provided short measures of numeracy without sacrificing construct scope (Smith et al., Reference Smith, McCarthy and Anderson2000; Smith and McCarthy, Reference Smith and McCarthy1996). Moreover, both 4-item measures provided researchers with short-form assessments of numeracy using novel items to address retest effects caused by using the same items for all participants over many studies. Lastly, even the single-item numeracy measure (1-NUM) measured numeracy adequately and could be useful when time is limited.
Supplementary materials
The supplementary material for this article can be found at http://doi.org/10.1017/jdm.2023.17.
Data availability statement
The data that support the findings of this validation are openly available in the Open Science Framework at https://osf.io/kv7cn. The full validation materials can be found at https://osf.io/d298f and the text for the items may be found in a .doc file at https://osf.io/zunrj.
Please note: to slow the availability of the new items’ answers online, we do not provide the correct answers publicly. For information about how to use the NUM scales, including how to program and score them, please visit https://www.caidelab.com/numeracy-scales.
Acknowledgement
A special thank you to Martin Tusler for his work in developing new numeracy items.
Funding statement
This work was supported by the National Science Foundation (Grant No. 2017651) and the Decision Sciences Collaborative at The Ohio State University .


 Open access