


Introduction
Population ageing is now becoming a phenomenon worldwide. The WHO Global Forum on Innovations for Ageing Populations has discussed the rapid growing of older populations especially in middle- and low-income countries. Over the next 40 years, it is expected that developing countries will be home to about 80 % of the population of older adults in the world(1). With advances in healthcare treatment and accessibility, older adults nowadays can live longer, healthier and with enhanced functional fitness. The increasing life expectancy of older adults, with an average of 20·4 years for men and 17·8 years for women, further contributed to the booming of the baby boomer population(Reference Wellman, Kamp, Mahan and Raymond2). In many federal programmes, older adults are considered as those who are aged 65 years and older. The UN defines elderly as those aged 60 years and older(3). On the other hand, the United States Census Bureau defines older adults in a stratified system where those aged 65–74 years are considered as ‘young old’, 75–84 years as ‘old’ and 85 years or older as ‘oldest old’(Reference Wellman, Kamp, Mahan and Raymond2).
Quality of life, health status and functional independence of older adults depend highly on their nutritional well-being. However, ageing-associated changes including physiological changes, chronic illness, chewing and swallowing difficulties, reduced energy expenditure and psychosocial problems can make it more difficult to meet nutritional needs(Reference Leslie and Hankey4). However, the impact of these changes is definitely stronger for older adults who live in the most disadvantaged communities. The majority of the older adults with low socio-economic status (SES) are unemployed, have low education, lack of financial assistance, mostly reside in a rural area, have greater disabilities, have a higher risk of cognitive impairment and higher risk of malnutrition due to poor diet quality(Reference Shahar, Vanoh and Mat Ludin5,Reference Donini, Poggiogalle and Piredda6) .
Diet quality is a concept which emphasises the totality of what an individual eats and drinks, examines patterns of healthy eating as a whole, with the aim to ensure permanent improvements in individual and population health(Reference Hiza, Koegel and Pannucci7). Poor diet quality is characterised by limited consumption of fruits, vegetables, beans and whole grains as well as overconsumption of high-energy, low-nutrient-dense foods with added sugars(Reference Pascual, Phelan and La Frano8). Ageing itself may increase the risk of malnutrition due to the co-existence of several factors such as poor oral health, frailty, chronic disease, psychosocial problems and physical limitations which will gradually worsen body function(Reference Fávaro-Moreira, Krausch-Hofmann and Matthys9). However, older adults who are socio-economically disadvantaged would have higher risk of malnutrition due to a lack of availability of good-quality food. Therefore, this article reviews the prevalence of malnutrition and diet quality of older adults with low SES.
Methods
Search strategy
The search for published research papers related to nutritional status and diet quality of older adults with low SES was conducted using four databases including PubMed, Google Scholar, Springer and Science Direct for articles published from 2009 to 2019 by using the Preferred Reporting Items for Systematic Reviews and Meta-Analyses (PRISMA) method(Reference Moher, Liberati and Tetzlaff10). The review includes only cross-sectional studies. The terms used to search the related articles were ‘diet quality’, ‘nutritional status’, ‘malnutrition’, ‘dietary intake’, ‘overweight’, ‘obesity’, ‘underweight’, ‘older people’ and ‘low socioeconomic status (SES)’. Since the study is a review article, ethics approval and informed consent were not required.
Inclusion criteria
Studies chosen for this review investigated the prevalence of malnutrition referring to either under- or over-nutrition, or prevalence of poor diet quality and its associated risk factors among older adults with low SES. The publication year of the studies chosen for the present review ranged between the years 2010 and 2019.
Exclusion criteria
Articles were excluded if not published in English and not focusing on older adults.
Study selection
The prime literature search was conducted by the authors. The duplicate articles were removed. A hand search was conducted to confirm that the duplicate articles were removed. Papers included for the present review were chosen based on the title and abstract followed by retrieval of the full article from the database. Relevant articles were downloaded and assessed for eligibility. Non-English language articles were excluded at this time point.
Data organisation and reporting
The final articles selected for the present review were read thoroughly and each article was summarised according to the country where the study was conducted, study design, population characteristic, sample size, tool used for malnutrition classification, and findings of the study. The studies were reported according to PRISMA guidelines(Reference Moher, Liberati and Tetzlaff10). Fig. 1 explains the processes involved in the searching of the articles to be included in the present review.

Fig. 1. Flowchart of search strategy and selection process. SES, socio-economic status.
Results
Study selection
A total of 8208 records were identified through searching four electronic databases. About 3323 duplicates were removed and the screening was done to the remaining articles based on title. A total of fifty articles qualified for the full-text review. However, thirty-three articles had to be excluded from the review because five were not cross-sectional studies, fourteen did not focus on low-SES older adults, and fourteen studies were not related to diet quality or nutritional assessment. Thus, a total of seventeen studies were included in the final review, where seven articles measured the prevalence of malnutrition in older adults(Reference Ahn, Huber and Smith11-Reference Liu, Pang and Man17), seven measured diet quality and dietary assessment of older adults(Reference Conklin, Forouhi and Suhrcke18-Reference Rajhans and Sharma24) and three articles assessed both components(Reference Shahar, Vanoh and Mat Ludin5,Reference Arjuna, Soenen and Hasnawati25,Reference Maila, Audain and Marinda26) . Seven of the studies were conducted in Asian countries: one in Indonesia(Reference Arjuna, Soenen and Hasnawati25), one in Lebanon(Reference Boulos, Salameh and Barberger-Gateau14), one in Nepal(Reference Ghimire, Baral and Callahan15), two in India(Reference Selvamani and Singh16,Reference Rajhans and Sharma24) , one in Malaysia(Reference Shahar, Vanoh and Mat Ludin5) and one in China(Reference Liu, Pang and Man17). Another ten studies were conducted in non-Asian countries: one in Texas, USA(Reference Ahn, Huber and Smith11), one in Zambia(Reference Maila, Audain and Marinda26), one in Brazil(Reference Fares, Barbosa and Borgatto12), one in New Zealand(Reference Wham, Teh and Moyes13), two in the UK(Reference Conklin, Forouhi and Suhrcke18,Reference Holmes and Roberts21) , one in Spain(Reference Francis-Granderson and Pemberton19), one in the Netherlands(Reference Dijkstra, Neter and Brouwer20), one in Greece(Reference Katsarou, Tyrovolas and Psaltopoulou22) and one in the USA(Reference Chang and Hickman23). Nine studies had a sample size of less than 1000 individuals, six studies had a sample size between 1000 and 3000 individuals and another two had a sample size of >3000 individuals. As stated in the Methods section, the studies included in the present review had a cross-sectional study design. The duration of the included studies ranged from a minimum of 5 months to a maximum of 1 year.
Prevalence of malnutrition among older adults
A total of ten studies(Reference Shahar, Vanoh and Mat Ludin5,Reference Ahn, Huber and Smith11-Reference Liu, Pang and Man17,Reference Arjuna, Soenen and Hasnawati25,Reference Maila, Audain and Marinda26) measured the prevalence of malnourished older adults with low SES as shown in Table 1 and Table 2. Six studies used BMI as the criterion for malnutrition(Reference Shahar, Vanoh and Mat Ludin5,Reference Ahn, Huber and Smith11,Reference Fares, Barbosa and Borgatto12,Reference Selvamani and Singh16,Reference Liu, Pang and Man17,Reference Maila, Audain and Marinda26) , two used the Mini Nutritional Assessment (MNA)(Reference Boulos, Salameh and Barberger-Gateau14,Reference Ghimire, Baral and Callahan15) , one used the Seniors in the Community: Risk Evaluation for Eating and Nutrition (SCREEN II)(Reference Wham, Teh and Moyes13) and another one used several criteria including the MNA, Malnutrition Universal Screening Tool (MUST), Malnutrition Screening Tool (MST), Short Nutritional Assessment Questionnaire (SNAQ) and Geriatric Nutrition Risk Index(Reference Arjuna, Soenen and Hasnawati25).
Table 1. Prevalence of malnourished older adults with low socio-economic status in non-Asian countries

QoL, quality of life; HDI, Human Development Index; SCREEN, Seniors in the Community: Risk Evaluation for Eating and Nutrition.
Table 2. Prevalence of malnourished older adults with low socio-economic status (SES) in Asia
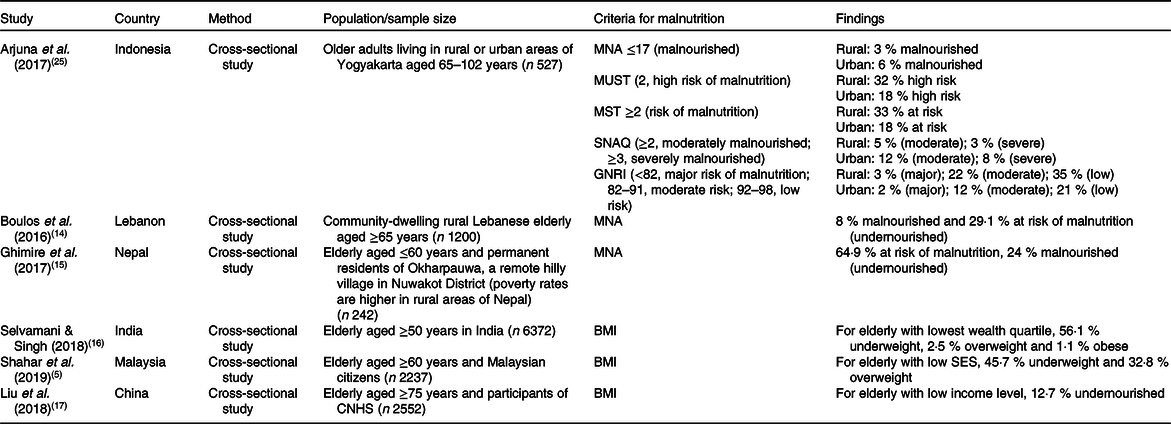
MNA, Mini Nutritional Assessment; MUST, Malnutrition Universal Screening Tool; MST, Malnutrition Screening Tool; SNAQ, Short Nutritional Assessment Questionnaire; GNRI, Geriatric Nutritional Risk Index; CNHS, Chinese Nutrition and Health Surveillance.
Diet quality among older adults
A total of ten studies measured the diet quality and dietary assessment of older adults with low SES as shown in Table 3 and Table 4 (Reference Shahar, Vanoh and Mat Ludin5,Reference Conklin, Forouhi and Suhrcke18-Reference Maila, Audain and Marinda26) . Among the studies, four studies used FFQ(Reference Conklin, Forouhi and Suhrcke18,Reference Dijkstra, Neter and Brouwer20,Reference Katsarou, Tyrovolas and Psaltopoulou22,Reference Maila, Audain and Marinda26) , three used 24 h dietary recall (24HR)(Reference Francis-Granderson and Pemberton19,Reference Holmes and Roberts21,Reference Rajhans and Sharma24) , one used a diet history questionnaire(Reference Shahar, Vanoh and Mat Ludin5) and another one used both FFQ and 24HR(Reference Arjuna, Soenen and Hasnawati25) to measure dietary assessment. All studies used different approaches to measure diet quality including variety and quantity of fruits and vegetables, Healthy Eating Index (HEI), Diet Diversity Score, Diet Quality Index, adherence to Dutch dietary guidelines and adherence to the Mediterranean diet. The heterogeneity in assessment methods used did not allow the data to be synthesised by meta-analysis. Besides that, the present review included studies which explored the risk factors of poor diet quality among low-SES older adults. A total of eight studies reported the risk factors including financial hardship, functional limitation, sex, place of residence, smoking and oral health(Reference Shahar, Vanoh and Mat Ludin5,Reference Conklin, Forouhi and Suhrcke18-Reference Chang and Hickman23,Reference Arjuna, Soenen and Hasnawati25) .
Table 3. Diet quality and dietary assessment of older adults with low socio-economic status (SES) in non-Asian countries

EPIC, European Prospective Investigation in Cancer and Nutrition; HEI, Healthy Eating Index; DDS, Diet Diversity Score; DQI, Diet Quality Index; SQFFQ, semi-quantitative FFQ.
Table 4. Diet quality and dietary assessment of older adults with low socio-economic status (SES) in Asia

SQFFQ, semi-quantitative FFQ.
Discussion
Prevalence of malnourished older adults with low socio-economic status
Malnutrition is defined as the state of being over- or undernourished accompanied with physical and physiological changes(Reference Shakersain, Santoni and Faxen-Irving27). Therefore, within the context of the present review, malnutrition can be referred to as both over- and undernutrition. As years have passed, the prevalence of malnutrition has shown an increment globally, specifically among older adults(Reference Chern and Lee28). In this review, it was found that the prevalence of undernutrition or at risk of undernutrition among older adults with low SES in non-Asian countries was within the range of 28·9 to 48 % between the years 2010 and 2019(Reference Fares, Barbosa and Borgatto12,Reference Wham, Teh and Moyes13,Reference Maila, Audain and Marinda26) . Meanwhile, in Asia, the prevalence of undernourished low-SES older adults ranged from 3 to 64·9 % between the years 2010 and 2019(Reference Shahar, Vanoh and Mat Ludin5,Reference Boulos, Salameh and Barberger-Gateau14-Reference Liu, Pang and Man17,Reference Arjuna, Soenen and Hasnawati25) . Moreover, the prevalence of overweight/obesity among older adults with low SES ranged from 8·1 to 28·2 % for non-Asian countries(Reference Ahn, Huber and Smith11,Reference Fares, Barbosa and Borgatto12,Reference Maila, Audain and Marinda26) and from 2·5 to 32·8 % in Asian countries(Reference Shahar, Vanoh and Mat Ludin5,Reference Selvamani and Singh16) . The variation in the prevalence of malnutrition across the world may be due to the different criteria used to identify the presence of malnutrition and its risk.
A wide variety of nutritional screening and assessment tools has been developed. Accurate and earlier identification of malnutrition in older adults using structured assessment tools will allow planning of intervention strategies to overcome the problem at an early stage. A nutritional screening and assessment tool with high sensitivity will allow for accurate detection of those with nutritional problems and very few will go undetected, while a tool with high specificity will reduce the risk of overtreatment of malnutrition, especially in those who do not need it(Reference Sakinah and Tan29). Most of the studies (60 %) included in the present review used BMI as the criterion to identify malnutrition(Reference Shahar, Vanoh and Mat Ludin5,Reference Ahn, Huber and Smith11,Reference Fares, Barbosa and Borgatto12,Reference Selvamani and Singh16,Reference Liu, Pang and Man17,Reference Maila, Audain and Marinda26) . BMI is one of the most common criteria used to identify malnutrition as it is considered a cheap, simple, quick and practical measure where the level of malnutrition risk is assigned according to descending BMI cut-off points(Reference Ng, Collins and Hickling30). However, variation of the BMI cut-off points used in the studies from 18·5 kg/m2 to 23 kg/m2 may affect the sensitivity and specificity of the tool in identifying malnutrition risk depending on the target group’s characteristics(Reference Ng, Collins and Hickling30). The study by Arjuna et al. (Reference Arjuna, Soenen and Hasnawati25) used a variety of screening tools to identify malnutrition among older adults including the MNA, Malnutrition Universal Screening Tool (MUST), Malnutrition Screening Tool (MST), SNAQ and Geriatric Nutritional Risk Index. Most assessment tools found that older adults in rural areas had poorer nutritional status compared with those in urban areas, except for SNAQ which identified that nutritional status was better for rural compared with urban older adults. A closer look at each item of the SNAQ questionnaire revealed that more of the study participants from the urban areas reported losing more than 6 kg, which gave them 2 points and classified them as moderately malnourished(Reference Arjuna, Soenen and Hasnawati25). It must be noted that none of the nutritional screening tools is considered to be the ‘gold standard’ and there might be inconsistency in the accuracy of these screening tools depending on the setting in which they were validated and are used now(Reference Ng, Collins and Hickling30).
Diet quality and dietary assessment of older adults with low socio-economic status
A total of 44·4 % of the studies included in the present review used FFQ(Reference Conklin, Forouhi and Suhrcke18,Reference Dijkstra, Neter and Brouwer20,Reference Katsarou, Tyrovolas and Psaltopoulou22,Reference Maila, Audain and Marinda26) , 33·3 % of the studies(Reference Francis-Granderson and Pemberton19,Reference Holmes and Roberts21,Reference Rajhans and Sharma24) used 24HR to obtain dietary assessment, 11·1 % used diet history questionnaires(Reference Shahar, Vanoh and Mat Ludin5) and another 11·1 % used both FFQ and 24HR(Reference Arjuna, Soenen and Hasnawati25). Subjective dietary assessment methods that can be used to assess an individual’s intake may include 24HR, dietary records, dietary history and FFQ(Reference Shim, Oh and Kim31). The 24HR are open-ended questionnaires used to collect a variety of detailed information regarding food consumption over the previous 24 h. Compared with other methods, 24HR give more detailed intake data and give minimal burden to the subjects, as literacy not required. However, 24HR mainly focus on short-term intake. Thus, multiple 24HR are needed to measure average intake. On the other hand, a FFQ is a checklist form used to assess how often and how much food subjects eat over a specific duration. A FFQ allows the assessment of long-term dietary intakes in a simple, time-efficient and cost-effective way(Reference Shim, Oh and Kim31). Both methods have a possibility of recall bias as all information depends on the subjects’ memory. However, the burden of memory loss for 24HR method may be less as compared with FFQ, especially among older adults, because FFQ require subjects to recall their food intake over a long period of time (1 year ago). Nevertheless, it must be noted that dietary intake is difficult to assess and no single method is able to assess dietary intake perfectly. Therefore, it has been suggested that combining methods such as FFQ with 24HR should be considered to obtain more accurate estimation of dietary intakes as compared with an individual method(Reference Carroll, Midthune and Subar32). A recent study by Freedman et al. (Reference Freedman, Midthune and Arab33) also agreed that the combination of FFQ with multiple 24HR modestly improves the accuracy of estimation of individual intakes.
All the studies included in the present review used different types of approaches to assess the diet quality of older adults. Most of the studies (71·4 %) used diet quality indices such as the HEI, Diet Diversity Score, Diet Quality Index, Mediterranean Diet Score and guidelines such as the Dutch dietary guidelines to measure diet quality. The study by Conklin et al. (Reference Conklin, Forouhi and Suhrcke18) used quantity and variation of fruits and vegetables as a measure of diet quality whereas Chang & Hickman(Reference Chang and Hickman23) focused on food insecurity and perceived poor diet quality. Perceived poor diet quality in the Chang & Hickman study(Reference Chang and Hickman23) was assessed based on the diet behaviour and nutrition component of the National Health and Nutrition Examination Survey (NHANES) questionnaire where the question is ‘In general, how healthy is your overall diet?’. Perceived poor-quality diet was determined and coded as 1 if the subjects answered poor or fair and 0 if replied good, very good or excellent. Even the consistency of this perception-based approach might be debatable as a measure of diet quality; the wide heterogeneity in dietary requirements associated with ageing and functional decline make it hard to assess the subjects’ diet quality on an index-based metric(Reference Chang and Hickman23). Diet quality indices are mathematical algorithms which aim to quantify the extent to which real food and nutrient intake adhere to the reference intake values recommended in national dietary guidelines, or at analysing dietary patterns in the population and weighing those components whose consumption has been linked, in scientific studies, either to the appearance of the disease or to the preservation of an optimal state of health(Reference Gil, Martinez De Victoria and Olza34). The Diet Quality Index, Healthy Diet Indicator and Mediterranean Diet Score are three internationally recognised diet indices(Reference Guerrero, Pérez-Rodríguez and Hueda35). Diet quality indices were developed based on the target group for which they were intended to be used. Different age and sex groups have different requirements due to differences in food preferences and physiological needs. However, there are diet quality indices that have been developed for a wide population group, such as HEI-2010(Reference Guenther, Casavale and Reedy36). Furthermore, there are also country-specific indices which have been developed based on native food-based dietary guidelines that are tailored to a country’s specific disease profile and food habits. These diet quality indices have been important indicators for within-country comparison(Reference Trijsburg, Talsma and De Vries37).
The present review supports the existence of an association between poor diet quality and low SES among older adults. The majority of the studies (90 %) included in the present review reported that older adults with low SES had poor diet quality, with the exception of one study by Rajhans & Sharma(Reference Rajhans and Sharma24), which reported no association. The study by Rajhans & Sharma(Reference Rajhans and Sharma24) found an insignificant association between income and energy intake. Instead, the study only found an association between energy intake and age where mean energy intake was higher in those aged 60–70 years than in those of 70–80 years of age(Reference Rajhans and Sharma24). Several studies have reported a positive association between low income and poor diet quality score(Reference Francis-Granderson and Pemberton19,Reference Holmes and Roberts21,Reference Maila, Audain and Marinda26) , lower fruit and vegetable variety(Reference Conklin, Forouhi and Suhrcke18), lower adherence to the fruit and fish guidelines(Reference Dijkstra, Neter and Brouwer20), food insecurity and perceived poor diet quality(Reference Chang and Hickman23) and lower adherence to the Mediterranean diet(Reference Katsarou, Tyrovolas and Psaltopoulou22). The study by Francis-Granderson & Pemberton(Reference Francis-Granderson and Pemberton19), which used the HEI as the tool for diet quality assessment, found that 6·3 % of low-income older adults have poor diet quality and the majority of subjects (83·3 %) needed dietary improvement. Another study using the Diet Diversity Score that was conducted among older adults in a poor province in Zambia found that most of the subjects (64·4 %) had low dietary diversity, which indicated lack of accessibility to a wide variety of food(Reference Maila, Audain and Marinda26).
Risk factors of poor diet quality among older adults with low socio-economic status
With an increasing interest in understanding the association between poor diet quality among older adults with low SES, eight of the studies included in the present review investigated the risk factors contributing to the relationship(Reference Shahar, Vanoh and Mat Ludin5,Reference Conklin, Forouhi and Suhrcke18-Reference Chang and Hickman23,Reference Arjuna, Soenen and Hasnawati25) . The most important risk factor of poor diet quality especially among older adults with low SES is financial hardship and four studies found this to be a risk factor(Reference Shahar, Vanoh and Mat Ludin5,Reference Conklin, Forouhi and Suhrcke18,Reference Dijkstra, Neter and Brouwer20,Reference Arjuna, Soenen and Hasnawati25) . Conklin et al. (Reference Conklin, Forouhi and Suhrcke18) reported significant differences in mean fruit and vegetable variety intake among subjects with different levels of financial hardship (FH), whereby the group with the highest financial hardship reported the least variation of fruit and vegetable intake. In addition, Arjuna et al. (Reference Arjuna, Soenen and Hasnawati25) also reported that intakes of protein, fibre, vitamins and minerals were positively correlated with level of income and education. This is consistent with the findings from the study by Dijkstra et al. (2014)(Reference Dijkstra, Neter and Brouwer20) where lower income levels were independently associated with lower adherence to fruit and fish guidelines. These differences might be explained by the fact that fruit and fish as well as a healthy diet, such as nuts, legumes and seeds, may be perceived as being expensive as compared with a less healthy diet(Reference Blakely, Mhurchu and Jiang38,Reference Waterlander, De Haas and Van Amstel39) .
Apart from income, the risk factors identified in the present review affecting poor diet quality among older adults with low SES are sex, geographical area, transportation availability and living status. Francis-Granderson & Pemberton(Reference Francis-Granderson and Pemberton19) found that one of the strongest predictors of HEI score was sex. Older men had better HEI scores compared with females. This may be associated with the cultural socialisation of males in society where males are better provided for or taken care of by their female partners(Reference Francis-Granderson and Pemberton19). Another identified risk factor was geographical location or place of residence. Katsarou et al. (Reference Katsarou, Tyrovolas and Psaltopoulou22) found a significant association between place of residence and the Mediterranean Diet Score. The study found that individuals residing in rural areas adhered more closely to the traditional Mediterranean dietary pattern as compared with those living in urban areas. On the other hand, Shahar et al. (Reference Shahar, Vanoh and Mat Ludin5) found that there was lower fruit intake by older individuals staying in rural areas in Malaysia. Location of residence is indeed an important factor affecting the eating pattern of an individual, especially those residing in rural areas that lack accessibility to various foods due to fewer supermarkets and large grocery stores. Rural areas were found to be only equipped with small stalls with limited food choices and this narrowed the purchasing choices of fruits by older adults(Reference Shahar, Vanoh and Mat Ludin5). Besides that, lack of transport to purchase food and a far distance of the shops from home may contribute to poor diet quality among older adults with low SES, especially for those living alone or with their spouse(Reference Wunderlich, Brusca and Johnson-Austin40). An ‘empty nest’ is very prevalent among older adults, especially those with low SES as their children migrate to cities for to seek job opportunities(Reference Chen, Yang and Aagard41).
Poor diet quality among older adults with low SES is also related to functional limitations. Chang & Hickman(Reference Chang and Hickman23) reported that functional limitation was positively associated with the likelihood of food insecurity, increasing the odds by 75 %. Functional limitations in low-income older adults were associated with 65 % higher odds of perceived poor-quality diet due to the physical barrier in accessing and preparing healthy foods(Reference Chang and Hickman23). This condition was further worsened by economic hardship due to meagre earnings and chronic healthcare burden associated with disability. Besides that, living arrangements may contribute to the perceived poor diet quality among older adults(Reference Chang and Hickman23). It was found that living with a non-partner adult was associated with 67 % higher odds of perceived poor diet quality as compared with those living with a partner. Furthermore, for older adults who lived with their partner, the association of physical functionality with food insecurity and perceived diet quality was much weaker. Spouses had a crucial role in ensuring healthy food preparation for older adults with functional impairment. Lack of spousal support may contribute to increased complexity of adaptation to the food environment for older adults with functional limitation.
Another risk factor of poor diet quality among older adults with low SES is smoking. Holmes & Roberts (2011)(Reference Holmes and Roberts21) reported that being a current smoker was an independent predictor of poor diet quality. Holmes & Roberts(Reference Holmes and Roberts21) demonstrated that older adults who smoked consumed less fruit and vegetables and more white bread and processed meats as compared with non-smokers(Reference Holmes and Roberts21). Smokers had lower intakes of vitamin C, folate, K, Mg, Fe and iodine. In agreement with this, Katsarou et al. (Reference Katsarou, Tyrovolas and Psaltopoulou22) found smoking to be associated with Mediterranean Diet Score. Older adults with a current smoking habit were found to have poor adherence to the traditional Mediterranean diet.
Besides that, Holmes & Roberts(Reference Holmes and Roberts21) also found that having difficulty in chewing was another independent predictor of poor diet quality. Older adults who had chewing difficulties consumed significantly lower amounts of vegetables, meat or meat dishes and wholemeal bread, and thus had lower intakes of protein, folate and K. Poor dentition is indeed a main problem affecting the dietary intake of older adults. Modification in food preparation such as preparing a soft diet, cutting the vegetables and meat in smaller pieces, cooking the meat till soft, and dipping bread in beverages are strategies which can be implemented by older adults or their caregivers to improve dietary intake. Other studies not included in the review also reported that oral-related problems including gum diseases, tooth decay, dentures, infection and chewing problems might interfere with fruit intake(Reference Hafizah, Zahara and Noramilin42,Reference Nicklett and Kadell43) .
Strengths and limitations
The present review is a current analysis of the prevalence of malnutrition, poor diet quality and its associated risk factors among older adults with low SES which included studies from 2009 to 2019, comprising the current publications regarding ‘malnutrition’ and ‘diet quality’. However, limitations were that the studies included in the review are observational studies where all studies are cross-sectional and cannot be used to imply causality. Moreover, this review only included articles that were published in English and thus could have missed other research related to the review that was published in other languages.
Conclusion
In summary, the review found that the prevalence of malnutrition among older adults with low SES varied between Asian and non-Asian countries due to the differences in the assessment tool used for screening malnutrition. The prevalence range among low-SES older adults in Asian countries ranged from as low as 3 % to as high as 64·9 %, while in the non-Asian countries, prevalence was between 28·9 and 48·0 %. In addition to this, a total of 90 % of the studies included in this review demonstrated that older adults with low SES had poor diet quality. Several risk factors have been found to be associated with poor diet quality among older adults with low SES including sex, place of residence, functional limitations, living arrangements, smoking and oral health. Thus, it is important to establish nutrition-related programmes targeting low-SES individuals for educating them on dietary choices, appropriate portion size and food modification. Government policies should implement several strategies to improve the quality of life of poor older adults such as monthly subsidies for food, providing free healthy food, free meals for disabled or older adults living alone and providing weekly transport for those residing in rural areas to purchase food from wholesale markets.
Acknowledgements
We would like to thank the Universiti Sains Malaysia librarian for their guidance and advice in the literature search.
The present review received no funding from any organisation or agency.
N. S. N. was responsible for methodology, formal analysis, resources, literature search and data analysis. D. V. was responsible for conceptualisation, methodology, validation, writing the review and editing, and supervision. S. K. L. was responsible for methodology, supervision, writing the review and editing. All authors contributed equally and agreed upon the submission of this manuscript.
There are no conflicts of interest.


