


Introduction
Thermometabolism is a key feature in theevolution of vertebrates. Two thermogenetic regimes have been identified: endothermy and ectothermy. The first regime involves the production of metabolic heat through nonshivering thermogenesis (Clarke and Pörtner Reference Clarke and Pörtner2010; Rowland et al. Reference Rowland, Bal and Periasamy2015), whereas in the second regime, the heat is mainly captured from the environment by behavioral adjustments (Clarke and Pörtner Reference Clarke and Pörtner2010; Rowland et al. Reference Rowland, Bal and Periasamy2015). Endotherms have a more elevated body temperature and a higher metabolic rate (i.e., the rate of oxygen consumption measured in ml(O2) h−1) than ectotherms (Clarke and Pörtner Reference Clarke and Pörtner2010).
The origin of mammalian and avian endothermy (the only extant endothermic vertebrates) is a central question in evolutionary biology, because higher metabolic rates allow an extension of potential ecological niches, a higher growth rate, and better stamina for active behaviors (McNab Reference McNab1978; Bennett and Ruben Reference Bennett and Ruben1979; Walter and Seebacher Reference Walter and Seebacher2009). Its presence in both non-avian dinosaurs and non-mammalian synapsids has been extensively investigated using many proxies (e.g., de Ricqlès Reference Ricqlès1974; Ruben Reference Ruben1995; Amiot et al. Reference Amiot, Lécuyer, Buffetaut, Escarguel, Fluteau and Martineau2006; Cubo et al. Reference Cubo, Roy, Martinez-Maza and Montes2012; Ruben et al. Reference Ruben, Hillenius, Kemp, Quick and Chinsamy-Turan2012; Legendre et al. Reference Legendre, Guénard, Botha-Brink and Cubo2016; Rey et al. Reference Rey, Amiot, Fourel, Abdala, Fluteau, Jalil, Liu, Rubidge, Smith, Steyer, Viglietti, Wang and Lécuyer2017). However, in recent years, another group has been drawing the attention of paleobiologists: Pseudosuchia. Seymour et al. (Reference Seymour, Bennett-Stamper, Johnston, Carrier and Grigg2004) analyzed the pulmonary and cardiovascular systems of extant crocodilians and suggested that archosaurs were ancestrally/primitively endothermic endotherms. These features include the crocodilian four-chambered heart (Seymour et al. Reference Seymour, Bennett-Stamper, Johnston, Carrier and Grigg2004) and the complex arrangement of pulmonary bronchia (Seymour et al. Reference Seymour, Bennett-Stamper, Johnston, Carrier and Grigg2004; Farmer and Sanders Reference Farmer and Sanders2010; Sanders and Farmer Reference Sanders and Farmer2012; Farmer Reference Farmer2015), similar to those observed in birds. Farmer and Sanders (Reference Farmer and Sanders2010) showed that, more than the general anatomy of the pulmonary system, birds and crocodiles share a unidirectional air flow during respiration, a feature allowing birds to achieve high metabolic rates.
However, despite all these features, crocodilians (as ectotherms) do not display a high metabolic rate (Seymour et al. Reference Seymour, Gienger, Brien, Tracy, Charlie Manolis, Webb and Christian2013). Seymour et al. (Reference Seymour, Bennett-Stamper, Johnston, Carrier and Grigg2004) suggested that the presence of these features in crocodilians is a legacy from their archosaurian endothermic ancestor. It would be congruent with other particularities, such as the presence of fibrolamellar bone (Padian et al. Reference Padian, Horner and de Ricqlès2004; Tumarkin-Deratzian Reference Tumarkin-Deratzian2007) and the fast evolution of their mitochondrial genome (Janke and Arnason Reference Janke and Arnason1997; Janke et al. Reference Janke, Erpenbeck, Nilsson and Arnason2001), potentially related to high metabolic rate (Seymour et al. Reference Seymour, Bennett-Stamper, Johnston, Carrier and Grigg2004).
Using quantitative bone histology, Legendre et al. (Reference Legendre, Guénard, Botha-Brink and Cubo2016) concluded that the last common ancestor of all archosaurs possessed a high metabolic rate and was endothermic. Therefore, one can ask when (both temporally and phylogenetically) pseudosuchians lost their endothermy. Seymour et al. (Reference Seymour, Bennett-Stamper, Johnston, Carrier and Grigg2004) proposed a reversion sometime during the Jurassic (201–145 Ma), concomitant with the spread of ambush-type predation and semiaquatic lifestyle of numerous crocodylomorphs, features strongly associated with the particularities of extant crocodilians’ cardiovascular systems. While Legendre et al. (Reference Legendre, Guénard, Botha-Brink and Cubo2016) concluded that archosaurs were ancestrally endothermic, their sample did not allow testing Seymour et al.'s (Reference Seymour, Bennett-Stamper, Johnston, Carrier and Grigg2004) hypothesis about a reversion to ectothermy in crocodylomorphs.
Legendre et al. (Reference Legendre, Guénard, Botha-Brink and Cubo2016) included aetosaurs and rauisuchians in their sample, and their results suggest that all non-crocodylomorph pseudosuchians were endothermic. Since then, new studies brought more data to this subject. Hence, Séon et al. (Reference Séon, Amiot, Martin, Young, Middleton, Fourel, Picot, Valentin and Lécuyer2020) used isotopic geochemistry to infer the body temperature (T b) of thalattosuchians. They inferred ectothermy in Teleosauridae, and a more complex picture in Metriorhynchidae, interpreted as being heterothermic endotherms. Moreover, using quantitative histology, Cubo et al. (Reference Cubo, Sena, Aubier, Houee, Claisse, Faure-Brac, Allain, Andrade, Sayão and Oliveira2020) suggested a common ectothermic ancestor for all notosuchians. Thus, assuming that archosaurs are primitively endotherms, these findings raise two parsimonious possibilities: either a single reversion to ectothermy at the node Crocodylomorpha (or before), and then a reoccurrence of endothermy in metriorhynchids, or converging losses of endothermy in Teleosauridae, Notosuchia, and Eusuchia. Therefore, the thermometabolic status of Metasuchia must be elucidated. While we are aware of the status of extant ectothermic crocodilians and notosuchians, neither Goniopholididae nor Dyrosauridae has been analyzed to date. The aim of this study is to infer the thermometabolic condition of both groups using for the first time two independent proxies in an integrative approach: bone paleohistology and stable isotope geochemistry. Different proxies have been proposed to infer the thermometabolism of extinct species. Some authors looked for the presence of morphological features, such as fur or feathers and respiratory turbinates, as indicators of the presence of homeothermy, which is strongly associated with endothermy (e.g., Ruben Reference Ruben1995; Ji et al. Reference Ji, Luo, Yuan and Tabrum2006; Ruben et al. Reference Ruben, Hillenius, Kemp, Quick and Chinsamy-Turan2012; Zhou et al. Reference Zhou, Wu, Martin and Luo2013). However, these features are only indirectly linked to endothermy, and the potential causal links are still being debated. Other studies proposed the modeling of the thermic exchange with the environment based on the 3D reconstruction of extinct organisms (e.g., Florides et al. Reference Florides, Kalogirou, Tassou and Wrobel2001). Another possibility is the study of cardiovascular physiology, as several parameters are associated with the metabolic rate (for a review, see Seymour Reference Seymour2013, Reference Seymour2016). Bone histology was extensively used in this area, both qualitatively and quantitatively, for its strong connection with metabolic rate (e.g., de Ricqlès Reference Ricqlès1974; Padian et al. Reference Padian, Horner and de Ricqlès2004; Montes et al. Reference Montes, Le Roy, Perret, de Buffrénil, Castanet and Cubo2007; Olivier et al. Reference Olivier, Houssaye, Jalil and Cubo2017; Fleischle et al. Reference Fleischle, Wintrich and Sander2018; Cubo and Jalil Reference Cubo and Jalil2019; Faure-Brac and Cubo Reference Faure-Brac and Cubo2020). Finally, stable isotope geochemistry was extensively used to infer the body temperature of extinct species (Amiot et al. Reference Amiot, Lécuyer, Buffetaut, Escarguel, Fluteau and Martineau2006; Bernard et al. Reference Bernard, Lécuyer, Vincent, Amiot, Bardet, Buffetaut, Cuny, Fourel, Martineau, Mazin and Prieur2010; Rey et al. Reference Rey, Amiot, Fourel, Abdala, Fluteau, Jalil, Liu, Rubidge, Smith, Steyer, Viglietti, Wang and Lécuyer2017; Séon et al. Reference Séon, Amiot, Martin, Young, Middleton, Fourel, Picot, Valentin and Lécuyer2020).
Bone Histology
Amprino (Reference Amprino1947) proposed that the structure of bone tissue records the bone growth rate (BGR). This finding was corroborated by Montes et al. (Reference Montes, Castanet and Cubo2010) in a phylogenetic context. In parallel, a link between BGR and resting metabolic rate (RMR, a standardized metabolic rate taking account of the effect of body mass) was shown by Montes et al. (Reference Montes, Le Roy, Perret, de Buffrénil, Castanet and Cubo2007). It is worth noting that the first relationship had been tested experimentally (Starck and Chinsamy Reference Starck and Chinsamy2002), whereas the relationship between RMR and BGR is correlational. A test of a causal relationship is lacking. Although correlational, we can use the quoted relationship to infer the RMR of extinct species using bone structure in phylogenetic comparative approaches.
Two mechanisms of osteogenesis that produce different bone structures have been described. The first, static osteogenesis (SO), is related to high BGR. SO quickly produces highly vascularized bone tissues composed of woven bone (isotropic fibers) and globular osteocyte lacunae displaying radiating canaliculi (Marotti Reference Marotti2010; Prondvai et al. Reference Prondvai, Stein, de Ricqlès and Cubo2014; Stein and Prondvai Reference Stein and Prondvai2014; Cubo et al. Reference Cubo, Hui, Clarac and Quilhac2017). The second, dynamic osteogenesis (DO), is associated with low BGR. DO produces nearly to completely avascular bones composed of parallel fibered bone that appears either as anisotropic tissue containing elongated lacunae when fibers run perpendicular to the direction of transmission of cross-polarized light or as isotropic and containing pinhead-shaped lacunae when fibers run parallel to the direction of transmission of cross-polarized light (Marotti Reference Marotti2010; Prondvai et al. Reference Prondvai, Stein, de Ricqlès and Cubo2014; Stein and Prondvai Reference Stein and Prondvai2014; Cubo et al. Reference Cubo, Hui, Clarac and Quilhac2017). To sustain rapid growth, SO requires higher amounts of energy than does DO, that is, a higher metabolic rate (Montes et al. Reference Montes, Le Roy, Perret, de Buffrénil, Castanet and Cubo2007). However, identifying SO structures is not a sufficient criterion to suggest an endothermic condition, as exceptions occur, notably in extant crocodilians (Padian et al. Reference Padian, Horner and de Ricqlès2004; Tumarkin-Deratzian Reference Tumarkin-Deratzian2007).
As an alternative, Legendre et al. (Reference Legendre, Guénard, Botha-Brink and Cubo2016) proposed to use a phylogenetic comparative method, phylogenetic eigenvector maps (PEM; Guénard et al. Reference Guénard, Legendre and Peres-Neto2013) to infer RMR values for extinct species using histological variables and phylogenetic relationships of a sample of extant vertebrates as explanatory variables. This method of quantitative histology was extensively used in various groups of vertebrates and provided promising results (Legendre et al. Reference Legendre, Guénard, Botha-Brink and Cubo2016; Olivier et al. Reference Olivier, Houssaye, Jalil and Cubo2017; Fleischle et al. Reference Fleischle, Wintrich and Sander2018; Cubo and Jalil Reference Cubo and Jalil2019; Cubo et al. Reference Cubo, Sena, Aubier, Houee, Claisse, Faure-Brac, Allain, Andrade, Sayão and Oliveira2020; Faure-Brac and Cubo Reference Faure-Brac and Cubo2020). As endothermy necessitates high RMR to fuel heat production, inferring the latter seems an appropriate proxy to infer the thermometabolic regime of extinct taxa.
Recently, another approach using quantitative histology was proposed by Huttenlocker and Farmer (Reference Huttenlocker and Farmer2017). They showed a high correlation between red blood cell (RBC) width (RBCw) and area (RBCa) with the size of the bone vascular cavities. This finding is consistent with the observation that the smallest RBCs are found in vertebrates with the highest energetic expenditure, that is, the highest metabolic rate (mammals and birds). Indeed, smaller RBCs are associated with faster O2 kinetic uptake (Holland and Forster Reference Holland and Forster1966), allowing higher metabolic rates. Huttenlocker and Farmer (Reference Huttenlocker and Farmer2017) were able to infer RBC width and area for extinct species using quantitative histology, and their methodology was then applied by Cubo et al. (Reference Cubo, Sena, Aubier, Houee, Claisse, Faure-Brac, Allain, Andrade, Sayão and Oliveira2020), using PEM, with success. The combined use of these proxies is valuable, as they produce independent inferences for the same variable, thermometabolism.
Isotopic Geochemistry: Basic Principles
Relationships between Vertebrate Body Water, Diet Water, and Ambient Water
The oxygen isotope composition of phosphate in vertebrate apatite (δ18Op) depends on both the mineralization temperature of the skeleton and the oxygen isotope composition of its body water (δ18Obw) (Kolodny et al. Reference Kolodny, Luz and Navon1983; Longinelli Reference Longinelli1984; Luz et al. Reference Luz, Kolodny and Horowitz1984). For all vertebrates, the δ18Obw value depends on the oxygen isotope composition of diet water (δ18Odw), which mainly includes drinking water and water-bearing solid food (e.g., leaves, herbs, roots, meat). The oxygen isotope composition of diet water is itself directly related to the oxygen isotope composition of ambient water (δ18Oaw); which means freshwater (river, lake) or seawater (δ18Osw) for aquatic vertebrates and meteoric waters (δ18Omw) for terrestrial vertebrates (Luz et al. Reference Luz, Kolodny and Horowitz1984; D'Angela and Longinelli Reference D'Angela and Longinelli1990; Kohn Reference Kohn1996; Langlois et al. Reference Langlois, Simon and Lécuyer2003). Aquatic vertebrates such as fish have δ18Obw values similar to those of the water masses where they live. In the case of semiaquatic vertebrates, δ18Obw values are influenced by their aquatic environments but also by a combination of input and output oxygen fluxes. Input oxygen fluxes to the animal body are air through the lungs and associated water vapor, food, and drinking water. Output oxygen fluxes from the animal body are feces and urinary water, urea or uric acid, transcutaneous and exhaled water vapor (via respiration or, for some mammals like carnivores, via panting), and expired carbon dioxide (Fig. 1).

Figure 1. Diagram summarizing the inputs (black arrows) and outputs (gray arrows) of oxygen between a living organism and its environment. The white arrow indicates the fractionation occurring during the mineralization of the bones. From ambient water (gathering all possible sources of water, see text), the oxygen is incorporated into the drinking water and the solid food (with both water and oxygen bound to it). Both of these sources constitute the diet water that is incorporated in the body water. The drinking water is itself from the different sources of ambient waters. The crocodilian shape used was obtained on phylopic.org.
Considering the oxygen isotope fractionation that takes place during evapotranspiration (evaporation of body water) and the combustion of food by atmospheric oxygen that has a δ18O value much higher (+23‰) than those of other reservoirs (−3‰ < δ18Osw < +2‰; −30‰ < δ18Omw < +2‰), δ18Obw values commonly increase by a value between 0 and +2‰ for most known semiaquatic and air-breathing vertebrates (Barrick et al. Reference Barrick, Fischer and Showers1999; Amiot et al. Reference Amiot, Lécuyer, Escarguel, Billon-Bruyat, Buffetaut, Langlois, Martin, Martineau and Mazin2007). Such heavy oxygen isotope enrichment of the body water relative to the diet water may reach up to +6‰ for terrestrial vertebrates (Longinelli Reference Longinelli1984; Wolf et al. Reference Wolf, Newsome, Fogel and Del Rio2013).
Relationships between Vertebrate Body Temperature and Ambient Water
In the framework of this study, the calculation of crocodylomorph body temperature is performed according to the following protocol and assumptions:
• The enrichment in heavy oxygen isotope (18O relative to 16O) of crocodylomorph body water relative to ambient water does not exceed +2‰ (Amiot et al. Reference Amiot, Lécuyer, Escarguel, Billon-Bruyat, Buffetaut, Langlois, Martin, Martineau and Mazin2007).
• The generic equation, which relates the δ18Op to mineralization temperature T and δ18Ow, is expressed as follows according to Kolodny et al. (Reference Kolodny, Luz and Navon1983) as modified by Lécuyer et al. (Reference Lécuyer, Amiot, Touzeau and Trotter2013):
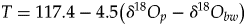
(1)becoming equation (2) $$T = 117.4-4.5( {\delta {}_{}^{18} O_p-\delta {}_{}^{18} O_{aw}} ) $$(2)when transposed to the case of aquatic or semiaquatic vertebrates.$$T = 117.4-4.5\left( {\delta {}_{}^{18} O_p-\delta {}_{}^{18} O_{bw}} \right)$$
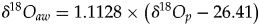
• The use of isotopic fractionation equations that relate δ18Op to δ18Oaw in the case of extant mammals, theropods, and turtles. ○ For mammals (Amiot et al., Reference Amiot, Lécuyer, Buffetaut, Fluteau, Legendre and Martineau2004):
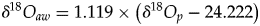
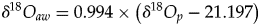
(3)○ For theropods (Amiot et al., Reference Amiot, Wang, Zhou, Wang, Lécuyer, Buffetaut, Fluteau, Ding, Kusuhashi, Mo, Philippe, Suteethorn, Wang and Xu2015):$$\delta {}_{}^{18} O_{aw} = 1.1128 \times \left( {\delta {}_{}^{18} O_p-26.41} \right)$$(4)○ For turtles (Barrick et al. Reference Barrick, Fischer and Showers1999, modified by Pouech et al. Reference Pouech, Amiot, Lécuyer, Mazin, Martineau and Fourel2014):$$\delta {}_{}^{18} O_{aw} = 1.119 \times \left( {\delta {}_{}^{18} O_p-24.222} \right)$$(5)$$\delta {}_{}^{18} O_{aw} = 0.994 \times \left( {\delta {}_{}^{18} O_p-21.197} \right)$$• The oxygen isotope composition of ambient water δ18Oaw (mainly derived from meteoric waters) is estimated by using fractionation equations applied to theropods, mammals, or turtles co-occurring with studied dyrosaurids and †Goniopholis.
• Finally, equation (2) is solved for body temperature, T b, by using previously calculated δ18Oaw (equations 3–5) with the addition of body water 18O-enrichment to obtain δ18Obw and measured δ18Op of Dyrosauridae and †Gonophiolis.

Graphic Representation of Calculations and Data for Discussion of the Thermophysiological Status
Calculations and data are finally highlighted by using a δ18Op–δ18Oaw bivariate plot that discriminates between the fields of ectothermic–poikilothermic and endothermic–homeothermic vertebrate taxa. Those fields are constructed on the basis of a nomogram that represents body isotherm values. If tested dyrosaurids and †Goniopholis had ecto-poikilothermic thermophysiologies including behavioral thermoregulation similar to those of extant crocodilians, their T b values would fall within a preferred range of 26°C–36°C (Markwick Reference Markwick1998). If they were endotherms, then their body temperature would most likely fall within the 36°C–40°C range, as in most modern endotherms. Thus, the distribution of data in the predefined fields of body temperatures will offer a basis for discussing the thermophysiological status of vertebrate taxa studied.
To infer the thermometabolic condition of Goniopholididae and Dyrosauridae, both bone histology and isotopic geochemistry were used. We describe the bone cross sections of two specimens of these groups and use them to infer RMR, RBCw, and RBCa using quantitative histology. We use already published isotopic data for Goniopholididae and present here new isotopic data for Dyrosauridae, with the aim of estimating their T b. Finally, we propose a putative state of their thermometabolism using all these parameters. The null hypothesis is that they were ectothermic organisms because of their phylogenetic proximity and ecological similarity with extant crocodilians.
Materials and Methods
Material
Quantitative Histology
Two extinct species were studied: †Goniopholis simus Owen, Reference Owen1879 from the Berriasian (Early Cretaceous) of Cherves-de-Cognac, France (Muséum national d'Histoire naturelle/Paris Museum of Natural History: MNHN CHE.02.046) and †Dyrosaurus sp. Pomel, Reference Pomel1894 from the Ypresian (Eocene) of North Africa. For all species, both extinct and extant, we studied the femur.
Their data were incorporated into two datasets comprising histological variables and the variables of interest (RMR or RBC width/area) of a set of extant species. Both datasets are from Cubo et al. (Reference Cubo, Sena, Aubier, Houee, Claisse, Faure-Brac, Allain, Andrade, Sayão and Oliveira2020). The first one, used in RMR inferences, comprises 18 extant species. The second one, used in RBC inferences, comprises 14 extant species. The complete list of included species is given in the Supplementary Material and Methods.
Isotopic Geochemistry
Depending on the amount of available material, we sampled enamel or a mixture of enamel–dentine of several teeth coming from Paleocene dyrosaurid crocodylomorphs, from the pantodont eutherian †Alcidedorbignya inopinata de Muizon & Marshall, Reference Muizon and Marshall1992, both provided by C. de Muizon, and a shell bony plate from the Podocnemidid turtle †Roxochelys sp. Price, Reference Price1953 recovered from the paleontological site of Tiupampa (Bolivia). The details of the samples are given in Supplementary Table 1.
Geochemical data of †Goniopholis sp. and its associated fauna from the Berriasian site of Cherves-de-Cognac (France) were already published by Pouech et al. (Reference Pouech, Amiot, Lécuyer, Mazin, Martineau and Fourel2014). A selection of relevant values including mammals, turtles and theropod dinosaurs was then reanalyzed in terms of †Goniopholis T b.
Methods
Preparations of Sections
Thin sections of †Goniopholis simus and †Dyrosaurus sp. were prepared at the closest possible level to the middle of the diaphysis. For each species, one cross section from the mid-shaft of a femur was prepared and consequently analyzed. They were mounted on a glass slide following the method described in Lamm (Reference Lamm, Padian and Lamm2013). These sections were deposited at the vertebrate hard tissues histological collection of the MNHN, where they are available upon request to the curator, with the respective access numbers MNHN-F-Histos-2751 (†Goniopholis) and MNHN-F-Histos-2752 (†Dyrosaurus). The histological terminology follows Francillon-Vieillot et al. (Reference Francillon-Vieillot, de Buffrénil, Castanet, Géraudie, Meunier, Sire, Zylberberg, de Ricqlès and Carter1990) with addenda and revision from Prondvai et al. (Reference Prondvai, Stein, de Ricqlès and Cubo2014).
Cross sections were observed under a Nikon Eclipse E600 POL microscope, either in linearly polarized light (LPL) or in cross-polarized light (XPL) with a lambda wave plate, in order to determine the nature of bone tissue in each topologic region using patterns of isotropy/anisotropy (Bromage et al. Reference Bromage, Goldman, McFarlin, Warshaw, Boyde and Riggs2003; Faure-Brac et al. Reference Faure-Brac, Pelissier and Cubo2019). Variations in isotropy allowed us to assess orientation and organization of collagen fibers. Anisotropic fibers, which appear blue/yellow under XPL with a lambda compensator, are highly organized and parallel thus and perpendicular to the direction of propagation of XPL. For isotropic fibers, which appear red under XPL with a lambda compensator, two possibilities exist: either fibers lie in parallel and are parallel to the direction of propagation of XPL (i.e., cut transversally) or woven bone (for a review, see Faure-Brac et al. Reference Faure-Brac, Pelissier and Cubo2019).
Histological Variables
Pictures were taken at different magnifications and analyzed with the software ImageJ v. 1.8.0_172 (Rasband Reference Rasband1997) to quantify the different histological variables. Three were quantified: relative primary osteon area (RPOA) for RMR inferences (described as primary osteon density by Fleischle et al. Reference Fleischle, Wintrich and Sander2018) and harmonic mean caliber (HMC) and minimal caliber (canmin) of vascular cavities for inferences of RBC width/area (Huttenlocker and Farmer Reference Huttenlocker and Farmer2017).
RPOA was quantified as described by Fleischle et al. (Reference Fleischle, Wintrich and Sander2018): an area is delimited in the deepest primary cortex, and the surface occupied by primary osteons is quantified (see Fig. 2A). To quantify this variable in the deep, primary cortex is necessary, because our sample of extant animals only contains juveniles: therefore, in extinct adult taxa, we have to analyze the bone tissue placed as close as possible to their initial growth stage. RPOA corresponds to the ratio between the quoted variables:
 $$RPOA = S_{osteon}/S_{total}$$
Figure 2. Example of the quantification of variables in the histological section of †Goniopholis simus. A, Inner layer, close to the medulla. The area of the green circle constitutes the S total of the relative primary osteon area (RPOA), and the S osteon is the sum of all areas of the blue circles (equation 6). B, Outer layer. The green circles identify the vascular canals. As shown in the zoomed part, an ellipse is fit by the software in the circle, and the minimal axis is used in the harmonic mean caliber (HMC) computation (equation 7). Scale bars, 100 μm.
where S osteon is the surface occupied by primary osteons, and S total is the surface of the studied area. If some secondary bone is present in the total area, its surface is deducted from the S total before the calculation of RPOA.
HMC and canmin of vascular canals were quantified in the outer cortex, as our sample of extant animals is composed of adults only. In accordance with Huttenlocker and Farmer (Reference Huttenlocker and Farmer2017), up to fifty canals were quantified in each section (see Fig. 2B). We delineated canals and fit the largest ellipse in them. Then, we measured the minimal axis. HMC was calculated using the following equation:
 $$HMC = \displaystyle{n \over {\mathop \sum \nolimits_{i = 1}^n ( {1/x_i} ) }}$$
where n is the number of measured vascular cavities, and xi the value of the minimal axis for the i th cavity. canmin is simply the smallest minimal axis in our sample. The dataset of extant species used to infer RMR is from Cubo et al. (Reference Cubo, Sena, Aubier, Houee, Claisse, Faure-Brac, Allain, Andrade, Sayão and Oliveira2020), and the dataset used to infer RBC variables is from Huttenlocker and Farmer (Reference Huttenlocker and Farmer2017). All values for the extinct species were quantified in this study.
Phylogeny
Two phylogenies were used, one for each set of taxa. The phylogeny used to infer RMR is an amended tree taken from Cubo et al. (Reference Cubo, Sena, Aubier, Houee, Claisse, Faure-Brac, Allain, Andrade, Sayão and Oliveira2020), and the one used to infer RBC variables is amended from Huttenlocker and Farmer (Reference Huttenlocker and Farmer2017). In both cases, extinct species were removed and replaced with †Dyrosaurus sp. and †Goniopholis simus. Their placement follows the consensual phylogeny presented by Puértolas-Pascual et al. (Reference Puértolas-Pascual, Young and Brochu2020). As the phylogenetic comparative method necessitates branch lengths, we dated the trees using the minimal age of apparition of each node. Branch lengths reflect, then, the time between the apparition of two successive nodes, or between a node and a leaf. Age of a given node was computed as the minimal age of the oldest fossil included in it and was taken from the Paleobiology Database (https://paleobiodb.org, last accessed 28 June 2020).
Phylogenetic Eigenvector Maps
A summary of the principal steps of the protocol is presented here. The full protocol is available in Guénard et al. (Reference Guénard, Legendre and Peres-Neto2013) and in the Supplementary Material and Methods. PEM operates in two steps: (1) the construction of predictive models and the selection of the better performing one and (2) the inference of extinct species’ values. For each of the three analyses, a model is chosen among a set of models comprising (1) a model including the phylogeny and the values of the studied variable of extant species and (2) many models comprising the phylogeny, the values of the studied variable of extant species, and one histological variable. After the choice of the model through the use of a corrected Akaike's information criteria (AICc), inferences of RMR values and RBC dimensions for extinct species are computed. We used the package MPSEM (Guénard et al. Reference Guénard, Legendre and Peres-Neto2013), with the software R v. 3.5.1 (R Development Core Team 2008). The script, data, and phylogenies used are given in the Supplementary Files.
Isotopic Geochemistry
Chemical preparation and measure of the oxygen isotope composition of tooth and bone apatite phosphate were realized following the protocol published in Lécuyer et al. (Reference Lécuyer, Grandjean, O'Neil, Cappetta and Martineau1993) and detailed in the Supplementary Material and Methods. Phosphate from tooth enamel and bone was isolated in the form of silver phosphate crystals that were pyrolyzed at 1450°C using an elemental analyzer and then analyzed with an isotopic ratio mass spectrometer.
The measurements were calibrated by performing a two-point calibration using the international reference materials NBS120c (δ18OVSMOW = 21.7‰; Lécuyer et al. Reference Lécuyer, Grandjean, O'Neil, Cappetta and Martineau1993) and NBS127 (BaSO4, δ18OVSMOW = 9.34‰; Gonfiantini et al. Reference Gonfiantini, Stichler and Rozanski1995). Isotopic compositions are quoted in the standard δ notation relative to VSMOW. Silver phosphate precipitated from standard NBS120c (natural Miocene phosphorite from Florida) was repeatedly analyzed (δ18O = 21.76 ± 0.12‰; n = 20) along with the silver phosphate samples derived from the vertebrate remains. Chemical extraction, analyses, and measurements were performed at the Laboratoire de Géologie de Lyon–Terre, Planète, Environnement.
Results
Histological Description
†Goniopholis simus
The bone is partly fractured and invaded by fungi, making observations difficult to interpret in some places, especially in the posterior and dorsal areas (Fig. 3A). Fractured regions are not problematic: borders coincide most of the time, suggesting only a displacement of limited parts of the bone without loss of material. Regions invaded by fungi are especially problematic, as the fungi hide histological features of interest, such as the fibers’ organization. The majority of the section, however, displays a good preservation, allowing us to infer an interpretation of the paleobiology of †Goniopholis.

Figure 3. Histological section of †Goniopholis simus. A, General view of the cross section. The arrows indicate the orientation of the section (A: anterior, P: posterior, V: ventral, D: dorsal). Picture obtained using a Hirox 2000 microscope. B, Details of the anterior region of the section. Red layers are high growth-rate layers and dark blue layers are low growth-rate layers. Layer A: Layer with a bundle organization of osteons. Layers B1–B4: Highly organized tissues, poorly organized. Layers C1–C4: Layers with circular rows of osteons. Layer D: Layer displaying Sharpey's fibers. Layer E: External fundamental system. C, Focus on a layer with circular rows of osteons. Black arrows indicate typical static osteogenesis (SO) osteocyte lacunae. D, Focus on a highly organized layer. Gray arrows indicate elongate dynamic osteogenesis (DO) osteocyte lacunae, white arrows indicate pinhead DO osteocyte lacunae. E, Focus on the layer displaying Sharpey's fibers. F, Focus on deep cortex displaying secondary bone with the endosteal bone (white bracket) and secondary osteons (white arrowhead). Scale bars: A, 3000 μm; B, 500 μm; C, 200 μm; D–F, 100 μm.
The section is nearly circular, displaying a large medullary cavity, free of spongious bone. The bone is slightly thicker in postero-dorsal areas, leading to a slightly off-center medulla (Fig. 3A). We observed a poor vascularization, predominantly concentrated in the deep layers of the cortex, associated with primary small-sized primary osteons. The fibers’ orientation is predominantly longitudinal (i.e., parallel to the main axis of the bone). The following histological description is based on observation of the anterior region (Fig. 3A, black square, B,E). Osteons appear associated in disorganized bundles in the deep cortex (Fig. 3B, layer A) but form circular rows closer to the periosteum (Fig. 3B, layers C1–C4). Except for a small part in the postero-dorsal region exhibiting some remodeling (Fig. 3F), tissue is mostly primary. The specimen is an adult, as suggested by the presence of an avascular outer circumferential layer, or external fundamental system (EFS; Fig. 3B, layer E).
This cross section is composed of alternating layers formed at a high growth rate (containing a scaffold of SO bone and primary osteons infilled with DO bone: layers A and C1–C4 in Fig. 3B) and layers of DO bone tissue formed at low growth rate (Fig. 3B, layers B1–B4, D, E). The thick layer A is composed of a scaffold of SO bone containing primary osteons (Fig. 3B, layer A). Layers C1 to C4 have the same structure but are thinner than layer A (Fig. 3B, layers C1–to C4). They are perfectly recognizable by the presence in the scaffold of SO osteocyte lacunae (globular, with radiating canaliculi) (Fig. 3C, black arrows) and isotropic tissue. In strong contrast, layers B1 to B4 display DO features (Fig. 3B, layers B1–B4), showing alternatively the two types of lacunae and fiber orientation (Fig. 3D, white and gray arrows). It can be explained by a plywood structure, that is, a succession of thin layers of lamellar bone having orthogonal orientations, visible under XPL.
These features suggest a first phase of rapid growth corresponding to the deep cortex (Fig. 3B, layer A). The outer part of the cortex, from the end of the deep cortex to the EFS, displays an alternation of periods of slow BGR (Fig. 3B, layers B1–B4), shown by the organized tissues, and periods of faster BGR, shown by the layers of osteons in circular rows (Fig. 3B, layers C1–C4). This organization, the lamellar-zonal, is typical of extant crocodilians (Padian et al. Reference Padian, Horner and de Ricqlès2004; Tumarkin-Deratzian et al. Reference Tumarkin-Deratzian2007).
In addition to the primary bone, there are two kinds of secondary bone occurrences. The first one is present on the margin of the medullary cavity: endosteal bone. It consists of highly organized bone, completely avascular, exhibiting a strong anisotropy (Fig. 3F, white bracket). The second kind of secondary bone corresponds to the presence of secondary osteons (Fig. 3F, white arrowhead). However, remodeling is scarce, suggesting a young adult.
This pattern of alternating layers of SO and DO bone is observed everywhere in the section and is relatively homogenous, with some notable exceptions. The anterior area displays more bands of high growth rate than other areas, suggesting more active growth than in other areas. It is associated with the presence of Sharpey's fibers, close to the periosteum (Fig. 3B, layer E). These fibers reveal the attachment of a soft tissue, muscles, or ligaments.
†Goniopholis presents a bone histology similar to that observed in extant crocodilians, with a lamellar-zonal histological organization. This animal was an adult according to the presence of the EFS but seems to be relatively young, as remodeling is still scarce. According to these features, it probably possessed a metabolic rate similar to that of extant crocodilians. Despite the fractures and fungal degradation, the section displays enough primary bone layers to allow a good quantification of variables and hence for performing the PEM analysis.
†Dyrosaurus sp
The cross section of †Dyrosaurus is well preserved (Fig. 4A). There are some fractures, and we can identify invasion by fungi, but they are relatively scarce and do not impact the analysis of the section. The section is also nearly circular with a smaller medullary cavity compared with †Goniopholis; it is also free of bone trabeculae. Vascularization is dense but consists essentially of large secondary osteons. Primary osteons are scarce, but still present, and much smaller than the secondary ones. The vascularization is longitudinal in majority, as for †Goniopholis. The presence of an EFS suggests that this organism was an adult, and probably aged. Harvesian bone constitutes a large part of the section, and more than 15 lines of arrested growth (LAGs; Fig. 4D, white arrowheads, and visible on Fig. 3B, from layer B1 to E) are present in the outer half of the cortex. Therefore, tissue is essentially secondary in the deep cortex, which means that the recording of the first stages of life has been lost.

Figure 4. Histological section of †Dyrosaurus sp. A, General view of the cross section. Picture obtained using a Hirox 2000 microscope. Viewed in natural light. B, Details of a region, with the indication of the different layers of growth rate. Red layers are high growth-rate product, and blue are low growth-rate product. Viewed in linearly polarized light (LPL). C, Focus on the deep cortex, on the margin with the medulla. White bracket indicates the endosteal bone, and white dotted line indicates the limit of a secondary osteon. Viewed in cross-polarized light (XPL). D, Focus on primary bone. Black arrows indicate static osteogenesis (SO) produced osteocyte lacunae, white arrows indicate dynamic osteogenesis (DO) produced osteocyte lacunae. Viewed in LPL. Scale bars: A, 3000 μm; B, 500 μm; C, 200 μm; D, 100 μm.
We observed two major types of primary bone. On one hand, the great majority of the remnant primary bone is constituted of DO bone: poorly vascularized, if not completely avascular (Fig. 4B, layers B1–B5), strongly anisotropic, and associated with elongated osteocyte lacunae (Fig. 4D, white arrows). Contrary to †Goniopholis, we cannot easily find an isotropic tissue with pinhead lacunae, suggesting there is no change in the direction of fibers.
On the other hand, we can find thin bands of circular rows of primary osteons as in †Goniopholis. These osteons are associated with isotropic fibers and globular lacunae, typical of SO bone (Fig. 4D, black arrows). As a large part of the bone is remodeled, it is difficult to establish the exact number of these rows. It seems we can find at least four of them (Fig. 4B, layers C1–C4). Approaching the EFS, the rows become thinner. Moreover, on the outer half of the cortex, numerous LAGs are present. They are especially abundant and close to each other near the EFS. These features suggest a continuous growth, but steadily decreasing in magnitude and becoming negligible by the end of the specimen's life.
Secondary bone is particularly present in this section. It consists of endosteal bone (Fig. 4C, white bracket) and, essentially, haversian bone, characterized by huge secondary osteons (Fig. 4C, delineated by the white dotted line). They are found nearly everywhere in the section, occupying all the space in the deep cortex, gradually decreasing in abundance toward the periphery, and becoming nearly absent near the EFS.
The bone is relatively homogenous, but it is tricky to identify differences in the growth pattern, as the secondary bone invaded a large part of the primary growth, especially the deeper half cortex.
As for †Goniopholis, we observed a typical lamellar-zonal bone as currently documented in extant crocodilians. The extension of secondary bone is more problematic than for †Goniopholis, but there is still enough primary bone for measuring the required variables and performing PEM inferences.
Quantitative Histology
The quantified variables were measured using equations (6) and (7) and are presented in Table 1. Extinct taxa display values of RPOA similar to those observed in Crocodylus (†Dyrosaurus: 0.077; †Goniopholis: 0.059; Crocodylus: 0.052). The same is found for both canmin (†Dyrosaurus: 21.5 μm; †Goniopholis: 20.5 μm; Alligator: 22 μm) and HMC (†Dyrosaurus: 14.9 μm; †Goniopholis: 10.3 μm; Alligator: 13.2 μm).
Table 1. Results of quantification and phylogenetic eigenvector maps (PEM) inferences for both extinct studied species. n(ost) is the number of quantified osteons, n(can) the number of quantified vascular canals. HMC, harmonic mean caliber; RBC, red blood cell; RMR, resting metabolic rate; RPOA, relative primary osteon area.

The AICc and R 2 values for each model and analysis are presented in Table 2. For all analyses, a model including a histological variable was chosen. For both RBC analyses, a model including the canmin as explanatory variable was chosen (RBCw, R 2 = 0.828, AICc = 49.749; RBCa, R 2 = 0.981, AICc = 128.285). It was unquestionably better than others for the RBCa analysis and was preferred to the model including HMC (R 2 = 0.843, AICc = 54.455) because of its better AICc score and similar R 2 coefficients for the RBCw analysis. However, for RMR analysis, model outputs with and without RPOA were similar. Although the model including the phylogeny exclusively is slightly better from a statistical point of view (R 2 = 0.979, AICc = 29.912), we chose to use a model including RPOA as an explanatory variable (R 2 = 0.972, AICc = 30.052), as it is more relevant from a biological point of view.
Table 2. Metrics from corrected Akaike's information criteria (AICc) on different models for the different analyses. Bold type indicates the chosen model. canmin, minimal caliber; HMC, harmonic mean caliber; RBC, red blood cell; RMR, resting metabolic rate; RPOA, relative primary osteon area.

Using these models, we were able to infer values of RMR, RBCw, and RBCa for both extinct taxa. These values are presented in Table 1 and Figure 5 (see Supplementary Fig. 1 for a version with cross-values). Shapiro-Wilk tests were performed on residuals for all models. A log transformation was necessary for the model using RPOA for RMR inference (p = 0.0374 before transformation; p = 0.8361 after transformation). We used natural logarithm for RMR and natural logarithm +1 for RPOA, as it contains null values. It was not necessary to transform the data of the two other analyses, as results of Shapiro-Wilk tests were not significant (p = 0.9577 for RBCw analysis; p = 0.6624 for RBCa analysis).

Figure 5. Results of the different analyses conduct using phylogenetic eigenvector maps (PEM). Empty squares are empirical data of extant tetrapods. Brackets (with filled square, if present) are inferred data of extinct neosuchians. Red indicates an endotherm, blue an ectotherm, and gray an unknown condition. Dotted line indicates the limit between endothermy and ectothermy, based on the weaker (for A) or higher (for B and C) known values in our sample of extant endotherms. A, Resting metabolic rate (RMR) inferences using a model comprising phylogeny and relative primary osteon area (RPOA). B, Red blood cell (RBC) width inferences using a model comprising phylogeny and minimal caliber (canmin). C, RBC area inferences using a model comprising phylogeny and canmin.
As data for RMR inferences were log transformed, the confidence interval is asymmetric after de-transformation. We found very low values of RMR for both taxa (†Dyrosaurus = [0.23; 0.14–0.36] ml(O2) h−1 g−0.67; †Goniopholis = [0.21; 0.14–0.30] ml(O2) h−1 g−0.67), close to what we observed in Crocodylus (0.331 ml(O2) h−1 g−0.67) and in Caiman (0.12 ml(O2) h−1 g−0.67). These values and the corresponding confidence intervals are lower than the minimal known value for an endotherm (cf. Microcebus, RMR = 1.526 ml(O2) h−1 g−0.67) and are close to the maximal known value for an ectotherm (cf. Crocodylus, RMR = 0.331 ml(O2) h−1 g−0.67; Fig. 5A). Hence, we can conclude both †Dyrosaurus and †Goniopholis had an RMR close to their extant relatives, within the range of ectotherms.
A similar situation is observed for RBCa, with values inferred for both taxa similar to those observed in extant relatives (Alligator = 159.4 μm2; †Dyrosaurus = 165.94 ± 25.68 μm2; †Goniopholis = 132.35 ± 18.55 μm2) and superior to the maximum known value for endotherms (cf. Columba = 69.5 μm2) and the minimal known value for ectotherms (cf. Varanus exanthematicus = 99.4 μm2; Fig. 5C). For the RBCw inference, the situation is similar for †Dyrosaurus (RBC width = 11.85 ± 1.75 μm), but the confidence interval of †Goniopholis (RBC width = 8.42 ± 1.17 μm) includes the maximal known values of endotherms (cf. Neovison = 7.8 μm). Both their central values are still close to the Alligator value (RBCw = 10 μm; Fig. 5B). Thus we can conclude that both taxa displayed RBCa in the range of extant ectotherms and †Dyrosaurus had RBCw in the range of extant ectotherms too. However, considering that the confidence interval of the inference for †Goniopholis overlaps the values observed in ectotherms and endotherms, no conclusion can be outlined for this taxon using this model.
Isotopic Geochemistry
Tiupampa
Oxygen isotope composition of phosphates from Tiupampa vertebrates are presented in Table 3, along with the estimated water δ18Oaw values calculated by using equations (3) to (5). Mammals point to a source of drinking water with an average δ18Ow value of −5.4 ± 0.4‰ and the turtle †Roxochelys to a less negative value of −2.1‰, indicating at least two distinct sources of drinking water. Using these δ18Oaw, we inferred the possible T b of Dyrosauridae using equation (2), which is reported in Table 4. T b estimates using †Alcidedorbignya inopinata's δ18Oaw as water sources are too low for crocodylomorphs to be realistic (10°C–23°C; Table 4; Fig. 6A). However, T b estimates using †Roxochelys's δ18Ow as water sources range from 25°C to 38°C and appear more coherent (Table 4; Fig. 6A). This range of body temperatures covers that of modern crocodilians and is compatible with an ecto-poikilothermic thermometabolism for dyrosaurids.

Figure 6. Dyrosaurid (A) and †Goniopholis (B) δ18Op values are plotted against their possible ambient water δ18Oaw values within a frame showing expected vertebrate δ18Op–δ18Oaw plot for a range of body temperatures (black lines). The green area represents expected body temperature (T b) range for modern crocodilians, and the red area represents the expected T b range for modern endotherms.
Table 3. Oxygen isotope composition of phosphate (δ18Op) from vertebrates of Tiupampa and isotopic values extracted from Pouech et al. (Reference Pouech, Amiot, Lécuyer, Mazin, Martineau and Fourel2014) for Cherves-de-Cognac are reported along with calculated oxygen isotope composition of their drinking water (δ18Ow) using phosphate water fractionation equations (3) to (5) (see text).

Table 4. Calculated dyrosaurids and †Goniopholis body temperatures (T b) using water δ18Ow values derived from associated turtles, mammals, and theropods and by applying equation 2 (see text).

Cherves-de-Cognac
Published isotopic values from Pouech et al. (Reference Pouech, Amiot, Lécuyer, Mazin, Martineau and Fourel2014) include those of †Goniopholis along with those of the theropod cf. †Nuthetes, the turtles †Pleurosternon and †Tretosternon, as well as the mammals †Pinheirodon and some indeterminate Spalacotheriidae and Dryolestidae (Table 3). Using equations (3) to (5), local water δ18Oaw values have been calculated and two major sources have been identified: the first one, calculated from both turtles and theropods, ranges from 1.0 ± 1.0‰ to 1.2 ± 0.3‰; and the second one, calculated from mammals, has an average value of −3.3 ± 1.3‰ (Table 4). T b estimates using mammals’ δ18Oaw values as water sources are too low for crocodylomorphs to be realistic (12°C–16°C). However, using turtles’ and theropods’ δ18Oaw values as water sources, T b estimates, which range from 31°C to 36°C (Table 4; Fig. 6B), cover that of modern crocodilians and are compatible with an ecto-poikilothermic thermometabolism for †Goniopholis.
Discussion
Histology
Qualitative and quantitative histological analyses lead to the same conclusion: †Goniopholis and †Dyrosaurus possessed a thermometabolic regime similar to that of extant crocodilians. Their bone microstructure and histological organization depict a first burst of growth, early during the post-hatching ontogeny, followed by a succession of periods of relatively high and low BGR, as suggested by the lamellar-zonal organization. However, this is not definitive evidence to infer a low metabolic rate, as some endotherms display typical ectothermic bones (Reid Reference Reid1984). It is worth considering that Legendre et al. (Reference Legendre, Guénard, Botha-Brink and Cubo2016) inferred an endothermic metabolism for †Calyptosuchus (Aetosauria) and †Postosuchus (Rauisuchidae), based on their inferred RMR values, but their bone organization is lamellar-zonal too (de Ricqlès et al. Reference Ricqlès, Padian and Horner2003), similar to those observed in †Goniopholis and †Dyrosaurus. Therefore, qualitative histology seems insufficient to infer their metabolism.
The inference of RMR with quantitative histology supports the hypothesis of two ectothermic taxa. We preferred to use a model comprising a histological variable, as both models (phylogeny only and phylogeny combined with bone histology) are similar in terms of AICc and R 2 parameters. Moreover, in previous studies, RPOA was preferred to the model without it (Fleischle et al. Reference Fleischle, Wintrich and Sander2018; Faure-Brac and Cubo Reference Faure-Brac and Cubo2020). Regardless, the choice of one model over other with equivalent scores does not matter, as it will only slightly modify the inferred variables. We inferred a low RMR value despite the fact that RPOA was quantified in layers displaying the highest BGR, hence associated to the highest RMR. The RBCa and RBCw inferences point in the same direction. For both variables, values inferred for †Dyrosaurus fall within the range of those measured in extant ectotherms (characterized by the presence of large RBCs). A similar result is observed for †Goniopholis, but only for RBCa. Inferred values of RBCw for †Goniopholis are inconclusive, because the associated 95% confidence interval overlaps values measured in extant ectotherms and extant endotherms. The inference of RBCw is the least conclusive of our analyses, as the model is the less supported (R 2 = 0.828) and should be viewed with more caution than the two others. As high values of RBCa and RBCw are causally linked to low metabolic rates (Holland and Forster Reference Holland and Forster1966; Huttenlocker and Farmer Reference Huttenlocker and Farmer2017; Cubo et al. Reference Cubo, Sena, Aubier, Houee, Claisse, Faure-Brac, Allain, Andrade, Sayão and Oliveira2020), our inferences of RBC dimensions are congruent with our RMR estimations. To achieve a higher metabolic rate and then endothermy, a higher amount of produced energy is required, which demands increased oxygen uptake to sustain the energetic production. The reduction of the size of RBCs is a powerful solution: smaller RBCs are more efficient supplying in oxygen (Snyder and Sheafor Reference Snyder and Sheafor1999; Soslau Reference Soslau2020).
All histological analyses draw the same general picture suggesting that both taxa probably shared a low RMR, typical of what we observed in their extant relatives. Therefore, on the basis of our data, we conclude that both †Dyrosaurus and †Goniopholis were ectothermic vertebrates.
Isotopic Geochemistry
The new isotopic data obtained from the Tiupampa fauna and a review of the Cherves-de-Cognac fauna data allowed us to estimate the T b for both our taxa, using the available relationships linking T b to δ18Op and δ18Obw. Extant crocodiles are polyphiodonts, that is, their teeth are continually replaced during a large part of their life (Poole Reference Poole1961). Therefore, we have access to a single brief record of T b in the life of the specimen. As each tooth can be replaced up to 45 times in the lifetime of an extant crocodilian (Poole Reference Poole1961), their formation records only a short moment of the animal's life, but it is large enough to provide the entire range of thermal behavior of a typical semiaquatic organism, such as extant crocodilians. †Goniopholis would be expected to follow that pattern if it was ectothermic. In contrast, dyrosaurids were marine in their great majority (Wilberg et al. Reference Wilberg, Turner and Brochu2019). Although polyphiodonts, their living environment was much more thermally buffered because of their aquatic ecology. An ectothermic dyrosaurid should then have recorded an aquatic environment close to marine water; however, the estimated negative δ18O values indicate that dyrosaurids from Tiupampa most likely lived in a 18O-depleted freshwater environment such as an estuary or a river. Two dyrosaurid species have been documented so far, which are of similar geological age (the Maria Farinha Formation, Brazil): †Guarinisuchus munizi and †Hyposaurus derbianus, both known as marine species (Wilberg et al. Reference Wilberg, Turner and Brochu2019). Therefore, our studied dyrosaurids were either marine species living at the mouth of an estuary, being in this case similar to the species from the Maria Farinha Formation, or we sampled an unknown freshwater species.
Using water δ18Oaw values estimated from coexisting turtles and from theropod dinosaurs at Cherves-de-Cognac, calculated dyrosaurid and †Goniopholis T b values fall in the “preferred” temperature range of extant crocodilian body temperature (26°C–36°C). However, the calculated T b values for both dyrosaurids and †Goniopholis are unrealistically low when using mammal-derived δ18Ow values. It is noteworthy that Pouech et al. (Reference Pouech, Amiot, Lécuyer, Mazin, Martineau and Fourel2014) considered it improbable that †Goniopholis shared the same environment as mammals, as the latter would be expected to live in forests and the former in an estuary-like environment, and similar reasoning could be proposed for the small pantodont mammals †Alcidedorbignya, which have been considered by de Muizon et al. (Reference Muizon, Billet, Argot, Ladevèze and Goussard2015) to be a terrestrial animal with possible scansorial habits, compatible with a forest habitat. Therefore, the ambient waters ingested by mammals in both cases were most likely not the waters inhabited by dyrosaurids and †Goniopolis. Once again, we consider both Dyrosauridae and †Goniopholis as ectothermic using this proxy.
Integrative Approach
RMR and RBC dimensions inferred for †Dyrosaurus and †Goniopholis using quantitative histology fall in the range of variations measured in extant ectotherms. Moreover, oxygen isotopes of apatite phosphate suggest a range of body temperatures compatible with that of extant crocodilians. Despite the specific limits of both approaches, results converge, suggesting an ectothermic status for the two vertebrate taxa studied here, even though such interpretations must be made with caution.
Isotopic geochemistry only provides a rough estimate of T b and depends on the proper estimation of drinking water δ18Ow value based on coexisting vertebrates’ δ18Op values. Moreover, T b is only a product of thermometabolism and not entirely driven by it. A high T b is necessary but not sufficient in itself to infer endothermy. Gigantothermy could be a possibility to explain high body temperatures, but it still has to be proven that an endotherm-like T b can be reached this way. Known extant cases of gigantothermy roughly attain ~30°C (Paladino et al. Reference Paladino, O'Connor and Spotila1990). For extinct cases, it was theorized that large dinosaurs could achieve homoiothermy with a T b of ~31°C (Seebacher et al. Reference Seebacher, Grigg and Beard1999).
Quantitative histology allows inferring metabolic rate using phylogenetic comparative methods. It possesses its known issues, as it cannot robustly detect ectothermy, because bone structure produced by an ectothermic animal can easily be formed by endothermic ones as well. Moreover, it cannot detect particular cases such as putative gigantothermy (high T b but low RMR). In addition, we cannot be fully certain that a high RMR always indicates endothermy. As mentioned before, the link between these variables is correlational.
Conclusion
This study, along with those published by Cubo et al. (Reference Cubo, Sena, Aubier, Houee, Claisse, Faure-Brac, Allain, Andrade, Sayão and Oliveira2020), Legendre et al. (Reference Legendre, Guénard, Botha-Brink and Cubo2016), and Séon et al. (Reference Séon, Amiot, Martin, Young, Middleton, Fourel, Picot, Valentin and Lécuyer2020), explores the evolution of thermometabolism among the pseudosuchians and, more especially, the loss(es) of their ancestral endothermy (Seymour et al. Reference Seymour, Bennett-Stamper, Johnston, Carrier and Grigg2004). A hypothesis suggesting a loss linked to the acquisition of a semiaquatic lifestyle and ambush predation was proposed (Seymour et al. Reference Seymour, Bennett-Stamper, Johnston, Carrier and Grigg2004). However, hypothesizing that Pholidosauridae were ectotherms as Dyrosauridae (on the basis of their close phylogenetic relationship and shared similar lifestyles, morphologies, and predation type) would imply a unique loss of endothermy at the node Metasuchia as a parsimonious explanation (Fig. 7) or even earlier at the node Crocodyliformes or Crocodylomorpha. Therefore, ectothermy may be ancestral for all metasuchians. Wilberg et al. (Reference Wilberg, Turner and Brochu2019) stated that a terrestrial lifestyle is ancestral among Crocodylomorpha and Metasuchia and that the acquisition of a semiaquatic lifestyle and ambush predation is a specificity of Neosuchia. Seymour et al.'s (Reference Seymour, Bennett-Stamper, Johnston, Carrier and Grigg2004) hypothesis about an ancestral endothermic state for archosaurs is thus corroborated, but their hypothesis about the loss of endothermy linked to the acquisition of a semiaquatic lifestyle and ambush predation is rejected, because terrestrial Notosuchia are inferred to be ectotherms (Cubo et al. Reference Cubo, Sena, Aubier, Houee, Claisse, Faure-Brac, Allain, Andrade, Sayão and Oliveira2020) and Metasuchia are inferred to be ancestrally terrestrial. However, the ambiguous status of Calsoyasuchus could lead to a review of this interpretation if it considered to be amphibious (Wilberg et al. Reference Wilberg, Turner and Brochu2019: fig. 6).

Figure 7. Summary of the distribution of thermometabolism across Archosauria. The phylogeny used is a handmade combination of both trees presented in Puértolas-Pascual et al. (Reference Puértolas-Pascual, Young and Brochu2020) and Nesbitt (Reference Nesbitt2011). Red indicates an inferred or known endothermic taxon. Blue indicates an inferred or known ectothermic taxon. Black indicates unknown status. Black surrounded by dotted colored lines indicates a putative endothermic/ectothermic status depending on the color used. Shapes were taken from phylopic.org.
Legendre et al. (Reference Legendre, Guénard, Botha-Brink and Cubo2016) inferred endothermic-like RMR for †Postosuchus (Rauisuchidae) and †Calyptosuchus (Aetosauria), both external to the clade Crocodylomorpha. Séon et al. (Reference Séon, Amiot, Martin, Young, Middleton, Fourel, Picot, Valentin and Lécuyer2020) proposed ectothermic Teleosauridae and endothermic–heterothermic Metriorhynchidae, with a doubt concerning the ancestral status of thalattosuchians. The last missing pieces are the status of Protosuchidae and some stem species, like †Hsisosuchus, which should bring the final necessary data to constrain the reversion(s) of thermometabolic condition in Pseudosuchia (Fig. 7).
We suggest that combined bone paleohistology and stable isotope geochemistry should be used whenever possible to contrast inferences and produce more robust interpretations.
Acknowledgments
We thank L. Cavin, R. Allain, and V. de Buffrénil for providing access to the studied material. We thank S. Morel for the preparation of cross sections and D. Germain for the access to the hard tissue collection. The histology part of the study was designed by J.C.; the isotopic geochemistry part was designed by R.A. and C.L. All authors contributed equally in the analyses. M.G.F.-B. wrote the first version of the article, and all authors contributed equally to its improvement. We thank Roger Seymour, another anonymous reviewer, and our editor Matt Friedman for their constructive comments.
Data Availability Statement
Data available from the Dryad Digital Repository: https://doi.org/10.5061/dryad.4xgxd259v.


 Open access