


INTRODUCTION
Human African trypanosomaisis (HAT), also known as sleeping sickness, is caused by infections with the tsetse fly vectored haemoflagellates Trypanosoma brucei gambiense (West Africa) and T. b. rhodesiense (East Africa). In both cases, infection progresses from an initial haemolymphatic (early stage) to a meningoencephalitic (late stage) infection in which parasites penetrate the central nervous system (CNS), resulting in neuro-inflammatory disease and ultimately death if untreated (Kennedy, Reference Kennedy2013). Dysregulation of inflammatory responses and in particular overactivation of type 1 macrophage responses is associated with pathology in both clinical disease and experimental animal infection (Sternberg and Maclean, Reference Sternberg and Maclean2010). This phenomenon is driven by MyD88-dependent pathways (Drennan et al. Reference Drennan, Stijlemans, Van den Abbeele, Quesniaux, Barkhuizen, Brombacher, De Baetselier, Ryffel and Magez2005). In the CNS, toll-like receptor (TLR)2 and TLR9, but not TLR4 ligands have been implicated in mediating inflammatory responses (Amin et al. Reference Amin, Vodnala, Masocha, Sun, Kristensson and Rottenberg2012), but it is not known whether this is also the case systemically. Endotoxins are potent inflammatory activators signalling in myeloid and other cells via an interaction between the lipid A component and TLR4 receptors (Raetz and Whitfield, Reference Raetz and Whitfield2002). Because of baseline levels of gastrointestinal tract permeability, low levels of endotoxin are found in the plasma from healthy subjects; however, in pathological conditions such as severe bacteraemia, these increase massively and may result in endotoxic shock syndrome (Brandtzaeg et al. Reference Brandtzaeg, Kierulf, Gaustad, Skulberg, Bruun, Halvorsen and Sorensen1989). Studies in experimental animals have demonstrated endotoxaemia in T. brucei infection (Pentreath, Reference Pentreath1994). The origin of the endotoxins causing this phenomenon is unclear. Evidence has been presented that intestinal permeability of microbial products, which is the basis of baseline levels of serum endotoxin, is involved (Nyakundi et al. Reference Nyakundi, Crawley, Smith and Pentreath2002) and is consistent with the lack of correlation of endotoxaemia to parasitaemia. However, contradictory reports indicate a non-gut origin and an association with parasite membrane components (Ngure et al. Reference Ngure, Burke, Eckersall, Jennings, Mbai and Murray2009a , Reference Ngure, Eckersall, Burke, Karori, Mwangi, Wachira, Maathai and Murray b ).
A key question in establishing the significance of endotoxaemia in African trypanosomiasis is to determine if it is observed in clinical cases and if so whether there is a relationship to pathogenesis. In a previous study, data were presented on endotoxaemia in T. b. gambiense HAT patients. Here plasma and CSF endotoxin concentrations were increased during infection compared with non-infected individuals (Pentreath et al. Reference Pentreath, Alafiatayo, Crawley, Doua and Oppenheim1996), and the Limulus Assay results were independently confirmed by measurement of antibody responses to endotoxin (Pentreath et al. Reference Pentreath, Alafiatayo, Barclay, Crawley, Doua and Oppenheim1997). However, these studies did not include data that would allow analysis of the relationship of endotoxin levels to disease progression, in terms of parasitaemia, diagnostic stage or development of the inflammatory response.
As part of a larger study of the role of inflammatory cytokines in the pathogenesis of T. b. rhodesiense HAT, we have analysed a set of plasma and cerebrospinal fluid (CSF) samples from patients and sympatric controls in Eastern Uganda using the Limulus amoebocyte lysate (LAL) assay (Hurley, Reference Hurley1995). For each sample, detailed information on stage of infection, clinical signs and inflammatory responses (plasma and CSF cytokines and white cell counts) were recorded. These enabled us to test the hypothesis that endotoxaemia occurs in T. b. rhodesiense HAT and investigate the relationship of plasma and CSF endotoxin levels to CNS and systemic inflammatory responses.
MATERIALS AND METHODS
Study subjects
This study was conducted according to the principles expressed in the Declaration of Helsinki. All patients recruited received written and verbal information explaining the purpose of this study and gave informed written consent. Where participants were minors, consent was also given by the parent or legal guardian.
All protocols were approved by ethics committees in Uganda (Ministry of Health Ref ADM130/313/05) and UK (Grampian Joint Ethics Committee Ref 02/0061).
69 Patients and 18 controls were recruited at the LIRI Hospital (Tororo District, Uganda) and Serere Health Centre (Serere District, Uganda) between August 2002 and July 2003, part of a larger multicentre study for which all protocols (disease staging, clinical and neurological parameters) have been described elsewhere (MacLean et al. Reference MacLean, Odiit, Chisi, Kennedy and Sternberg2010). The selection of patient samples for this study was entirely random and driven by limitations in available sample volume for the Limulus assay. Patient demographic and clinical data are summarized in Table 1. All plasma and CSF samples were collected aseptically. Blood was collected in EDTA vacutainers (Vacuette, Greiner Bio-one Ltd., UK) and centrifuged at 10 000 rpm for 10 min. The 4 mL of plasma was aliquoted into 2 mL cryovials (Greiner Bio-one Ltd., UK) and frozen immediately in liquid nitrogen. CSF was collected in 15 mL sterile polypropylene tubes (Greiner Bio-one Ltd., UK) and centrifuged for 10 min at 10 000 rpm. CSF supernatant was aliquoted into 2 ml cryovials frozen immediately in liquid nitrogen. All plasticware was certified endotoxin free.
Table 1. Study population and disease characteristics

a Parasitaemia estimated from parasites observed in 10 micropscope fields at × 400 on thick films as described in(MacLean et al., Reference MacLean, Odiit, Chisi, Kennedy and Sternberg2010).
Samples were maintained in liquid nitrogen (including vapour phase air freight) and subsequently transferred to −80 °C until required for analysis.
CSF and plasma endotoxin measurement
Plasma and CSF samples were diluted with PBS (phosphate-buffered saline) 1:5 and heated at 70 °C for 10 min. After centrifugation (13 000 g) for 5 min, the supernatant was decanted and endotoxin activity was measured using a chromogenic LAL assay (QCL-1000, Lonza, UK) according to the manufacturer's protocol. Every assay included a series of standards from 0·05–2 EU mL−1 calibrated using a standardized lot of Escherichia coli 011:B4 endotoxin (Lonza E50–640, UK) and the biological limit of detection were calculated for each assay. Limits of detection were in the range 0·1–0·05 EU mL−1. The effectiveness of heat treatment was confirmed by inclusion of a control sample of plasma spiked with a 0·2 EU mL−1 final concentration of endotoxin standard. Because previous literature on endotoxaemia in HAT have presented endotoxin concentrations as lipopolysaccharide (LPS) equivalents, endotoxin concentrations were expressed as pg mL−1 LPS using the conversion 1 EU mL−1 = 100 pg mL−1 (Hurley, Reference Hurley2013).
Plasma and CSF cytokine assays
Interferon (IFN)-γ, interleukin (IL)-6, transforming growth factor (TGF)-β and IL-10 concentrations were measured using a solid-phase sandwich ELISA (OptiEIA; BD Pharmingen, Oxford, UK), as described previously (MacLean et al. Reference MacLean, Odiit, MacLeod, Morrison, Sweeney, Cooper, Kennedy and Sternberg2007). Biological limits of detection were 1·8, 8·3, 19·2 and 1·6 pg mL−1, respectively
Statistical analysis
Endotoxin concentration and cytokine data were right skewed and multimodal. Therefore non-parametric inferential statistical analyses were used (tests as indicated in figure legends or text) and were carried out using JMP10·0 (SAS Institute, Cary, NC, USA). Biological limits of detection were calculated as the mean blank value plus 2 s.d. plus 2 s.d. of the lowest standard. For descriptive and inferential statistical analysis, results below the limit of detection were assumed to be (0·5 × limit of detection value).
RESULTS
Endotoxaemia in patients and controls
Endotoxin concentration was measured using a chromogenic end-point LAL assay using heat-treated samples to inactivate inhibitory factors as described in (Hurley, Reference Hurley1995). The elimination of inhibitors was confirmed by the inclusion of a control sample spiked with LPS (0·2 EU mL−1) in each assay. A recovery of ⩾80% activity was measured provided samples were treated at 70 °C for at least 10 min. Plasma endotoxin concentration was significantly increased in HAT patient samples compared with control subjects. There was no significant difference between early (haemolymphatic) and late (meningoencephalitic) stage HAT cases, and in all patients plasma endotoxin levels reduced to control levels after chemotherapeutic treatment for HAT (Fig. 1A). The overall median endotoxin level in HAT patients was 91 pg mL−1 (IQR 67–117 pg mL−1). There was no significant effect of subject gender on overall plasma endotoxin concentration and significant endotoxaemia was evident in both male and female HAT patients (Table 2). Also there was no significant relationship between subject age and plasma endotoxaemia within the HAT patients group [Spearman's rank correlation coefficient (ρ) = −0.14 P = 0·57; not significant (NS)].

Fig. 1. Endotoxaemia in control (n = 18), early stage (n = 20) and late stage (n = 49) HAT patients on admission and after treatment for sleeping sickness. (A) Plasma endotoxin concentration (B) CSF endotoxin concentration. Box (median, quartiles), whiskers (10–90th percentile) and outliers. **P < 0·01;***P < 0·001 Kruskal–Wallis test with Dunn's multiple comparison adjusted post-test.
Table 2. Endotoxaemia in HAT patients by disease stage and gender
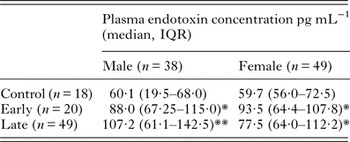
*Significantly increased over control P < 0·05 Dunn's post hoc test.
**Significantly increased over control P < 0·01 Dunn's post hoc test.
Within the HAT patient group (both early and late stages) there was no apparent relationship between the plasma endotoxin level and parasitaemia (Spearman ρ = 0·03; NS), reported duration of infection (ρ = 0·08; NS) or anaemia as measured by packed cell volume (ρ = −0·014; NS).
CSF endotoxin concentrations
For ethical reasons we did not obtain CSF from control individuals. CSF from patients was assessed for pleiocytosis, which ranged from 1 to 400 cells µL−1 and parasitosis, which ranged from 0 to 80 trypanosomes µL−1. The criteria for a late-stage diagnosis were > 5 white cells µL−1 and/or presence of parasites (MacLean et al. Reference MacLean, Odiit, Chisi, Kennedy and Sternberg2010). In most patient CSF samples, endotoxin levels were low (medians at the limit of detection 5 pg mL−1) with outliers exhibiting endotoxin concentrations up to 102 pg mL−1 in the early stage and 131 pg mL−1 in the late stage (Fig. 1B). There was no relationship between CSF endotoxin concentration and CSF parasitosis (ρ = 0·3; NS) or CSF pleiocytosis (ρ = 0·31; NS). All HAT patients underwent a second CSF collection after drug therapy, and analysis of these samples revealed no significant difference between pre- and post-treatment CSF endotoxin concentrations.
There was a weak but significant relationship between plasma endotoxin and CSF endotoxin concentration in patients (ρ = 0·51 P < 0·02), but this was not evident in post-treatment cases (ρ = −0·25; NS).
Relationship of gross inflammatory and cytokine responses to endotoxaemia
Gross inflammatory disease was assessed by physical examination on admission. No relationships were observed between plasma endotoxaemia and either hepatomegaly or pyrexia. However, the occurrence of splenomegaly and cervical lymphadenopathy were significantly associated with plasma endotoxin concentration (P < 0·05, logistic regression, likelihood-ratio test). The odds ratios (OR [95% CI]) for the occurrence of splenomegaly and cervical lymphadenopathy were 1·19 [1·01–1·4] and 1·16 [1·02–1·35] respectively for every 10 pg mL−1 increase in plasma endotoxin concentration. Plasma IFN-γ, IL-6, IL-10 and TGF-β concentrations were significantly increased in patients compared with controls (Table 3), and of these IFN-γ and TGF-β concentrations were significantly associated with plasma endotoxin concentration. However, this association was confounded by the increase in plasma endotoxin in HAT cases, and when correlation analysis was carried out within the patient group only all associations became non-significant.
Table 3. Plasma and CSF cytokines in infected and control groups and relationship to endotoxaemia

*P < 0·05; **P < 0·01; ***P < 0·001 (Dunn's post hoc test).
a In HAT group only ρ = 0·19 NS.
b In HAT group only ρ = 0·2 NS.
In the CSF, stage progression was associated with significant increases in CSF IL-6 and IL-10 concentrations and a reduction in CSF TGF-β levels (Table 3).
However, there were no significant relationships between CSF cytokine concentration and endotoxin concentration. Patients were also assessed for neurological sequelae of HAT (tremor, ataxia, somnolence) and Glasgow Coma Score and no relationship to CSF endotoxin concentration was detected.
DISCUSSION
Experimental model studies have demonstrated that both systemic innate responses to African trypanosomes and CNS invasion depend on the activation of type 1 inflammatory responses that are, at least in part, driven by MyD88-dependent signalling (Drennan et al. Reference Drennan, Stijlemans, Van den Abbeele, Quesniaux, Barkhuizen, Brombacher, De Baetselier, Ryffel and Magez2005). In experimental models and in the clinic, systemic and CNS inflammatory responses underlie disease pathogenesis (Sternberg and Maclean, Reference Sternberg and Maclean2010). Mediators that may be involved in these processes include components of the GPI anchor of the trypanosome variant surface glycoprotein and CpG dinucleotides. Several studies have also provided evidence of endotoxaemia in experimental models of trypanosomiasis (Pentreath, Reference Pentreath1994) and also it has been demonstrated that endotoxin and endotoxin antibody levels are increased in clinical cases of African trypanosomiasis caused by T. b. gambiense (Pentreath et al. Reference Pentreath, Alafiatayo, Crawley, Doua and Oppenheim1996; Pentreath et al. Reference Pentreath, Alafiatayo, Barclay, Crawley, Doua and Oppenheim1997). These findings suggested that endotoxins may also act as an immune-modulating factor promoting inflammatory responses and pathology in HAT.
We studied clinical plasma and CSF samples from T. b. rhodesiense HAT patients to determine the relationship of endotoxaemia to disease using the LAL assay. Unlike previous studies using plasma and CSF from T. b. gambiense patients (Pentreath et al. Reference Pentreath, Alafiatayo, Crawley, Doua and Oppenheim1996), the detailed parasitological and clinical data associated with the HAT patients in this study enabled us to determine the relationships of endotoxin concentrations to parasitaemia, gross inflammatory responses and cytokine markers of inflammation.
The LAL assay is susceptible to a range of interfering factors in blood, serum and plasma (Gnauck et al. Reference Gnauck, Lentle and Kruger2016) including LPS-binding proteins. These were controlled for using dilution and heat treatment, with confirmation from plasma spiked with known concentrations of LPS. Contamination from exogenous LPS, absorption and degradation of samples was controlled by the collection of all samples in identical, endotoxin-free vessels, these being then processed contemporaneously and identically, and stored for similar periods.
In T. b. rhodesiense HAT patients, plasma endotoxin concentrations were increased compared with control individuals. The range of endotoxin concentration was similar to that reported in T. b. gambiense infection (Pentreath et al. Reference Pentreath, Alafiatayo, Crawley, Doua and Oppenheim1996), and was modest compared with endotoxaemia levels observed in conditions such as septic shock (Brandtzaeg et al. Reference Brandtzaeg, Kierulf, Gaustad, Skulberg, Bruun, Halvorsen and Sorensen1989). Endotoxin concentrations returned to control levels after drug treatment for trypanosomiasis, confirming the relationship with the infection. We demonstrated that plasma endotoxin concentration was unrelated to parasitaemia, consistent with observations in mouse model infections (Pentreath, Reference Pentreath1994) suggesting that a parasite-derived endotoxin-like substance is unlikely to be the cause of endotoxin activity. This conclusion is further supported by the low concentration of endotoxin in CSF even where high levels of parasitosis occurred. Given that endotoxaemia returned to control levels after drug therapy for HAT, it seems unlikely that systemic bacteraemia is involved, and that the most likely basis of the phenomenon is as a result of translocation of microbial products from the gut by either paracellular permeability or transcellular passage (Gnauck et al. Reference Gnauck, Lentle and Kruger2016). This would be consistent with the enhanced gut translocation of non-metabolizable sugar probes observed in a rat model of HAT (Nyakundi et al. Reference Nyakundi, Crawley, Smith and Pentreath2002).
As has been previously found in both T. b. rhodesiense (MacLean et al. Reference MacLean, Odiit, MacLeod, Morrison, Sweeney, Cooper, Kennedy and Sternberg2007) and T. b. gambiense HAT (Lejon et al. Reference Lejon, Lardon, Kenis, Pinoges, Legros, Bisser, N'Siesi, Bosmans and Buscher2002), plasma cytokine markers of both the inflammatory (IFN-γ, IL-6) and counter-inflammatory immune response (IL-10, TGF-β) were upregulated in patients in this study. While plasma endotoxin concentration was not related to the concentrations of either IL-6 or IL-10, there were significant correlations to IFN-γ and TGF-β plasma concentrations. This suggests a complex interplay between endotoxaemia and the cellular inflammatory response. Endotoxaemia was significantly associated with the occurrence of two gross inflammatory manifestations of infection, namely splenomegaly and lymphadenopathy.
In the CSF, endotoxin concentrations were low and were unrelated to stage progression, or neuroinflammatory responses as measured by pleiocytosis and inflammatory cytokine expression. The increased concentrations of IL-6, IL-10 and decreased concentration of TGF-β in late-stage patients is consistent with previous findings (MacLean et al. Reference MacLean, Odiit, MacLeod, Morrison, Sweeney, Cooper, Kennedy and Sternberg2007), but was unrelated to endotoxin concentration. There was a weak relationship between plasma and CSF endotoxin concentration suggesting that cases with significant CSF endotoxin levels could reflect blood brain barrier penetration, but the lack of any association to neuro-inflammation and neurological sequelae associated with CNS infection by trypanosomes indicates that endotoxins play a minimal role in late-stage disease. Our results are not consistent with those obtained in T. b. gambiense HAT (Pentreath et al. Reference Pentreath, Alafiatayo, Crawley, Doua and Oppenheim1996) where mean CSF endotoxin concentrations of 45–50 pg mL−1 were observed, with a strong correlation to plasma endotoxaemia. This could reflect differences in pathobiology between the two subspecies of parasite, but importantly the previously reported T. b. gambiense data did not distinguish early and late-stage cases and thus precluded any analysis of the relationship between CSF endotoxin and the presence of parasites in the CNS.
In conclusion, we demonstrate that T. b. rhodesiense HAT is associated with low-grade systemic endotoxaemia. We reasoned that the source of endotoxin in this disease is almost certainly parasite-independent, and most probably is a result of permeability of the gastrointestinal tract. Such an increase in permeability might be induced by the inflammatory response itself (Hietbrink et al. Reference Hietbrink, Besselink, Renooij, de Smet, Draisma, van der Hoeven and Pickkers2009), and this possibility is amenable to testing in inflammatory signalling defective mouse models such as MyD88 −/− (Drennan et al. Reference Drennan, Stijlemans, Van den Abbeele, Quesniaux, Barkhuizen, Brombacher, De Baetselier, Ryffel and Magez2005). Endotoxaemia may play a role in the peripheral inflammatory pathology of HAT but appears to be unrelated to late-stage neuroinflammatory disease.
FINANCIAL SUPPORT
This work was funded the Wellcome Trust (grant no. 082786 to J. M. S.).


 Open access