


Uncertainty surrounds the prominent theory in biology and politics that negativity bias, or greater attentional and physiological responses to negative (over positive or neutral) stimuli in one’s environment, underlies political conservatism. Since pioneering studies were first published (Dodd et al., Reference Dodd, Balzer, Jacobs, Gruszczynski, Smith and Hibbing2012; Oxley et al., Reference Oxley, Smith, Alford, Hibbing, Miller, Scalora, Hatemi and Hibbing2008), expanded interest has brought increased conceptual scrutiny (Hibbing et al., Reference Hibbing, Smith and Alford2014) and, of particular concern, failed replications (Bakker et al., Reference Bakker, Schumacher, Gothreau and Arceneaux2020; Fournier et al., Reference Fournier, Soroka and Nir2020; see Smith & Warren, Reference Smith and Warren2020). In this article, we propose a study of one major factor that has been (surprisingly) omitted from existing studies on this topic and may prove fruitful for easing the current state of uncertainty around this theory: race and ethnicity. Specifically, we examine how the relationship between negativity bias (measured using physiological as well as recall-based measures) and political orientation varies across ethnoracial groups.
The connection between “negativity” and ideology is usually theorized to emanate from the security from aversive aspects of society that socially conservative policies offer. Current research is based overwhelmingly on racially heterogeneous but majority-White samples without much consideration of the role of race and ethnicity, yet it is reasonable to expect the relevant societal threats (and support for policies that protect individuals from them) to differ significantly across racial and ethnic groups. Racial discrimination is experienced frequently in the United States through a variety of social and political institutions (Chou et al., Reference Chou, Asnaani and Hofmann2012; DeGruy-Leary, Reference Degruy-Leary2017), and this poses a physical and mental threat to minorities in their day-to-day lives (Tessler et al., Reference Tessler, Choi and Kao2020). These experiences have political consequences. Here, we focus on four issue domains understudied in existing research but within which we expect to find racial/ethnic variation in the relationship between negativity bias and political orientation: policing/criminal justice, immigration, economic redistribution, and religious conservatism. In line with existing work on the relationship between negativity bias and ideology, we also account for the theoretical distinction between two types of negativity: threat and disgust.
Importantly, we prefer not to think about this study as examining simply differences across a demographic variable, but rather differences across individuals who have been racialized in different ways and thus have fundamentally different relationships with various political issues and government institutions. In this sense, the relationship between negativity bias and political attitudes should be inherently defined by one’s racial identity, which conveys one’s social status and thus one’s relationship with government. We also want to avoid the possibility of the findings being interpreted as suggesting there are innate, biological differences across the racial/ethnic groups. Instead, this study examines how individuals’ lived experience as people racialized by society in a certain way shapes the way that their threat sensitivity predisposition (which is not itself innately tied to race) influences political attitudes.Footnote 1
Support for and criticism of the negativity bias–conservatism connection
Since pioneering work showed a heritable component to political ideology (Alford et al., Reference Alford, Funk and Hibbing2005), a great deal of scholarship has sought to identify the deep-rooted psychological mechanisms that connect human biology to politics. A prominent theory offered is that negativity bias underlies variation in political ideology (see Hibbing et al., Reference Hibbing, Smith and Alford2014). Specifically, greater attention to, reaction to, and recall of negative stimuli in one’s environment may lead individuals to support social and political policies that offer security and protection from environmental threats. However, theoretical critiques of this theory have been levied for some time. Specifically, some have wondered how this model lines up with work on the multidimensionality of political ideology (Federico et al., Reference Federico, Johnston and Lavine2014; Feldman & Huddy, Reference Feldman and Huddy2014), and whether disgust or threat (Inbar & Pizarro, Reference Inbar and Pizarro2014; Lilienfeld & Latzman, Reference Lilienfeld and Latzman2014) or arousal (Tritt et al., Reference Tritt, Inzlicht and Peterson2014) is the most important mechanism at play.
Beyond theoretical critiques, there have also been notable recent replication failures. Across multiple countries, using a variety of stimuli (including stimuli identical to those used in the original studies), replications have failed to find a relationship between negativity bias in physiological reactions—specifically, electrodermal activity (EDA) and facial muscle electromyography (EMG)—and political conservatism (Bakker et al., Reference Bakker, Schumacher, Gothreau and Arceneaux2020; Fournier et al., Reference Fournier, Soroka and Nir2020). Of course, the role of physiological reactivity is only one source of evidence for the negativity bias–conservatism hypothesis. Other work has found this link to exist using measures of attention (e.g., Dodd et al., Reference Dodd, Balzer, Jacobs, Gruszczynski, Smith and Hibbing2012), memory recall (Mills et al., Reference Mills, Gonzalez, Giuseffi, Sievert, Smith, Hibbing and Dodd2016), and MRI (Ahn et al., Reference Ahn, Kishida, Gu, Lohrenz, Harvey, Alford, Smith, Yaffe, Hibbing, Dayan and Montague2014), to name a few. Therefore, it is not clear how much these failed replications tell us about the theory underlying the negativity bias literature or the measures, sample representativeness, and geographical/cultural limitations (see Smith & Warren, Reference Smith and Warren2020).
We try to address these mixed findings in our study by (1) explicitly focusing on sample-related factors (racial/ethnic diversity) and (2) using multiple measures of negativity bias (physiology and recall). Some existing work has examined cross-country differences (Bakker et al., Reference Bakker, Schumacher, Gothreau and Arceneaux2020; Fournier et al., Reference Fournier, Soroka and Nir2020), but this work has not done much to theorize why there might be variation across countries or cultures. Looking at negativity bias in news, Soroka, Fournier, and Nir (Reference Soroka, Fournier and Nir2019) suggest that cultures may vary in their negativity bias because of different ways of dealing with anxiety. However, there has yet to be any theorization as to why the effects of negativity bias might differ across groups. Further, we are more interested in the ways in which group membership related to social status affects the ways in which one perceives policies as threatening, disgusting, or neither. Racialization imbues people with very different life experiences, especially in the United States. Therefore, we focus on the role of race/ethnicity in American politics, as there is ample research on race and ethnicity in American politics on which to build. It is also worth noting that our main focus is race/ethnicity, but inherent in our expectations of how race/ethnicity matters is an acknowledgment of the distinct roles of threat versus disgust and of distinct issue domains of political ideology.
Policing/criminal justice
Among majority-White samples, physiological response to threat as well as threat sensitivity more broadly are associated with increasing support for support for protective entities such as the military and police (Hetherington & Suhay, Reference Hetherington and Suhay2011; Oxley et al., Reference Oxley, Smith, Alford, Hibbing, Miller, Scalora, Hatemi and Hibbing2008). The argument is that a state-sponsored military or police force offers protection from threats. Yet, the relationship that public authorities, such as law enforcement, have with minorities is not as amicable as it is with White people. The U.S. criminal justice system disproportionately targets Latinxs and African Americans (e.g., Pettit & Gutierrez, Reference Pettit and Gutierrez2018). “The police” are often a threat to the lives of minorities (Edwards et al., Reference Edwards, Lee and Esposito2019), and this is reflected in their attitudes toward the police (Bolger et al., Reference Bolger, Lytle and Bolger2021; Peck, Reference Peck2015). Notably, however, the dynamic between police and minorities may not be equal across racial and ethnic groups. Specifically for our purposes, the views of Asian Americans tend to resemble those of Whites (Wu, Reference Wu2014). This fits with findings on the “whitening” that may occur among many Asian Americans (Tuan, Reference Tuan1999; Zhou, Reference Zhou2004). To understand these expectations, it is critical to understand what “whiteness” is and why Asian Americans might differ from other minority groups in their relationship to it. Whiteness is a political concept having more to do with a group’s accumulation of status and wealth in society than with anything related to biology or any innate characteristic (e.g., Dominguez, Reference Dominguez1993; Rasmussen et al., Reference Rasmussen, Nexica, Klinenberg and Wray2001). It is fluid, and for groups that do not fit cleanly into a black or white category, it is something that can be striven for as a “mark of and a tool for material success” (Zhou, Reference Zhou2004; see also Duster, Reference Duster, Rasmussen, Klinenberg, Nexica and Wray2001).
Depending on the domain, racial groups can serve different purposes in upholding the racial hierarchy that keeps Whites on top (e.g., Masuoka & Junn, Reference Masuoka and Junn2013). Unlike Latinxs, Asian Americans have been painted as the “model minority” since the mid-1960s, a stereotype that presents Asian Americans as having achieved the American dream through a culture of hard work, family solidarity, and self-discipline (Zhou, Reference Zhou2004). This stereotype serves a purpose—it “reinforces the myth that the United States is devoid of racism and accords equal opportunity to all, fostering the view that those who lag behind do so because of their own poor choices and inferior culture” (Zhou, Reference Zhou2004, p. 33). Therefore, Asian Americans still face discrimination, but the racial hierarchy is upheld in part by propping up the model minority stereotype of Asian Americans. Different institutions and policies therefore represent different levels of threat (or protection) to different ethnoracial groups depending on how each group is racialized.
In sum, the racial hierarchy in America does not benefit from casting Asian Americans as threats the same way that it casts Latinxs as threats. We suggest that the relationship between negativity bias and attitudes regarding the police and the criminal justice will vary along ethnoracial lines because of these dynamics. In particular, while conservative criminal justice and police-related policies represent protection from the threat to Whites and Asian Americans, such policies represent a threat to Latinxs. It is important also to note that since the beginning of the COVID-19 pandemic, anti-Asian hate crimes have risen substantially (Gover et al., Reference Gover, Harper and Langton2020). This may further contribute to the dynamics we discuss here. Although this is a case in which Asian Americans are painted as a threat, in terms of perceptions of the police and the criminal justice system, Asian Americans may be more likely to view the police as offering protection. Given this theoretical framework, the role of negativity bias should be specific to threat rather than disgust.
H1: For Whites and Asian Americans, negativity bias regarding threat is associated with conservative views on the police and the criminal justice system, but for Latinxs, this relationship is reversed.
Immigration
Immigration is intimately connected to the idea of group-status loss and the decline of influence/power among White people (e.g., Major et al., Reference Major, Blodorn and Major Blascovich2018), and it has become racialized such that immigration attitudes are driven largely by attitudes toward Latinxs and Asian Americans (Citrin & Sides, Reference Citrin and Sides2008; Pérez, Reference Pérez2010, Reference Pérez2016). For minorities such as Latinxs and Asian Americans, however, we expect this issue to be perceived differently. Assessing exactly how these perceptions vary across race/ethnicity is a bit complicated. One lens through which to consider these differences is that of threat. Many traditional theories of immigration attitudes focus on the role of perceived economic, sociotropic, or symbolic threats (see Hainmueller & Hopkins, Reference Hainmueller and Hopkins2014, for a review). If immigrants are perceived as threats, it should not be surprising that those high in threat sensitivity are most opposed to immigration. Indeed, recent work has found this to be the case using physiological threat sensitivity measures (Mustafaj et al., Reference Mustafaj, Madrigal, Roden and Ploger2022). However, we might expect this to be the case only among Whites. For racial and ethnic minorities, it may be that anti-immigration policies represent a threat rather than protection from a threat, especially as members of these groups more often have close relationships with immigrants or are perceived as being immigrants even though they are native-born Americans (e.g., Armenta, Reference Armenta2017; Tuan, Reference Tuan1999).
We may also consider this issue through the lens of disgust. A good deal of political psychology work has considered the behavioral immune system (BIS) as central to many political attitudes. The BIS is thought to be an evolved set of adaptive psychological mechanisms by which individuals avoid contamination by using social information as a heuristic for assessing the probability of pathogen risk (Tybur & Lieberman, Reference Tybur and Lieberman2016), and it has been shown to underlie a host of political attitudes (e.g., Aarøe et al., Reference Aarøe, Petersen and Arceneaux2017, Reference Aarøe, Petersen and Arceneaux2020; Kam & Estes, Reference Kam and Estes2016; Ksiazkiewicz & Friesen, Reference Ksiazkiewicz and Friesen2020; Tybur et al., Reference Tybur and Lieberman2016), including attitudes toward immigration, foreigners, and refugees (Kam, Reference Kam2019; but see Peterson, Gonzalez, & Schneider, Reference Peterson, Gonzalez and Schneider2017). In a similar vein, Cheon, Christopoulos, and Hong (Reference Cheon, Christopoulos and Hong2016) find that cultural fusion is associated with disgust, especially among individuals who are high in patriotism. Finally, work on the stereotype content model (Fiske et al., Reference Fiske, Cuddy, Glick and Xu2002) suggests that immigrants are stereotyped as cold and incompetent, which should be associated with feelings of disgust. Taken together, there is ample literature to suggest that negativity bias in disgust (rather than, or perhaps in addition to threat) predicts conservatism on immigration issues. That said, we should expect this to be mainly evident with regard to Whites. Among members of groups more closely connected to migrants or perceived as migrants (Latinx and Asian Americans), we do not expect such a relationship to exist. Unlike with threat, however, we do not have any reason to expect the relationship to be reversed among these groups.
H2a: For Whites, negativity bias regarding with threat is associated with conservative views on immigration, but for Asian Americans and Latinxs, this relationship is reversed.
H2b: For Whites, negativity bias regarding with disgust is associated with conservative views on immigration, but for Asian Americans and Latinx, this relationship is not significant.
Economic redistribution
We expect a similar process to be evident for attitudes toward economic redistribution as for attitudes toward immigration. Poverty and welfare have been racialized in the United States (Gilens, Reference Gilens2009; Harell et al., Reference Harell, Soroka and Iyengar2016). Recently, Latinxs have also been subsumed into the racialization of welfare (Hussey & Pearson-Merkowitz, Reference Hussey and Pearson-Merkowitz2013; Rose & Baumgartner, Reference Rose and Baumgartner2013), and so we expect economic redistribution to pose a threat to Whites but to mitigate the threat to minorities. However, similar to with policing/criminal justice, this same racialization has not been evident for Asian Americans, who are often depicted as the “model minority” or “honorary Whites” (Takaki, Reference Takaki, Kurashige and Murray2016; Tuan, Reference Tuan1999), and so we expect Asian Americans to resemble Whites in this regard. In terms of threat versus disgust, although there certainly is some research linking antipoverty attitudes with disgust (e.g., Clifford & Piston, Reference Clifford and Piston2017; Fiske, Reference Fiske2010), this work tends to focus on how disgust is evoked toward poor people rather than toward redistributive or poverty-alleviating policies, and we have no reason to expect racial/ethnic differences in that relationship. Therefore, our expectations revolve around the role of threat.
H3: For Whites and Asian Americans, negativity bias regarding threat is associated with conservative views on economic redistribution, but for Latinxs, this relationship is reversed.
Religious conservatism
Religious conservatism is argued to be a powerful force behind social conservatism and Republican partisanship (Layman & Carmines, Reference Layman and Carmines1997). In the biology and politics literature, it is argued that social issue attitudes are key to the relationship between ideology and negativity bias, as socially conservative policies offer protection from threats by preserving the stability of the social unit (e.g., Oxley et al., Reference Oxley, Smith, Alford, Hibbing, Miller, Scalora, Hatemi and Hibbing2008; Smith et al., Reference Smith, Oxley, Hibbing, Alford and Hibbing2011a) and protecting individuals from disgust-related threats (Terrizzi et al., Reference Terrizzi, Shook and McDaniel2013). The predominant explanation for why negativity bias may be foundational to religious conservatism is that negativity bias is associated with moral traditionalism (Friesen & Ksiazkiewicz, Reference Friesen and Ksiazkiewicz2015; Smith et al., Reference Smith, Oxley, Hibbing, Alford and Hibbing2011b). According to this line of thinking, traditional moral values offer a social binding for group living that maintains consistency and reduces uncertainty in social life, thereby decreasing anxiety. In this sense, religious conservatism represents the fulfillment of the psychological need for order and certainty, which runs common through religiosity and political conservatism (Friesen & Ksiazkiewicz, Reference Friesen and Ksiazkiewicz2015).
To some extent, we do not expect the basic link between disgust sensitivity and a desire for purity to vary across race and ethnicity. However, we do expect the link between disgust sensitivity and the politically conservative manifestations of religiosity in the United States to vary across race and ethnicity. Churches are not race-neutral, and they can help produce shared racial identity, race consciousness, and linked fate (e.g., Dawson, Reference Dawson1994; White & Laird, Reference White and Laird2020). Further, the effects of religiosity on social conservatism are much weaker among Latinxs than among Whites (Kelly & Morgan, Reference Kelly and Morgan2008; McDaniel & Ellison, Reference McDaniel and Ellison2008). Finally, there is a clear historical trend of pro-White racial motivations underlying the connection between religiosity and right-wing politics (e.g., Bracey & Moore, Reference Bracey and Moore2017; Claassen & Povtak, Reference Claassen and Povtak2010; Fones-Wolf & Fones-Wolf, Reference Fones-Wolf and Fones-Wolf2015), and the sexual purity often central to religious conservatism has historically been used as a pretext for European colonization (Fone, Reference Fone2000). More broadly, using appeals to religious or spiritual purity has often been a vehicle for the promotion of one racial group’s domination over another (e.g., Weitz, Reference Weitz2003). Taken together, the social protections afforded by religion may exist cross-racially—that is, moral traditionalism should be more appealing to people high in negativity bias regardless of their race/ethnicity. However, politically conservative policy positions are not necessarily synonymous with moral traditionalism, and different religious sects and denominations can promote different policy stances on issues like abortion, gay marriage, and even biblical literalism. Politically conservative issue stances tend to reflect not only moral traditionalism but also pro-White ideology. Therefore, the connection to right-wing politics and conservative policies may be unique to Whites.
H4: For Whites, negativity bias is associated with conservative views on religious conservatism issues, but for Asian Americans and Latinxs, this relationship is not significant.
Deviations from preregistration: Brief
The timeline we anticipated for this study was initially much more aggressive, but because of unforeseen delays in recruiting participants from the local community, we only collected physiology data on a limited sample of individuals (n = 3; see “Deviations from Preregistration: Details” section for details) and opted to switch to an entirely online data collection format instead. Using an online convenience sample, we were able to recruit a full sample and administer an online version of the recall task (described later) to fully test our hypotheses but using only one measure of negativity bias (recall). We did not collect physiology data from this online sample. What follows is our preregistered plan, but please see the “Deviations from Preregistration: Details” section for the modifications that were done in light of the online data collection.
Research design
Ethics
The Institutional Review Board (IRB) at the University of Arizona approved this study. Participants could stop or withdraw at any point during the study and were debriefed after completion of the study. The full lab protocol, including details of the in-lab procedures, proctor instructions, informed consent, debriefing, physiological equipment set up/attachment, and physiological data processing, as well as sample stimuli, can be found in the Appendix (see Settle et al., Reference Settle, Hibbing, Anspach, Carlson, Coe, Hernandez, Peterson, Stuart and Arceneaux2020).
Sample
We will recruit 174 nonstudent adults from the general community in Tucson, Arizona, using flyers and online solicitations: 58 each who identify as non-Latinx White, Latinx (including all racial identities within Latinx),Footnote 2 and non-Latinx Asian American. In exchange for $25 in compensation, participants will come to the Frances McClelland Institute at the University of Arizona, which houses the necessary computer and physiology equipment, to complete the hour-long study. To ensure variation in political attitudes within each racial/ethnic group for this study, we will ask prospective participants their party identification (ID) and ideology (using the same question as in our survey measures; see the Appendix for recruitment materials). If, as we are recruiting participants, we see that more than 60% (n = 35) of our sample within any racial/ethnic group has the same party ID and/or ideology, we will restrict recruitment so as not to allow any more individuals with those political views to participate from that racial/ethnic group.
Experimental design overview
The study design will largely mirror existing work on negativity bias and ideology, except with more targeted ideology and issue attitude measures. Negativity bias will be assessed in two ways. First, we will assess negativity bias using a physiology protocol, as physiological measures have been the primary tool for assessing the relationship between ideology and negativity bias in existing research. In short, negativity bias will be measured as the difference in physiological reactivity to negative relative to positive images. However, evidence of a relationship between ideology and negativity bias has not been restricted solely to physiological measures, and so we will also incorporate a memory recall task used in prior research, in which negativity bias will be operationalized as the difference in recall accuracy for negative relative to positive images (Mills et al., Reference Mills, Gonzalez, Giuseffi, Sievert, Smith, Hibbing and Dodd2016). This will allow us to measure negativity bias in two distinct ways so that our results are not dependent on a single operationalization of negativity bias, which, as explained earlier, is one of the possible reasons for the mixed findings in the literature.
We do not have a priori expectations for whether results should differ across these different measures of negativity bias. Although the measures are quite distinct operationally and may tap different neural processes, the latent construct tapped by both measures is assumed to be negativity bias, and negativity bias has been found to predict conservatism using both measures. Therefore, we utilize both measures as a way of increasing the convergent validity of our study. To be clear, if differences are found in our results across measures of negativity bias, they are interpreted in a post hoc manner rather than a priori. If we find divergent results across our two measures of negativity bias and only one supports our hypotheses, then we will consider these to be mixed results and speculate as to what different underlying psychological processes in the measures might explain the results.
Physiological stimuli, data, and measures
After filling out the informed consent form, participants will engage in the physiology task.Footnote 3 In line with prior work, respondents will view a series of images in randomized order for 12 seconds each while hooked up to physiological equipment. The interstimulus interval between images will be 20 seconds, during which participants will view a fixation cross at the center of the screen. Thirty-two photos were chosen to cover four domains: disgusting, threatening, neutral, and positive. A combination of photos was chosen based on prior work (Bakker et al., Reference Bakker, Schumacher, Gothreau and Arceneaux2020; Fournier et al., Reference Fournier, Soroka and Nir2020), which has utilized images from a range of other studies that have established the relationship between negativity bias and ideology (Ahn et al., Reference Ahn, Kishida, Gu, Lohrenz, Harvey, Alford, Smith, Yaffe, Hibbing, Dayan and Montague2014; Dodd et al., Reference Dodd, Balzer, Jacobs, Gruszczynski, Smith and Hibbing2012; Gruszczynski et al., Reference Gruszczynski, Balzer, Jacobs, Smith and Hibbing2013; Oxley et al., Reference Oxley, Smith, Alford, Hibbing, Miller, Scalora, Hatemi and Hibbing2008; Smith et al., Reference Smith, Oxley, Hibbing, Alford and Hibbing2011a), as well as several images not used in prior work. These images were largely from the International Affective Picture System (IAPS) but also included some images that were novel/unique to that study (see the Appendix for image reference numbers and source).
Physiological arousal will be measured while participants view each image. Electrodermal activity (EDA) will be captured by measuring skin conductance levels (SCL) with a GSC bioamplifier housed in a BioNex 8-Slot module manufactured by MindWare, which will transmit the physiological recordings to BioLab, a physiological data recording computer program. Per best practices, sensors will be placed on the index and ring fingers of the participants’ non-dominant hand. Prior to stimuli presentation, participants will do nothing for 3 minutes to acclimate them to lab for the purposes of stabilizing their EDA.
Recall task stimuli, data, and measures
The recall task will be identical to that used by Mills et al. (Reference Mills, Gonzalez, Giuseffi, Sievert, Smith, Hibbing and Dodd2016), except that we will use fewer trials to preserve time, and we will add additional images not used in that study so that negative images can be divided into threatening and disgusting. The task used 200 pictures, 100 from IAPS and 100 from the Geneva Affective Picture Database (GAPED; Dan-Glauser & Sherer, Reference Dan-Glauser and Scherer2011). Images were selected to fit four categories: 50 each of threatening, disgusting, neutral, and positive. In a study phase, participants will view 124 of these images for 2 seconds each. Then, in a test phase, participants will be shown the full 200 images (half of which they saw in the study phase) and asked whether they have seen each image previously (the first and last 12 images from the study phase are neutral “buffers” and not used in this phase). Images during the test phase will be shown until a response is registered (via the “f” key for previously shown images or the “j” key for novel images).
Survey measures
Our key survey measure is political ideology, but we are particularly concerned with specific domains of political orientation: policing/criminal justice, immigration, economic redistribution, and religious conservatism. Existing work has relied heavily on modified versions of the Wilson-Patterson (W-P) Conservatism index (Wilson & Patterson, Reference Wilson and Patterson1968), which asks respondents how they feel toward a variety of “hot-button” issues in contemporary American politics (Hibbing et al., Reference Hibbing, Smith and Alford2013). In order to maximize comparability with existing research, we will utilize a modified and extended version of this scale and ask people to rate agreement with 25 issues, including some items from prior work (see Hibbing et al., Reference Hibbing, Smith and Alford2013) but also items tapping the four aforementioned domains specifically (separately for policing and criminal justice; see explanation later in this section). See the Appendix for the full scale as well as the items used for each issue domain. Index scores will be created by taking the average of scores on items for each category separately.Footnote 4
The limitation of the W-P index is that it is mainly oriented toward capturing ideology in a broad sense, and yet reasonably validated and/or more “robust” scales exist for measuring attitudes related to the specific issue domains we are interested in. Therefore, we also will include some additional scales tapping attitudes on each of the four domains we were interested in. Our expectations for these measures are identical to what we expected using the W-P index. As with our two measures of negativity bias, we take a conservative approach to interpretating results in the case of divergent findings. To be clear, we expect the results to be the same across measures of the same construct, but if they differ, we assess the possible reasons for the divergence in a post hoc manner. That said, in the case of these political attitudes, we are somewhat more confident in the reliability of the scales described later than in the W-P index. Although the W-P index maximizes comparability across studies and issue domains, the items are much less validated (some have never been used before).
To measure attitudes toward policing and criminal justice, we will use two different scales. Although are expectations are identical for policing and criminal justice and we view these issue domains as parallel in their relationship with negativity bias across race/ethnicity, policing and criminal justice attitudes are distinct enough that we should measure them separately. For criminal justice attitudes, we adapt items from previous research on the punitive attitude scale (Dowler, Reference Dowler2003), which includes 11 items: To what extent do you favor or oppose the following items—government focusing on punishment, death penalty, retribution as the most important sentencing objective for adults/juveniles, parole (reverse-coded), early release for good behavior (reverse-coded), shorter sentences (reverse-coded), adult trials for juveniles accused of property crime/drug crime/violent crime, stiffer sentences for juveniles? Each item ranges from 1 (strongly oppose) to 5 (strongly favor). A composite score will be calculated using the average of these items (α = .89; M = 2.75, SD = .85).
To measure attitudes toward the police, we will use a slightly modified Perceptions of Police Scale (POPS; Nadal & Davidoff, Reference Nadal and Davidoff2015), which asks participants, on 5-point Likert scale, how much they agree with statements about the police. This scale consists of two factors: a general attitudes toward police factor with items such as “police protect me” and “police are friendly,” and a perceptions of bias factor with items such as “the police do not discriminate” and “police officers are unbiased.” For both factors, composites scores will be created by averaging all items within each factor separately (POPS-G: α = .97, M = 3.37, SD = 1.07; POPS-B: α = .96, M = 2.39, SD = 1.25). Importantly, our expectations are identical across both factors, although given our theory, it may be the case that our findings are stronger with regard to the perceptions of bias factor than the general attitudes toward police factor. Divergent results are interpreted in a post hoc, speculative manner, as with other constructs with multiple measures.
To measure attitudes toward immigrants, we will utilize items based on existing research (Iyengar et al Reference Iyengar, Jackman, Messing, Valentino, Aalberg, Duch and Kobayashi2013; Mustafaj et al., Reference Mustafaj, Madrigal, Roden and Ploger2022; O’Rourke & Sinnott, Reference O’Rourke and Sinnott2006). Respondents will be asked (1) to place themselves on a 5-point scale about increasing or decreasing the number of immigrants from foreign countries to live in the United States; (2) to place themselves on a 5-point scale about whether the impact of immigration is favorable or unfavorable to the country; (3) to what extent they agree or disagree that cultural diversity due to immigration will benefit the country; and (4) to what extent they think illegal immigration is an important national problem. A composite score was created by averaging these items (α = .78; M = 2.63, SD = .90).
To measure views toward economic redistribution, we will include a variety of items adapted partly from the American National Election Studies and partly from other research (Zimmerman & Reyna, Reference Zimmerman and Reyna2013). These items included: (1) do you favor or oppose increasing income tax on people making over one million dollars per year? (5-point Likert scale); (2) do you favor or oppose the government trying to reduce the difference in incomes between the richest and poorest households? (5-point Likert scale); (3) a feeling thermometer for people on welfare (0–100); and (4) a feeling thermometer for big business (0–100). We averaged the first two items to make one variable (α = .77; M = 1.98, SD = 1.06) and created a difference variable using the second two (feelings toward big business minus feelings toward people on welfare; M = –17.75, SD = 34.69). We will follow the same protocol as outlined earlier for possible divergent findings across measures.
Regarding religion, we will include separate measures of religiosity and religious social conservatism. To measure religiosity, we adapt and average together two items that are used to measure religious belief (Glazier, Reference Glazier2017). Respondents will be asked, (1) how much guidance religion provides them in day-to-day life and (2) the extent to which they agree that “God has a plan and I have a part to play in it” (α = .89; M = 2.59, SD = 1.47). For religious social conservatism, we will include classic measurements for social ideology (Weber et al., Reference Weber, Federico and Feldman2021). These items include (1) feeling thermometers for gays, feminists, Christian fundamentalists, and anti-abortionists (feminists and gays reverse-coded); (2) when should abortion be allowed on a scale from never permitted to never forbidden?; and (3) to what extent do you agree gays/lesbians should be able to adopt children? A composite score was calculated by rescaling all these items to range from 0 to 1 and averaging them (α = .84; M = .31, SD = .23). Regarding potentially divergent findings for religiosity versus religious social conservatism, we explicitly expect different results for religiosity versus religious conservatism (see hypotheses). We expect negativity bias to predict religiosity regardless of race/ethnicity, but for race/ethnicity to matter when it comes to religious conservatism. Scores for each issue domain broken down by race/ethnicity are shown in Table 1.
Table 1. Conservatism across issue domain/measure and race/ethnicity.
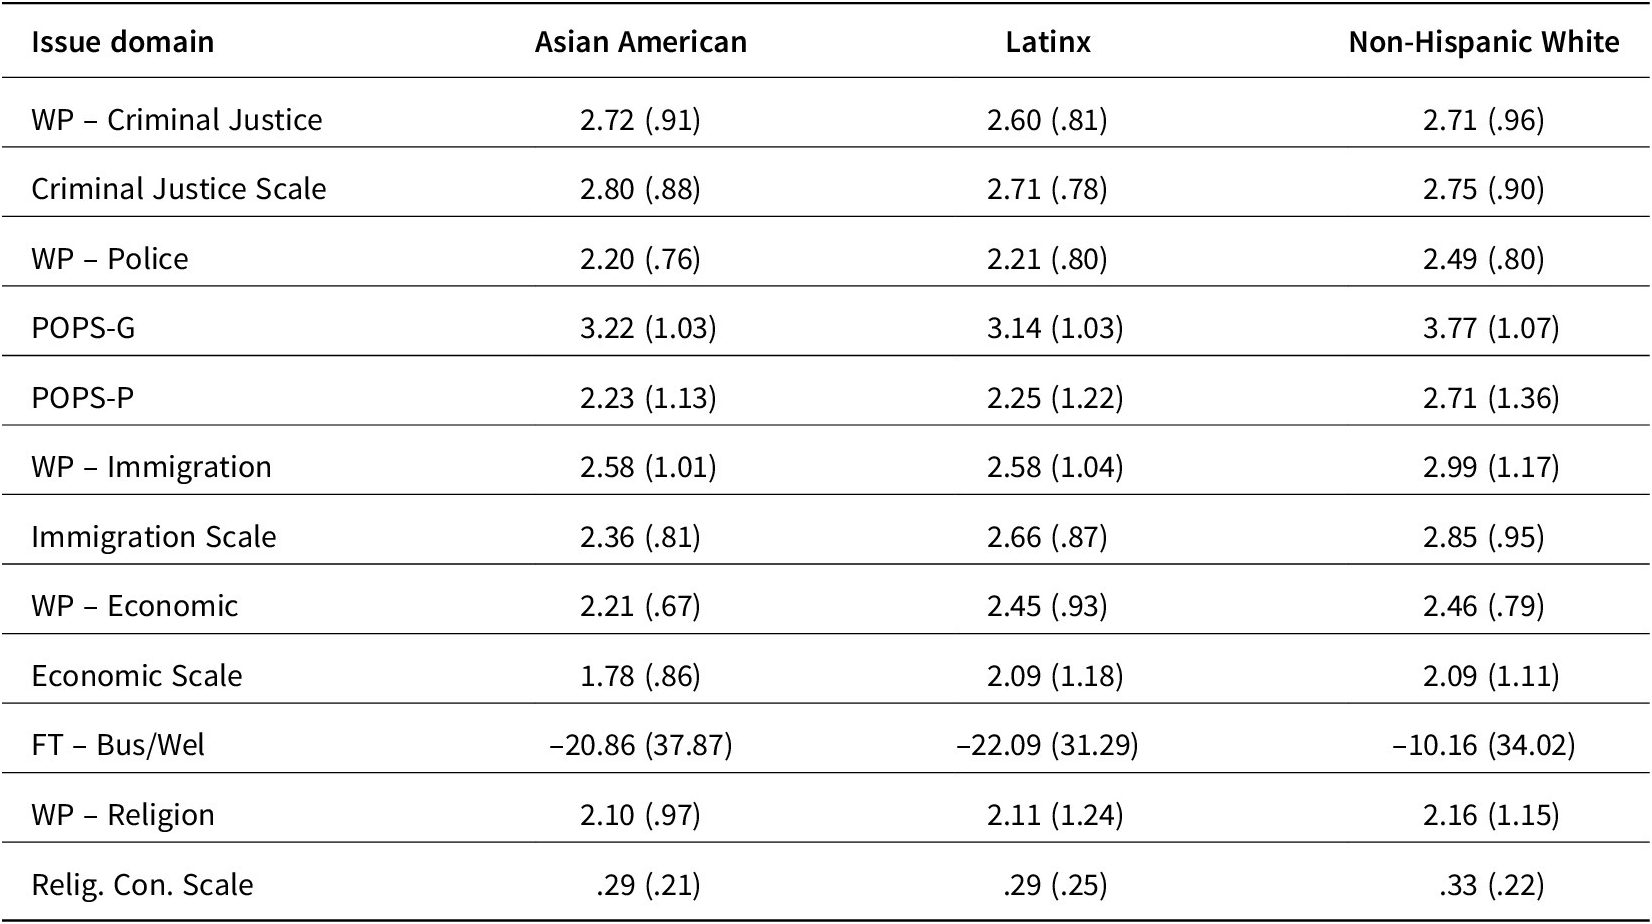
Note: Cells contain means with standard deviations in parentheses; WP = Wilson–Paterson; POPS = Perceptions of Police Scale (G = General; P = Perceived Bias); FT – Bus/Wel = Feeling Thermometers (Big Business – Welfare Recipients).
Extra measures
We will include several measures and survey batteries that were not directly linked with our hypotheses but will instead serve as either control variables in our analyses and/or independent or dependent variables in future analyses that are not a part of this preregistration. Specifically, racial attitudes will be assessed using several existing scales. Racial resentment will be measured using the classic four-item measurement by Kinder and Sanders (Reference Kinder and Sanders1996), as well as the Asian Modern Racism Scale (Son Hing, Li, & Zanna, Reference Son Hing, Li and Zanna2002), and an adaptation of the original racial resentment items focusing on Latinxs. We also will include measures of racial/ethnic identity, consciousness, and linked fate drawn from the existing literature (e.g,. Jardina, Reference Jardina2019). The specific questions can be found in the Appendix.
Control variables
We will control for demographic variables, including age, gender, education level, income. Besides these variables, we will also control for whether they were born in the United States, whether English is their first language, and their interests in politics. The exact questions and response options can be found in the Appendix. For stimulus-level analyses (described later), we will also control for some variables that vary across trials (images). For the stimulus-level physiology analyses, this just includes image order (where the image was in the randomized presentation list). For the recall analyses, this includes image order as well as whether the image was novel (thus controlling for correctly identifying images one has seen before as being seen versus correctly identifying images one has not seen before as not being seen), response time (to control for speed-accuracy tradeoff; see Heitz, Reference Heitz2014) (Mdn = .94 seconds, SD = 2.18), and whether the image depicted a human (approximately 34% of the images depicted humans).
Outcome-neutral criteria
Several outcome-neutral criteria will need to be met regarding the data for us to consider this a successful test of our hypotheses. We expect to have reasonable variation in our primary measures of interest. Variation in race/ethnicity will be guaranteed through sample recruitment, and recruitment procedures also seek to obtain variation in political attitudes (see the Sample section and recruitment materials in Appendix). Given prior research, we also expect decent variation in physiological and recall-based negativity bias. Importantly, we expect to see negativity bias on both measures (physiology and recall) in the aggregate. If we do not observe a negativity bias in the aggregate, this calls into question the degree to which we properly measured physiological reactivity and recall in the first place, as negativity bias has been well-established in much other research. Finally, various analyses rely on measures composed of the aggregate of several items. This is true for all our political attitude variables as well as our physiology variables (as various images were categorized together as threatening, disgusting, neutral, or positive). For all such measures, we calculate Cronbach’s alpha to assess reliability (for physiology measures, this will be calculated for SCR for each category of images). For any measure with low reliability (α < .6), we explicitly mention this limitation and conduct analyses on separate items. We have no hypotheses for any analyses on separate items that were initially expected to form a reliable scale. As described earlier, divergent results across items thought to measure the same construct are interpreted with caution in a post hoc, speculative manner.
Analyses
Omissions
There are several participant-level and stimulus-level factors that may lead to some data points being excluded from analyses. First and foremost, participants who do not consent to have their data used in the analyses will be omitted (n = 0). Participants will also be excluded who (1) have missing data for a dependent variable or main independent variable (on a listwise basis per analysis), (2) withdraw from the study partway through completion (n = 0), (3) have problematic physiology data due to sensor failures (omitted from physiology analyses only; see details later) (n = 0), (4) have response times during the recall task of less than 250 milliseconds (ms) or greater than 5,000 ms (n = 943 out of 36,000 trials) (in line with Mills et al., Reference Mills, Gonzalez, Giuseffi, Sievert, Smith, Hibbing and Dodd2016), or (5) other technical failures that make the physiology or recall data unusable (n = 0).Footnote 5 At the stimulus level, if a technical failure only affects one or several trials, those trials will simply be omitted from the stimulus-level analyses, and the averages used for the participant-level analyses will exclude those trials. We plan to conduct analyses to ensure that omissions are not significantly related to ideology (using each of the four issue domains as well as self-report ideology), party ID, race/ethnicity, age, sex, income, and education. If significant differences in the probability of being omitted exist along one of these dimensions, we will discuss these as a limitation of the study and present analyses in which omissions are used as a control variable.
Physiological measures are notorious for being delicate, and so we defer to the guidelines and recommendations set out by Settle et al. (Reference Settle, Hibbing, Anspach, Carlson, Coe, Hernandez, Peterson, Stuart and Arceneaux2020) for data cleaning and omissions. Specifically, artifacts in the EDA data due to participants’ movements, sneezes, coughs, loose sensors, and the like will be tagged and accounted for using standard procedures in the MindWare data analysis software (except in the case of loose sensors that remain loose for the entire physiology task—these participants will be excluded from physiology analyses entirely). About 10% of participants are expected to be “nonresponders”—that is, individuals who simply do not show skin conductance reactivity at all (Braithwaite et al., Reference Braithwaite, Watson, Jones and Rowe2013). These participants will be excluded from analyses.
Statistical significance
An α value of 0.05 will be used as our cutoff for statistical significance in all analyses. Therefore, all tests are two-tailed. To correct for multiple comparisons, we will apply Games-Howell test to all pairwise comparisons, as this test is ideal for these types of analyses when groups are likely to have unequal variances (see Lee & Lee, Reference Lee and Lee2018; Sauder & DeMars, Reference Sauder and DeMars2019).
Physiology analyses
To analyze our EDA data, we will use two types of models, a participant-level approach (e.g., Bakker et al., Reference Bakker, Schumacher, Gothreau and Arceneaux2020; Dodd et al., Reference Dodd, Balzer, Jacobs, Gruszczynski, Smith and Hibbing2012; Oxley et al., Reference Oxley, Smith, Alford, Hibbing, Miller, Scalora, Hatemi and Hibbing2008) and a stimulus-level approach (Fournier et al., Reference Fournier, Soroka and Nir2020). We do this to account for any differences in results that may be attributable to modeling decisions. For all of our analyses, to process the data for analysis, we take the mean SCL for every half-second interval 2–10 seconds after each stimulus was presented, and then subtract the initial level of SCL at stimulus onset from this mean to create mean normalized skin conductance response (SCR) estimates corresponding to each stimulus.
For the participant-level analyses, political preferences will be predicted in linear regression models by SCR difference variables and dummy codes for race/ethnicity (Latinx, Asian American; White = reference category) alongside our slate of control variables. (Results from models without controls are also shown to get a sense of the effects of adding controls, but our conclusions are based off the models with controls.) The difference variables will be mean SCR (as calculated earlier for each stimulus) for each category of negative images minus SCR for positive images.Footnote 6 Therefore, our SCR variables represent the degree to which a participant is more reactive to threatening or disgusting images than to positive images.Footnote 7 We will run this main-effects model just to determine main effects of SCL and of race/ethnicity, but to test our hypotheses, we will include interactions between SCL for each negativity category and participant race/ethnicity. We will run separate models using threat versus disgust as the negativity category (rather than including SCL for both categories in the same model). Analyses will be conducted separately for the different ideological issue domains as well. Therefore, a relationship between negativity bias and political orientation will be evidenced by a significant positive effect of the SCL variables (where greater values on political orientation indicate greater conservatism regarding that particular issue domain), and our hypotheses will be tested by examining the marginal effects of SCL across the separate racial/ethnic groups in the interaction models.Footnote 8 Conclusions based on marginal effects will only be made when interactions are significant at the p < .05 level.
Importantly, for all our equations listed in this registered report, we use White as the reference category for interactions with race/ethnicity. However, we should be clear that we will switch out the reference category in all models to test all relevant pairwise differences, including Latinx versus Asian American.
Equation 1 shows the equation for participant-level physiology analyses, with full interactions and controls: Equation 1 (Eq1):
 $$ {\displaystyle \begin{array}{l} Conservatism\\ {}\hskip9em =\hskip0.35em {\beta}_0+{\beta}_1\hskip0.35em Negativity\ Bias+{\beta}_2\hskip0.35em Latinx+{\beta}_3\hskip0.35em Asian\ American+{\beta}_4\hskip0.35em Age\\ {}\hskip9em +\hskip0.35em {\beta}_5\hskip0.35em Male+{\beta}_6\hskip0.35em Education+{\beta}_7\hskip0.35em Income+{\beta}_8\hskip0.35em Political\ Interest+{\beta}_9\hskip0.35em Born\ US\\ {}\hskip9em +\hskip0.35em {\beta}_{10}\hskip0.35em English1 st+{\beta}_{11}\hskip0.35em Negativity\ Bias\hskip0.35em \ast \hskip0.35em Latinx+{\beta}_{12}\hskip0.35em Negativity\ Bias\\ {}\hskip9em \ast \hskip0.35em Asian\ American+\varepsilon \end{array}} $$
For the stimulus-level approach, data will be “stacked” such that each row represents a unique image, and SCL will be aggregated at the stimulus level (using the aforementioned calculation). Then, SCR at the stimulus level will be regressed on participant ideology, stimulus type (dummy codes for threatening, disgusting, and neutral, with positive as the reference category), and participant race/ethnicity, as well as our slate of participant-level and stimulus-level controls (see also Dodd et al., Reference Dodd, Balzer, Jacobs, Gruszczynski, Smith and Hibbing2012). These models offer main effects, whereby positive effects of the dummy variables for threatening and/or disgusting stimulus type reflect negativity bias in the aggregate. However, to assess variation in negativity bias across ideology, interactions will be modeled between each stimulus type and participant ideology. Significant positive interactions between threat/disgust and ideology indicate greater negativity bias among conservative participants.
To test our hypotheses regarding race/ethnicity, three-way interactions will be estimated between ideology, stimulus type, and race/ethnicity. If a three-way interaction is significant, it will be decomposed to determine the marginal two-way interactions between ideology and negativity bias across racial/ethnic groups. Insignificant two-way interactions indicate no relationship between negativity bias and ideology in that racial/ethnic group. Two-way interactions that are significant will be decomposed to determine the marginal effects of stimulus type across levels of participant ideology across racial/ethnic groups. These interactions and marginal effects are the basis of our hypothesis tests.Footnote 9 Analyses will again be conducted separately for the different ideological issue domains.
Equation 2 shows the equation for stimulus-level physiology analyses, with full interactions and controls, for stimulus j for individual i:Equation 2 (Eq2):
 $$ {\displaystyle \begin{array}{l} Mean\ Norm\ SC{L}_{ij}\\ {}\hskip11em =\hskip0.35em {\beta}_0+\hskip0.35em {\beta}_1\hskip0.35em Conservatis{m}_i+\hskip0.35em {\beta}_2\hskip0.35em Threatenin{g}_j+\hskip0.35em {\beta}_3\hskip0.35em Disgustin{g}_j\\ {}\hskip11em +\hskip0.35em {\beta}_4\hskip0.35em Neutra{l}_j+\hskip0.35em {\beta}_5\hskip0.35em Latin{x}_i+\hskip0.35em {\beta}_6\hskip0.35em Asian\ America{n}_i+\hskip0.35em {\beta}_7\hskip0.35em Ag{e}_i+\hskip0.35em {\beta}_8\hskip0.35em Mal{e}_i\\ {}\hskip11em +\hskip0.35em {\beta}_9\hskip0.35em Educatio{n}_i+\hskip0.35em {\beta}_{10}\hskip0.35em Incom{e}_i+\hskip0.35em {\beta}_{11}\hskip0.35em Political\ Interes{t}_i+\hskip0.35em {\beta}_{12}\hskip0.35em Born\ U{S}_i\\ {}\hskip11em +\hskip0.35em {\beta}_{13}\hskip0.35em English1s{t}_i+\hskip0.35em +\hskip0.35em {\beta}_{14}\hskip0.35em Image\ Orde{r}_j+\hskip0.35em {\beta}_{15}\hskip0.35em Threatenin{g}_j\\ {}\hskip11.35em \ast \hskip0.35em Conservatis{m}_i+\hskip0.35em {\beta}_{16}\hskip0.35em Disgustin{g}_j\hskip0.35em \ast \hskip0.35em Conservatis{m}_i+\hskip0.35em {\beta}_{17}\hskip0.35em Threatenin{g}_j\\ {}\hskip11.35em \ast \hskip0.35em Latin{x}_i+\hskip0.35em {\beta}_{18}\hskip0.35em Threatenin{g}_j\hskip0.35em \ast \hskip0.35em Asian\ America{n}_i+\hskip0.35em {\beta}_{19}\hskip0.35em Disgustin{g}_j\\ {}\hskip11.35em \ast \hskip0.35em Latin{x}_i+\hskip0.35em {\beta}_{20}\hskip0.35em Disgustin{g}_j\hskip0.35em \ast \hskip0.35em Asian\ America{n}_i+\hskip0.35em {\beta}_{21}\hskip0.35em Conservatis{m}_j\\ {}\hskip11.35em \ast \hskip0.35em Latin{x}_i+\hskip0.35em {\beta}_{22}\hskip0.35em Conservatis m\hskip0.35em \ast \hskip0.35em Asian\ America{n}_i+\hskip0.35em {\beta}_{23}\hskip0.35em Threatenin{g}_j\\ {}\hskip11.35em \ast \hskip0.35em Conservatis{m}_i\hskip0.35em \ast \hskip0.35em Latin{x}_i+\hskip0.35em {\beta}_{24}\hskip0.35em Threatenin{g}_j\hskip0.35em \ast \hskip0.35em Conservatis{m}_i\\ {}\hskip11.35em \ast \hskip0.35em Asian\ America{n}_i+\hskip0.35em {\beta}_{25}\hskip0.35em Disgustin{g}_j\hskip0.35em \ast \hskip0.35em Conservatis{m}_i\hskip0.35em \ast \hskip0.35em Latin{x}_i\\ {}\hskip11em {\beta}_{26}\hskip0.35em Disgustin{g}_j\hskip0.35em \ast \hskip0.35em Conservatis{m}_i\hskip0.35em \ast \hskip0.35em Asian\ America{n}_i+\hskip0.35em \varepsilon \end{array}} $$
It should also be noted that physiology measures based on aggregates of responses to multiple stimuli are notorious for exhibiting low measurement reliability (see Fournier et al., Reference Fournier, Soroka and Nir2020; Osmundsen et al., Reference Osmundsen, Hendry, Laustsen, Smith and Petersen2022). Therefore, much existing work includes analyses using responses to each stimulus/image separately. We will do the same as a robustness check to see how dependent our results are on particular stimuli. For these analyses, we will simply replace the appropriate stimulus type dummy variable with a dummy variable for the specific disgust or threat image.
We do not have a priori expectations for whether results should differ across these different analytic techniques. We will utilize both sets of analyses because they have both been used prominently in the existing literature and we seek to avoid our results being constrained to one particular analytic method. Therefore, we do this as a way of increasing the convergent validity of our study, similarly to why we use two measures of negativity bias. As with differences across measures of negativity bias, if differences are found in our results across analytic methods (participant level versus stimulus level), they will be assessed in a post hoc manner rather than a priori.
Recall analyses
Data will be “stacked” at the trial level, and the probability of correctly responding during the test phase will be modeled as a function of the interaction between participant ideology, participant race/ethnicity, and stimulus type, as with the stimulus-level analyses for the physiology data. Hypotheses will be tested identically to how they will be tested for the stimulus-level physiology data. Analyses will be conducted separately for the different ideological issue domains.
Equation 3 shows the equation for stimulus-level physiology analyses, with full interactions and controls, for stimulus j for individual i:Equation 3 (Eq3):
 $$ {\displaystyle \begin{array}{l} CorectRecal{l}_{ij}\\ {}\hskip10em =\hskip0.35em {\beta}_0\hskip0.35em +{\beta}_1\hskip0.35em Conservatis{m}_i+\hskip0.35em {\beta}_2\hskip0.35em Threatenin{g}_j+\hskip0.35em {\beta}_3\hskip0.35em Disgustin{g}_j\\ {}\hskip10em +\hskip0.35em {\beta}_4\hskip0.35em Neutra{l}_j+\hskip0.35em {\beta}_5\hskip0.35em Latin{x}_i+\hskip0.35em {\beta}_6\hskip0.35em Asian\ America{n}_i+\hskip0.35em {\beta}_7\hskip0.35em Ag{e}_i+\hskip0.35em {\beta}_8\hskip0.35em Mal{e}_i\\ {}\hskip10em +\hskip0.35em {\beta}_9\hskip0.35em Educatio{n}_i+\hskip0.35em {\beta}_{10}\hskip0.35em Incom{e}_i+\hskip0.35em {\beta}_{11}\hskip0.35em PoliticalInteres{t}_i+\hskip0.35em {\beta}_{12}\hskip0.35em BornU{S}_i\\ {}\hskip10em +\hskip0.35em {\beta}_{13}\hskip0.35em English1s{t}_i+\hskip0.35em +\hskip0.35em {\beta}_{14}\hskip0.35em ImageOrde{r}_j+\hskip0.35em {\beta}_{15}\hskip0.35em NovelImag{e}_j\\ {}\hskip10em +\hskip0.35em {\beta}_{16}\hskip0.35em ResponseTim{e}_j+\hskip0.35em {\beta}_{17}\hskip0.35em Huma{n}_j+\hskip0.35em {\beta}_{18}\hskip0.35em Threatenin g\hskip0.35em \ast \hskip0.35em Conservatis{m}_i\\ {}\hskip10em +\hskip0.35em {\beta}_{19}\hskip0.35em Disgustin{g}_j\hskip0.35em \ast \hskip0.35em Conservatis{m}_i+\hskip0.35em {\beta}_{20}\hskip0.35em Threatenin{g}_j\hskip0.35em \ast \hskip0.35em Latin{x}_i\\ {}\hskip10em +\hskip0.35em {\beta}_{21}\hskip0.35em Threatenin{g}_j\hskip0.35em \ast \hskip0.35em Asian\ America{n}_i+\hskip0.35em {\beta}_{22}\hskip0.35em Disgustin{g}_j\hskip0.35em \ast \hskip0.35em Latin{x}_i\\ {}\hskip10em +\hskip0.35em {\beta}_{23}\hskip0.35em Disgustin{g}_j\hskip0.35em \ast \hskip0.35em Asian\ America{n}_i+\hskip0.35em {\beta}_{24}\hskip0.35em Conservatis m\hskip0.35em \ast \hskip0.35em Latin{x}_i\\ {}\hskip10em +\hskip0.35em {\beta}_{25}\hskip0.35em Conservatis{m}_j\hskip0.35em \ast \hskip0.35em Asian\ America{n}_i+\hskip0.35em {\beta}_{26}\hskip0.35em Threatenin{g}_j\\ {}\hskip10.35em \ast \hskip0.35em Conservatis{m}_i\hskip0.35em \ast \hskip0.35em Latin{x}_i+\hskip0.35em {\beta}_{27}\hskip0.35em Threatenin{g}_j\hskip0.35em \ast \hskip0.35em Conservatis{m}_i\\ {}\hskip10.35em \ast \hskip0.35em Asian\ America{n}_i+\hskip0.35em {\beta}_{28}\hskip0.35em Disgustin{g}_j\hskip0.35em \ast \hskip0.35em Conservatis{m}_i\hskip0.70em \ast \hskip0.70em Latin{x}_i\\ {}\hskip10em +\hskip0.35em {\beta}_{29}\hskip0.35em Disgustin{g}_j\hskip0.35em \ast \hskip0.35em Conservatis{m}_i\hskip0.35em \ast \hskip0.35em Asian\ America{n}_i+\hskip0.35em \varepsilon \end{array}} $$
Robustness checks
The robustness of our findings will be partly addressed through some of the analyses described earlier (e.g., models with and without controls, running models across individual images, two types of models for physiology analyses, multiple measures of conservatism for each issue domain). To further test the robustness of our findings, we will also run models assessing whether our findings differed across: political interest, other demographic variables (age, gender, education, income), and whether the image depicts humans (for recall analyses).
Statistical power
There is extant literature upon which to base power analyses when it comes to the physiology component of this study, with effect sizes ranging from fairly large to near zero. We defer to Fournier, Soroka, and Nir (Reference Fournier, Soroka and Nir2020; see the Appendix) in using an effect size somewhere between those extremes. With a predicted R 2 of .20, 50 participants would yield a power estimate of roughly .8, and so having 50 participants in each racial/ethnic category should allow us to detect relationships between physiological negativity bias and ideology within each group at the individual level (i.e., in our participant-level analyses). This is the estimate of Fournier et al. (Reference Fournier, Soroka and Nir2020) but it also corresponds with our analysis using Gpower 3.1.9.4. Given an estimated 15% data loss due to unanticipated issues with sensors, leads, participants, and the like (see Settle et al., Reference Settle, Hibbing, Anspach, Carlson, Coe, Hernandez, Peterson, Stuart and Arceneaux2020), we will recruit an additional 8 participants per ethnoracial group. In our stimulus-level analyses, we will have 2,320 rows (58 participants × 40 images) per ethnoracial group, and so we have no reason to be concerned with power for those analyses beyond participant-level concerns addressed in the prior power analyses.
For the recall task, the effect size for the interaction between ideology and stimulus type was a quite a bit larger, and power analyses using an R 2 of .45 suggested a sample of just 13 would be necessary to replicate that effect. Although we will use fewer trials in our protocol to preserve time, 50 participants (58 accounting for anticipated data loss) in each racial/ethnic category should be sufficient for identifying interactions between negativity bias and political attitudes within that task.
Timeline
Given the length of time required to run participants through a physiology study, we will pursue an aggressive timeline, beginning the IRB process and development of study materials as soon as the proposal is accepted “in principle.” We will then make revisions based on peer review and start data collection as soon as funding is dispersed. We will begin recruitment of a community sample in March 2022.
Deviations from Preregistration: Details
Sample
We were only able to recruit 11 participants from the local community during the study period, 3 of whom had usable physiological data, and so we opted to recruit an online convenience sample using Amazon’s Mechanical Turk (MTurk) through CloudResearch.com (Litman et al., Reference Litman, Robinson and Abberbock2017) instead of continuing to recruit from the Tucson community. The sample size remained the same, but participants consisted of a broad swath of U.S. adults who fit the required race/ethnicity criteria and opted in to our study through MTurk (see Table 2 for sample demographics broken down by race/ethnicity). Given the online data collection, we could have recruited African American participants as well, which certainly would have fit well into testing our overall theoretical framework. However, we constrained our sample to the three racial/ethnic groups that we developed hypotheses for in order to adhere strictly to our preregistration. Participants were compensated $5. Further, because of the short online recruitment period, we did not utilize the 60% quotas for ensuring partisan/ideological variation. We still include the data and analysis materials that we have for the three physiology participants in our replication materials online (see physiology brief in the Appendix for details on EDA analyses and descriptive statistics).
Table 2. Sample demographics.

Experimental design
Data collection took place online instead of in person, and so we were unable to collect physiology (EDA) data. Instead, we implemented the recall task online using the launch platform Pavlovia (https://pavlovia.org/).
Survey measures
We revised our English-language question slightly to fit better with Branton’s (Reference Branton2007) acculturation measure. Further, to preserve space in the online survey, we did not include the measures of racial resentment, racial/ethnic consciousness, or linked fate mentioned earlier.
Statistical significance
Upon further investigation, the Games-Howell correction method is not appropriate for regression models, and so we switched to using the Hommel p-value adjustment method instead.
Timeline
We anticipated being able to collect data from a community sample much more quickly. However, after several months, recruitment was still very slow, and so we opted to switch to online data collection using just the recall task in mid-July 2022. Data were collected on July 25, 2022.
Results
Overall recall accuracy was 72.5%, which is somewhat lower than that found by Mills et al. (Reference Mills, Gonzalez, Giuseffi, Sievert, Smith, Hibbing and Dodd2016). In the aggregate, we found a significant negativity bias regarding disgust (77.5% accuracy) but not threat (69.1% accuracy) compared to positive (70.4% accuracy). That is, significant main effects existed whereby participants were significantly more likely to recall disgust images than positive images, but this was not the case for threat images. Unexpectedly, participants were also more likely to correctly recall neutral images (73.4% accuracy) than positive images.Footnote 10 The existence of an aggregate negativity bias regarding disgust gives us some confidence that the recall task measures are valid, but the lack of a significant bias regarding threat is noteworthy. Looking at the image pre-ratings from the IAPS and GAPED data sets, it is evident that the disgust images were substantially more negative (M = .14, SD = .10) than the threat images (M = .28, SD = .14), which may explain the difference in effects. Nonetheless, our main hypotheses concerned variation in these effects across ideology and race/ethnicity.
H1: Policing and criminal justice
Results concerning H1 are presented in Figure 1. The right panel illustrates that there was no support for our hypothesis. Across measures of conservatism regarding policing and the criminal justice system, there were no significant biases in recall related to threat, and this null effect of threat did not vary significantly across race/ethnicity. We observed some unexpected trends whereby negativity bias regarding disgust decreased as conservatism increased, and this seemed constrained to White participants, but these trends were never significant using the Hommel p-value adjustment method.

Figure 1. Tests of Hypothesis 1: Policing and criminal justice.
Notes: Each set of plots corresponds with a separate measure of conservatism. Plots on the left illustrate the valence × conservatism interactions and contain the marginal effect of each valence category (disgust, neutral, threat) relative to the reference category (positive) as it varies across levels of conservatism. As such, positive slopes indicate that recall bias in favor of that valence category increases with conservatism. Plots on the right illustrate the valence x conservatism × race/ethnicity interactions. They show the coefficients for the marginal two-way interaction terms between each valence category and conservatism separately across race/ethnicity. Positive coefficients indicate that bias in favor that valence category increases with conservatism for that race/ethnicity. Shaded regions (on the left) and bars (on the right) indicate 95% confidence intervals but see text for statistical significance using Hommel correction method.
H2a and H2b: Immigration
We found no support for H2a or H2b , as conservatism did not moderate negativity bias regarding disgust or threat, and this null interaction did not vary across race/ethnicity. These results were consistent across measures of immigration-based conservatism. Figure 2 illustrates these findings.
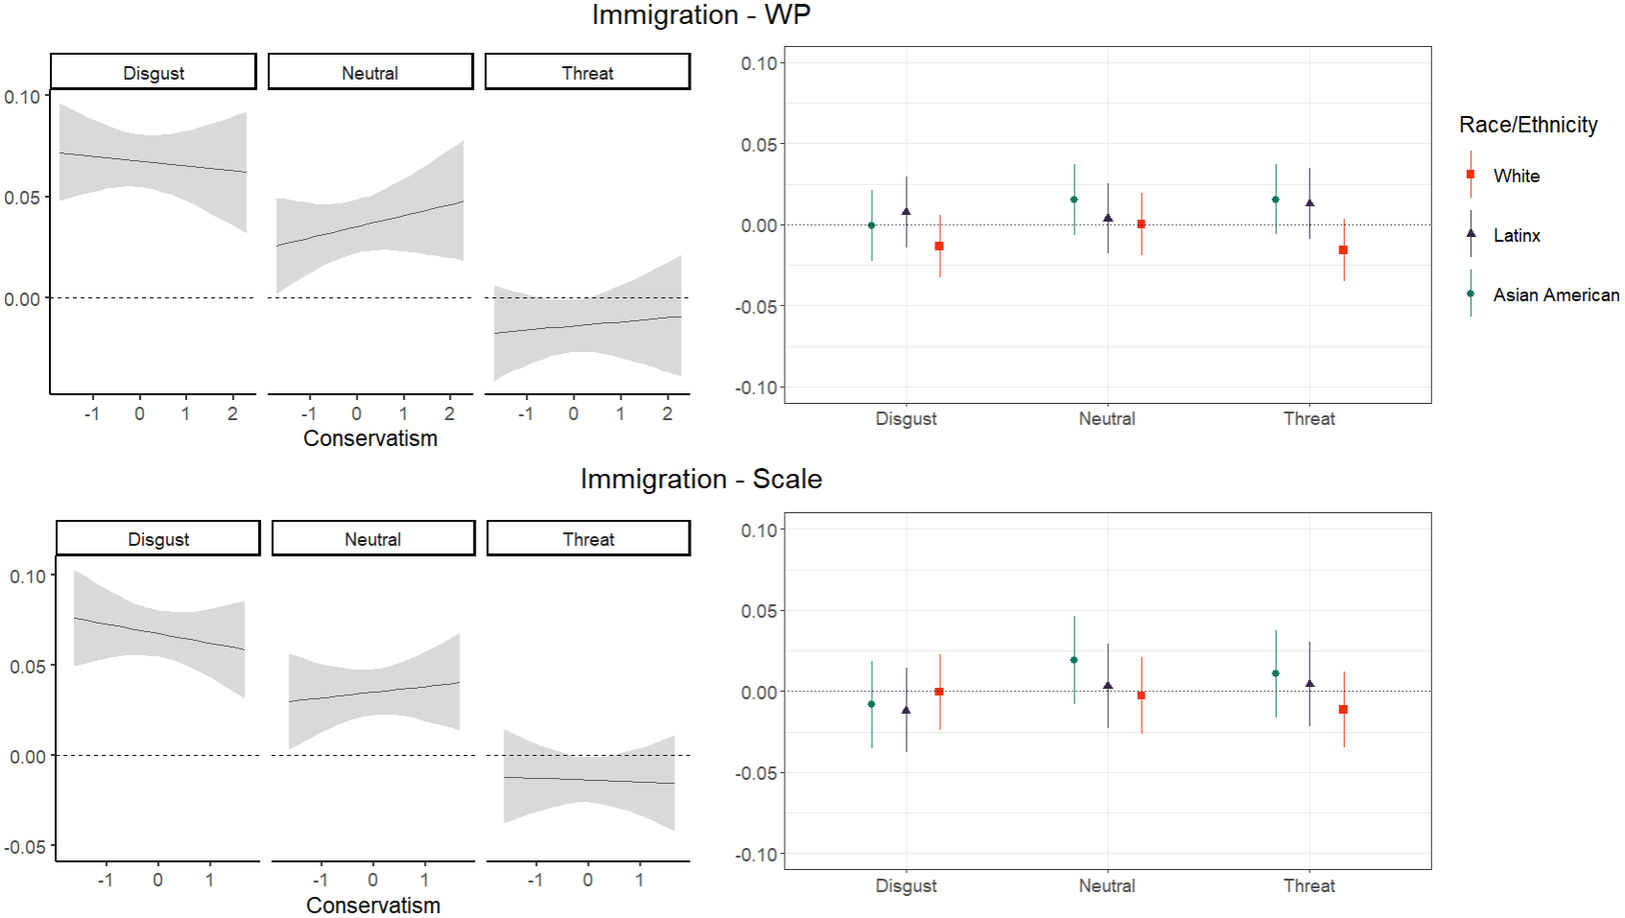
Figure 2. Tests of Hypotheses 2a and 2b: Immigration.
H3: Economic redistribution
The effects of valence did not vary across conservatism regarding economic distribution regardless of the measure used. These null interactions did not vary significantly across race/ethnicity. Therefore, we found no support for H3. Figure 3 illustrates these results.
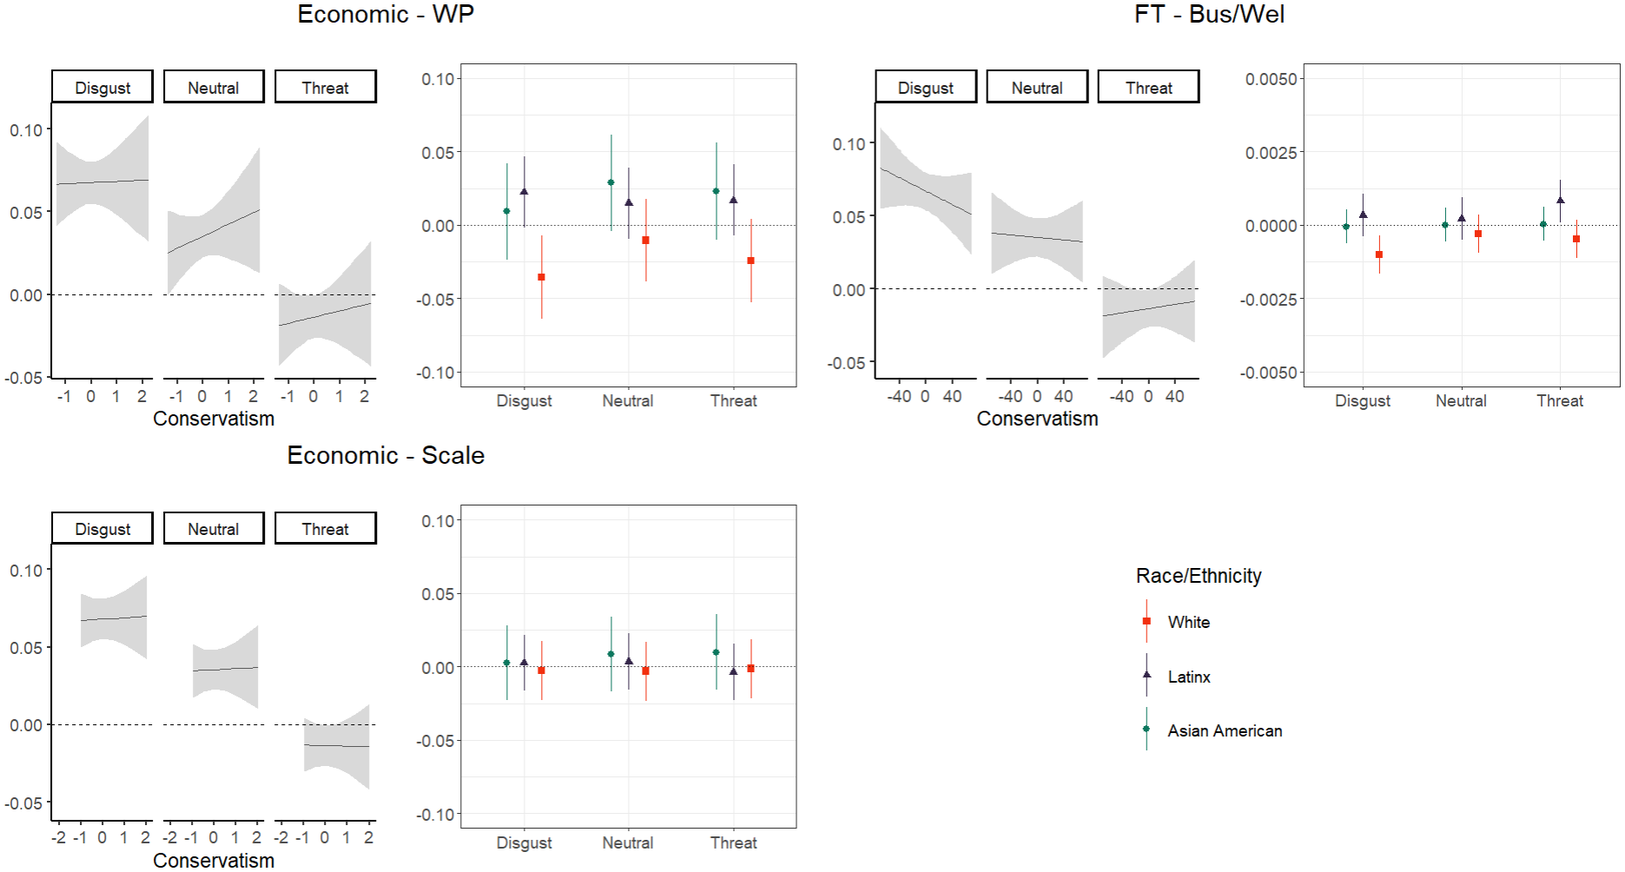
Figure 3. Tests of Hypothesis 3: Economic redistribution
Note: The different y-axis scale for the FT – Bus/Wel plot is due to the larger scale for that variable.
H4: Religious conservatism
Religious conservatism did not significantly moderate the effects of any of the valence categories regardless of race/ethnicity and regardless of the measure used. Therefore, we failed to find support for H4. These results are illustrated in Figure 4.

Figure 4. Tests of Hypothesis 4: Religious conservatism
Note: The different y-axis scale for the Religious Con. – Scale plot is due to the smaller scale for that variable.
Religiosity
We expected negativity bias regarding disgust to be associated with religiosity regardless of race/ethnicity and tested this to determine whether any effects observed in testing H4 were attributable to conservatism or sheer religiosity. We did not find any significant three-way interactions with race/ethnicity, but we also did not find religiosity to be associated with negativity bias regarding disgust.
Robustness checks
Our null findings across hypotheses did not differ significantly across any of the factors described above (political interest, age, gender, education, income, and whether the image depicts humans).Footnote 11 We also ran some additional robustness checks not included in the preregistration. Specifically, we reran our analyses using neutral as the reference category and found no differences in results (see the Replication Materials on OSF for code for these analyses).
Discussion
A prominent theory in political psychology has been that ideological conservatism emanates in part from relatively high attention and reactivity to negative stimuli in one’s environment (e.g., Hibbing et al., Reference Hibbing, Smith and Alford2014). The theory argues that individual variation in how people respond to aversive stimuli in their environment stems from evolutionary processes related to group survival. Through normal selection processes, some individuals in a group will tend to be more attuned to potential threats in their environment (e.g., enemies, predators, contaminants) than others, and these differences have social consequences. Ultimately, variation in reactivity to negative environmental stimuli can predispose people toward preferring political systems and policies that are more or less geared toward providing security against threats (Hibbing et al., Reference Hibbing, Smith and Alford2013).
The empirical work supporting this theory has shown that ideological conservatism, which is theoretically aimed more toward social protections and security from threats than liberalism, is associated with negativity bias (i.e., attending and reacting to negative stimuli more than positive stimuli) in various forms (Ahn et al., Reference Ahn, Kishida, Gu, Lohrenz, Harvey, Alford, Smith, Yaffe, Hibbing, Dayan and Montague2014; Mills et al., Reference Mills, Gonzalez, Giuseffi, Sievert, Smith, Hibbing and Dodd2016; Oxley et al., Reference Oxley, Smith, Alford, Hibbing, Miller, Scalora, Hatemi and Hibbing2008). However, the theory has undergone various theoretical and methodological critiques (e.g., Federico et al., Reference Federico, Johnston and Lavine2014; Inbar & Pizarro, Reference Inbar and Pizarro2014; Tritt et al., Reference Tritt, Inzlicht and Peterson2014), and failed replications of the physiology work that was central to the original theory (Bakker et al., Reference Bakker, Schumacher, Gothreau and Arceneaux2020; Fournier et al., Reference Fournier, Soroka and Nir2020) have left many questions about the theory’s strength (see Smith & Warren, Reference Smith and Warren2020).
In this study, we examined race/ethnicity as a possible lens through which to clarify some of the literature’s mixed findings. We originally intended to use measures of physiological reactivity as well as memory recall to explore the role of race/ethnicity, but because of practical constraints, we had to limit ourselves to recall measures. We were nonetheless able to conduct a robust test of our hypotheses using the recall data.
We found no support for our expectations, but in doing so, we also failed to replicate key elements of the original ideology–negativity bias theory. Race/ethnicity did not moderate the link between negativity bias and conservatism in any of our analyses, and so we could not find support for the idea that mixed findings may be due to variation in the ideology–negativity bias link based on race/ethnicity. We expected that race/ethnicity would substantially shape the way different political institutions and policies are perceived, thus moderating the relationship between deep-seated cognitive biases (here, negativity bias) and political preferences. We did not find this moderating effect of race/ethnicity. The lack of a role for race/ethnicity is surprising given how prominent race and ethnicity are in American politics. Race is a primary lens through which social and political experiences are filtered, and a great deal of theoretical, empirical, and anecdotal evidence shows that race matters in terms of how one perceives and feels toward the political system. Therefore, it seems quite reasonable to expect that race/ethnicity modulates the relationship between one’s basic cognitive predispositions (i.e., negativity bias) and attitudes toward the political world. Yet we found no support for this in our data. We believe this highlights the importance of replication and of publishing null findings, which is greatly aided by the use of preregistration.
That all said, we also found no significant link between negativity bias and conservatism in any of our analyses in the first place. Other work has failed to replicate the ideology–negativity bias link using physiological measures of EDA and EMG (Bakker et al., Reference Bakker, Schumacher, Gothreau and Arceneaux2020; Fournier et al., Reference Fournier, Soroka and Nir2020; Osmundsen et al., Reference Osmundsen, Hendry, Laustsen, Smith and Petersen2022), but, to our knowledge, this is the first study to fail to replicate the ideology–negativity bias link that has been identified regarding memory recall (Mills et al., Reference Mills, Gonzalez, Giuseffi, Sievert, Smith, Hibbing and Dodd2016). This is important because one proposed reason for the existing failed replications is the lack of reliability of EDA measures aimed at capturing distinct valence categories (Osmundsen et al., Reference Osmundsen, Hendry, Laustsen, Smith and Petersen2022; Smith & Warren, Reference Smith and Warren2020). Indeed, other types of measures such as those using eye tracking or fMRI have corroborated the ideology–negativity bias link and have not experienced failed replications. That said, the failed replication here regarding recall, although it is not an identical replication (we used a different, smaller set of images), suggests unreliable physiology measures may not be the only reason for the failed replications. A deeper dive into theoretical reasons for the literature’s mixed findings is likely needed.
The existing literature speaks to other theoretical and methodological possibilities for shedding light on the ideology–negativity bias link, but with particular regard to the role of race/ethnicity, it seems especially important to consider contextual factors and ways in which political issues are continuously framed as threatening, disgusting, positive, and the like to fit ever-changing political narratives. We expected deep-seated psychological tendencies regarding how people respond to environmental stimuli to affect their political preferences, and for these effects to vary based on how one is taught their racial or ethnic group fits within the social and political system. Indeed, the original ideology–negativity bias theory argues that the connection between negativity bias and politics centers on how contemporary political issues relate to “bedrock social dilemmas” (e.g., leadership styles, dealing with out-groups, enforcing norms) (Smith et al., Reference Smith, Oxley, Hibbing, Alford and Hibbing2011b). Yet, we know contemporary issues are continuously framed in different ways to target, persuade, and mobilize distinct communities—often, racial and ethnic groups. Variation in racial/ethnic groups’ attitudes toward policies related to issues like those studied here may be shaped in large part by contemporary framing around these issues rather than deep-seated predispositions. It is important to note, though, that we did not find evidence of an association between negativity bias and ideology in the first place, and so this study adds to the recent work challenging how robust the ideology–negativity bias theory is to begin with.
Limitations and future research
One major limitation of this study was the need to resort to online data collection. The recall task is ideally run in person in a controlled setting given the importance of attention and timing, but because of practical constraints, we ran it online using an MTurk sample, which means we had no control over the setting in which participants completed the task. We found a significant negativity bias regarding disgust (of similar effect size to the negativity bias effect found by Mills et al., Reference Mills, Gonzalez, Giuseffi, Sievert, Smith, Hibbing and Dodd2016), and the effects of various control variables were as expected (see the Appendix), which is reassuring. However, online data collection could have created a lot of noise in our data nonetheless because of distractions in the participant’s environment and the tremendous degree of variation in the context in which the study was completed.
Further, we did not find a negativity bias regarding threat, and saw that threat images were rated more positively than disgust. We are not aware of psychology literature that distinguishes between negativity bias regarding disgust versus threat, but the general theory behind negativity bias tends to encompass both threat and disgust (e.g., Baumeister et al., Reference Baumeister, Bratslavsky, Finkenauer and Vohs2001; Rozin & Royzman, Reference Rozin and Royzman2001; Taylor, Reference Taylor1991), and so we should expect a negativity bias effect regardless. Thus, it could be that the threat images simply were not negative enough. With other threat images, we might find different results for our hypotheses involving threat.
Additionally, although some work has shown physiology measures to exhibit low reliability (Osmundsen et al., Reference Osmundsen, Hendry, Laustsen, Smith and Petersen2022), it may be the case that different manifestations of negativity bias are more useful for understanding the relationship between psychological predispositions and political preferences than others. Mustafaj et al. (Reference Mustafaj, Madrigal, Roden and Ploger2022) had similar procedures, measures, and sample size but used physiological EDA measures and found that threat sensitivity significantly predicted anti-immigrant attitudes. Given that we did not find such a relationship (regardless of race/ethnicity), it could be the case that our measure of negativity bias regarding threat was not as useful as a physiological measure would be, at least in this domain.
Finally, although this study was much more deliberate about having and examining racial and ethnic variation than other studies, our sample was still limited in the degree to which race and ethnicity could be thoroughly studied. We had no African American participants, whom we might expect to exhibit the strongest differentiation from White participants. Further, our sample contained a good deal of variation in various factors related to race/ethnicity, such as generation, language, and racial/ethnic identity. We should expect, for example, later-generation or more acculturated Latinx and Asian American individuals to more closely parallel the White majority (e.g., Branton, Reference Branton2007; Wu, Reference Wu2014; Zhou, Reference Zhou2004), and our sample was indeed fairly highly acculturated (M = 5.47, SD = 2.08), which could diminish racial/ethnic differences that we expected. We also did not measure several factors that we should expect to be important such as country of origin, linked fate, racial/ethnic consciousness, and geographic factors. We should expect these factors to matter, and so it may simply be the case that we need to embrace more complexity, either through more complex studies or through more focused investigations of particular groups and specific issue domains so that we can more clearly identify how deep-seated predispositions interact with how individuals are racialized to affect political preferences.
Acknowledgments
We would like to thank the Editor, Gregg Murray, and Guest Editors, Amanda Friesen, Aleks Ksiazkiewicz, and Rose McDermott for extremely helpful comments and recommendations throughout the preregistration and review process. We also want to thank our research assistant, Alex Sanchez, for assistance with recruitment and data collection.
Supplementary Materials
To view supplementary material for this article, please visit http://doi.org/10.1017/pls.2022.19.
Data Availability Statement
This article earned Open Data, Open Materials, and Preregistration badges for open scientific practices. The materials, data, and preregistration that support the findings of this study and the award of these badges are openly available at https://osf.io/hm9sb/.


 Open access