


Introduction
The pursuit of equality in health including access to health care is an overriding goal and principle in Danish health policy (Danish Government, 2013). Whitehead (Reference Whitehead1990: 8) defined equality in health care as: ‘equal access to available care for equal need, equal utilization for equal need, equal quality of care for all’. Social inequality in health is characterised by a systematic relationship between people’s social position in society and their health (Diderichsen et al., Reference Diderichsen, Andersen and Manuel2012). One of the many determinants of social inequalities in health concerns utilisation of health services (Diderichsen et al., Reference Diderichsen, Andersen and Manuel2012). The theme of vulnerability and health care disparities has recently been reviewed by Grabovschi et al. (Reference Grabovschi, Loignon and Fortin2013), who confirmed the direct correlation between an increase of co-existing vulnerability factors and the escalation of health care disparities. They also provided an overview of the many perceptions and definitions of vulnerability.
Based on a synthesis of published literature, Levesque et al. (Reference Levesque, Harris and Russell2013) proposed a conceptual model of access to health care comprising of both characteristics of the users (demand side) and the health care system (supply side). Shengelia et al. (Reference Shengelia, Murray and Adams2003) ventured a slightly different perspective, suggesting seven areas where gaps in health system coverage may occur – resource availability, physical accessibility, affordability, cultural acceptability, provider-related quality, adherence, and strategic choice. Several studies in countries where health care is universal have found that the use of family physician and hospital services is higher in lower socio-economic groups (Veugelers and Yip, Reference Veugelers and Yip2003; Morris et al., Reference Morris, Sutton and Gravelle2005; Stirbu et al., Reference Stirbu, Kunst, Mielck and Mackenbach2011), indicating a greater need resulting from poorer health. The same studies show that specialist services were used comparatively less by lower than higher socio-economic groups, which may potentially widen the social inequality in health. In addition, routine health check-ups appear to be taken up inequitably (Dryden et al., Reference Dryden, Williams, McCowan and Themessl-Huber2012). Furthermore, non-attenders appear to have greater clinical need or risk factors suggesting that a differential uptake may lead to sub-optimal health gain and contribute to inequalities in accordance with the inverse care law (Hart, Reference Hart1971; Dryden et al., Reference Dryden, Williams, McCowan and Themessl-Huber2012).
Furler (Reference Furler2006) also discussed the role of general practice in relation to inequality in health and argued that this resource is an important social determinant of health, which may mitigate or sustain inequities. However, Kelly-Irving et al. (Reference Kelly-Irving, Delpierre, Schieber, Lepage, Rolland, Afrité, Pascal, Cases, Lombrail and Lang2011) found that general practitioners (GPs) tend to overestimate the health of patients with lower educational level, which could potentially result in lack of advice and referral of patients in this group for preventative services. Sørensen et al. (Reference Sørensen, Olsen and Vedsted2009) observed a socio-economic gradient in GPs’ referral pattern to different sorts of specialised health care in Denmark. However, it is not known whether a socio-economic gradient in referral to preventive and rehabilitative health services actually exists.
Distance to health services is another factor that influences access. Grace et al. (Reference Grace, Gravely-Witte, Brual, Suskin, Higginson, Alter and Stewart2008) studied referral and enrolment patterns for cardiac rehabilitation services in Ontario, Canada, and found that physician endorsement and shorter distance were influencing factors. The mean distance to the rehabilitation centre was 16 km for enroled and 27 km for non-enroled patients.
The aim of the present study was to explore whether a Danish prevention centre catered to marginalised groups within its catchment area. The hypothesis was that there was a relative under-representation of participants from socio-economically vulnerable groups, as well as of geographically more distant localities within the catchment area, in terms of referral, attendance to initial appointment and later completion of planned prevention or rehabilitation activities.
Material and methods
The Danish setting
As part of the Health Law that came into effect on 1 January 2007, Danish municipalities have responsibility for providing preventive services to their citizens (§ 119, subsections 1 and 2). These tasks are usually addressed by focussing on reduction of risk factors such as unhealthy diet, smoking, excessive alcohol consumption, and sedentary life-style (Danish Health Authority, 2008), so as to prevent development of cardiovascular diseases (CVD), type 2 diabetes (T2D), chronic obstructive pulmonary disease (COPD), and cancer. More than two-thirds of the 98 municipalities have chosen to establish prevention centres or community health centres (Deleuran, Reference Deleuran2012) where various programmes are offered, either to persons who already have a particular disease or those who are at risk of developing it.
Study area and population
The study was conducted in collaboration with the Prevention Centre Vanløse-Brønshøj-Husum in Copenhagen, Denmark. At the time of the study, the population in the centre’s catchment area consisted of 56 694 inhabitants aged 18 years or older. In addition to the prevention centre, primary health care sources in the area consisted of 34 GP clinics. The municipality and the centre were purposely selected based on previous collaborative ties and the heterogeneity of the catchment area. The study included all citizens referred to the prevention centre during the period 17 December 2012 to 1 October 2013, who were then followed until 1 April 2014. The only inclusion criterion was permanent residence in the prevention centre’s catchment area. The prevention centre is positioned in the most southern part of the catchment area, about four kilometres from the most northern part and with no direct public transportation option for citizens residing in this part, a decision that has been subject to local debate.
The prevention centre
The prevention centre opened in April 2011 and has gradually expanded from six to 15 staff members including physiotherapists, nurses, dieticians, and occupational therapists. The centre provides primary prevention and rehabilitation services to adult citizens (⩾18 years of age) in the catchment area. Primary prevention includes life-style counselling based on motivational interviewing (Miller and Rollnick, Reference Miller and Rollnick2002) in relation to diet, smoking, alcohol, and exercise, and dialogue-based health activities targeting citizens with ethnic minority backgrounds. Secondary prevention for citizens with diagnosed risk factors (hypercholesterolaemia, hypertension, and prediabetes) consists of life-style counselling and a 12-week supervised exercise programme. Rehabilitation for citizens diagnosed with CVD, T2D, COPD, or cancer includes the above listed programmes as well as disease-specific patient education and cooking classes. Average length of the prevention programmes is three to four months. Participation in secondary prevention and rehabilitation require referral from GPs, hospitals, or municipal job centres. Citizens participating in primary prevention may be self-referred, or are sent in by their GP, municipal job centre, or other local agent (such as social housing workers). Citizens referred were supposed to attend an initial ‘health talk’ and subsequently in the agreed upon planned activities. Any participation in a given programme was voluntary.
Data sources
The prevention centre provided a list of 347 persons referred to the centre with information on age (in 10-year groups), address, type of referral, and whether the person had attended the first, second, or later appointment, and whether the planned activities were completed according to the plans made at the initial appointment for each of the persons.
Four different types of referral occurred: GPs, hospitals, job centres, and self-referral. Access was examined as attendance in an initial appointment and utilisation as completion of planned activities.
The prevention centre’s catchment area is divided into 44 geographically demarcated statistical districts. For each district, the degree of ‘socio-economic vulnerability’ has been estimated based on educational level, ethnicity, income, and unemployment rate. A socio-economic vulnerability score (SE-score) aggregating these four variables was calculated. A higher score indicates a higher socio-economic vulnerability and a lower socio-economic status. The highest possible SE-score was 20 and the lowest possible score was 5. The catchment area of the preventive centre included one district with an SE-score of 5 and several districts with SE-scores of 20, indicating that the entire socio-economic spectrum was represented among the 44 districts in the data set. The statistical office of Copenhagen provided the SE-scores and the population distribution by sex and age (one-year classes) for each of the districts. For each participant the statistical district in which he or she lived was determined by geocoding (giving each address a location on a digital map) their addresses in a Geographic Information System (ArcGIS 10.2) and identifying the statistical district within which it fell. For all statistical districts the Euclidian (as the bird flies) distance from the centroid of the district to the prevention centre was calculated. The shortest distance from a district to the prevention centre was 0.165 km and the longest distance was 3.769 km.
Referral
We created a data set classified by district, age, and sex. Population size was obtained from the statistical office of the City of Copenhagen; distance and SE-score was assigned at district level. Each referral was assigned to one unit of this data set. We then used the number of referred participants and total number of citizen as outcome variable in a logistic regression to describe the probability that a person was referred to the centre, depending on sex, age, SE-score, and distance to the centre (from the district of residence). Analyses were also done separately for each type of referral.
Attendance according to appointment
The 347 participants were classified as attending at initial appointment (A1); attending at a later appointment (A2); and never attending (N). In the data set of 347 referred participants, we analysed the probability of following events by logistic regression:
-
(a) Attendance (A1+A2 versus N)
-
(b) Attendance at initial appointment (A1 versus A2+N)
-
(c) Attendance at initial appointment given attendance (A1 versus A2).
Programme completion
The subset of participants actually attending could either complete activities according to plans (CA) or not (NCA). We used logistic regression to analyse the probability of completing according to plans:
-
(d) The probability of completion according to plans (CA versus NCA).
Research ethics
The study was registered at the Danish Data Registration Authority. Furthermore, the legal department of the participating municipality approved the use of secondary data for research purposes. Anonymity was ascertained and the project did not have any adverse effect on the study population.
Results
Socio-demographic profile of study participants
A total of 347 participants were referred to the prevention centre during the study period (Table 1). There were fewer males (45%) than females (55%). Participants were referred by one of four sources: GPs (66%), hospital (15%), job centre (7%), and self-referral (11%).
Table 1 Characteristics of the study population (n=347)

a Source of referral is unknown for five citizens.
The number of participants reaching the various steps in the sequence of events is shown in Figure 1. A total of 36% (112/311) of the participants who came for the initial appointment did not complete the planned activities.
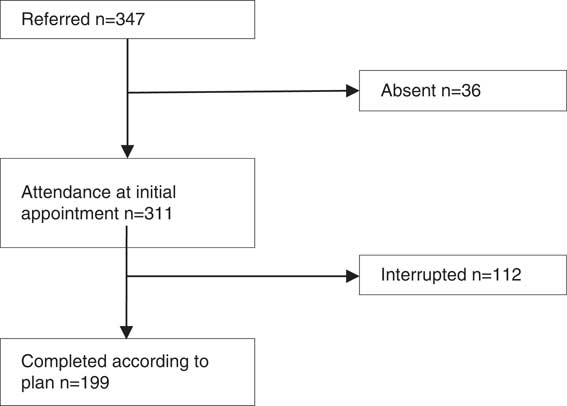
Figure 1 Flow chart of sequence of events for study participants illustrating attendance at initial appointment and completion according to plans
Referrals
Participants from locations with a high SE-score (indicating high socio-economic vulnerability) had higher probability of being referred (Table 2). Thus, an increase of five points in the SE-score augmented the probability of referral by 40% (Table 3). Furthermore, participants who resided farther from the prevention centre had lower probability of being referred.
Table 2 Analysis of sequence of events

SE-score=socio-economic vulnerability score; A1=Attending at initial appointment; A2=attending at a later appointment; N=never attending; CA=completed according to plans; NCA=not completed according to plans.
Probability of (1) referral, (2) attendance (A1+A2 versus N), (3) attendance at initial appointment (A1 versus A2+N), (4) attendance at initial appointment given attendance (A1 versus A2) and (5) subsequent completion according to plans (CA versus NCA) as a function of SE-score and distance.
a In the analysis of referrals, the sector’s distance to centre was used. For analysis of subsequent sequence of events, the distance of the individuals’ address to centre was used.
Table 3 Probability of referral as a function of SE-score

SE-score=socio-economic vulnerability score; OR=odds ratios.
Referred=347, n=58 694⩾18 years.
The model is adjusted for sex, age, and distance to the centre.
Additional data on types of referral (Figure 2) showed that the referral dependence on SE-scores were stronger for GPs (odds ratios (OR)=1.4 per 5), hospitals (OR=1.5 per 5), and job centres (OR=2.3 per 5), compared with self-referral (OR=0.9 per 5). Participants residing longer distances from the centre had lower probability of being referred by general practitioner (OR=0.75 for each km further away), whereas those referred from hospitals or job centres, or self-referred showed no significant relation to the distance from the centre. Women had an almost threefold higher probability of self-referral (OR=2.8), whereas those referred from GPs, hospitals, or job centres had no significant relation to sex.
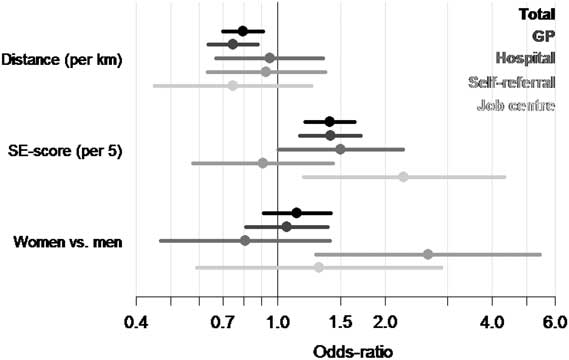
Figure 2 Estimated effects of distance, socio-economic vulnerability score (SE-score) and sex for the four types of referral. The estimated effects can only be compared within and not between the explanatory variables
Attendance and completion
After referral, there was no difference in probability of attendance to initial appointment or subsequent completion according to plans as a function of SE-score or distance between the participants’ district and the centre (see Table 2).
Discussion
The aim of the present study was to explore the extent to which socio-economic factors and distance influenced access to health services at a Danish municipal prevention centre, assessed in terms of probability of referral, attendance to an initial ‘health talk’, and subsequent completion of planned activities. The study contributes to the limited number of studies of disparities in access to preventative and rehabilitation health services for CVD, T2D, COPD, and cancer, which is one aspect of health inequality. Data showed that citizens from locations with a high SE-score (i.e., high socio-economic vulnerability) had increased probability of being referred by GPs, hospitals, and job centres. People with low socio-economic status are more likely to have chronic diseases and thus be more in need of the centre’s services. The results of this study indicate that the centre is capable of attracting referrals of citizens from areas where the need is likely to be relatively high. However, the study does not provide an insight into the targets populations’ actual need of the centre’s services. Thus, it is possible that some citizens who should have been referred from the districts with high SE-scores had not been offered this service.
Women were three times more likely to refer themselves than men, which corresponds with the findings of Hoebel et al. (Reference Hoebel, Starker, Jordan, Richter and Lampert2014). Citizens living further away from the prevention centre had a reduced probability of being referred by their GPs, which may reflect a variant of the ‘physical accessibility gap’ (Shengelia et al., Reference Shengelia, Murray and Adams2003: 225) in the sense that it is a procedural rather than a physical obstacle to access, or in the terminology of Levesque et al. (Reference Levesque, Harris and Russell2013: 5) an issue of ‘approachability’. This variable was examined, as the prevention centre is situated in the most southern part of the catchment area, about 4 km from the most northern parts of the area. It may appear unlikely that a few kilometres may make a significant difference within an urban setting where there is good public transport. However, according to the municipal professionals providing services to vulnerable groups within the area, many citizens’ activities of daily living are limited to small geographic areas. A recent study showed that within a distance of <1 km in Copenhagen, life expectancy varies between 80.2 and 73.3 years (Diderichsen et al., Reference Diderichsen, Brønnum-Hansen and Schnohr2014). Thus, as argued by Marmot (Reference Marmot2004: 3), even in Scandinavia, which is believed to be egalitarian, there are huge social-class differences and ‘healthy and unhealthy live side by side’. The present study did not systematically explore whether the referral patterns reflected the distances from the GPs’ clinics themselves to the prevention centre. Interestingly, the referral patterns may reflect what Melnyk (Reference Melnyk1990: 112) calls an ‘intrinsic or subjectively based’ (i.e., mental) barrier to care – not among the users, but among the GPs.
After referral there were no differences in probability of attending the initial appointment and subsequent completion of planned activities as a function of SE-score or distance. This is an important and somewhat counterintuitive finding, as it could have been assumed that socio-economic vulnerability (as indicated by high location SE-score) and a relatively long distance to the centre would be associated with lower attendance and completion. Only 64% of the citizens attending the initial appointment subsequently completed the planned activities, an issue which according to Shengelia et al. (Reference Shengelia, Murray and Adams2003) would be categorised as an adherence gap. Some studies have explored reasons for dropout such as low job flexibility and lack of coordination with other treatments (Groeneveld et al., Reference Groeneveld, Proper, van der Beek, Hildebrandt and van Mechelen2009; Kure-Biegel et al., Reference Kure-Biegel, Schnohr, Hindhede and Diderichsen2016). In contrast to many other countries, in a Danish context where health care services are generally provided free of charge, the affordability gap is not relevant (Shengelia et al., 2003).
Danish municipalities already have access to various data sources with regard to distribution of diseases and risk profiles. Every four years, ‘health profiles’ are constructed nationally (Christensen et al., Reference Christensen, Davidsen, Ekholm, Pedersen and Juel2014) providing information on socio-demographic characteristics, health-related quality of life, health behaviour, morbidity, consequences of illness, and social relations. The municipalities may use these data to guide provision of health services for their target populations. To guarantee respondent anonymity and a sufficient number of participants, health profile data are aggregated in relatively large geographic areas. This means that local health and socio-demographic disparities may be hidden within average figures, especially in heterogeneous areas (Bak et al., Reference Bak, Dreier and Andersen2011). For example, the catchment area of the prevention centre in this study consists of two areas within the national health profile study, whereas it consists of 44 statistical districts within the municipal administrative system.
On a practical level, the results enable the prevention centre to monitor and adjust its recruitment strategies in order to increase GPs’ referral of citizens from distant locations within the catchment area. Moreover, the study documents that there is potential to increase the completion rate and thereby improve the effectiveness of the health services being offered.
The study has limitations. It would have been a stronger design if individual socio-demographical background data on all the participants were included. However, this would have entailed a much larger study design, which would be unrealistic for municipalities to conduct independently under real-life circumstances. Instead, the study was based on the assumption that a citizen living in a given statistical district is likely to share some of the district’s socio-demographic characteristics as indicated by the SE-score. The study could also have benefitted from having data on the actual need for health care services on all inhabitants living in each of the statistical districts. This would have enabled a more precise assessment of vulnerability as it would have made it possible to assess the degree to which the prevention centre programme reached the people most in need. The study did not distinguish between citizens referred for prevention or rehabilitation, which is a limitation because these populations potentially have different drivers for service use and the influence of socio-economic factors may also be different among these groups. However, it would also have entailed a larger study to include this in the analysis. The 44 districts are heterogeneous not only according to variables of direct relevance to health inequality, but also to other variables. For instance, the age composition is likely to vary between the locations, and this would have a bearing on need for the prevention centre’s services. Moreover, apart from the services provided at the prevention centre, there may have been other agencies (such as NGOs) that covered the needs of the populations in some parts of the catchment area.
Notwithstanding these limitations, the study provides important theoretical and practical insights. Theoretically, the study contributes to the field of inequality in health in general and access to health care services in particular. It shows how the many determinants for access to prevention and rehabilitation services are influenced by local contextual factors including referral patterns and distance. The results give the prevention centre concrete grounds to discuss referral practices and outreach activities with the GPs. Furthermore, the study was designed in such a way that available municipal data were utilised, thereby demonstrating that prevention centres can in principle conduct such an analysis themselves in order to monitor their services.
Conclusion
The findings indicate that citizens from locations with high SE-score (i.e., high socio-economic vulnerability) had increased probability of being referred by GPs, hospitals, and job centres. In contrast, distance influenced the probability of citizens being referred by GPs. After referral neither SE-score nor distance influenced the probability of attendance and completion of activities.
It has been shown how conceptual frameworks for the analysis of access take special meanings within local contexts. For instance, in highlighting the importance for referrals, even physically small distances within a public health care system can be significant, even if affordability is not an issue. The study demonstrates how existing municipal data may be used to assess on-going programme activities, improve access, and thereby reduce potential inequalities in health care. The fact that Copenhagen had a detailed database on the districts’ socio-economic variables provided a unique opportunity for conducting the present study. It also constituted a resource base for the municipality to monitor and plan municipal services.
A number of areas for further research have been highlighted by this study. This includes investigations of: (a) how attendance and completion varies according to the categories of preventive care and rehabilitation, (b) the reasons why citizens do not complete the activities, and (c) the rationale for the GPs’ referral patterns.
Acknowledgements
The authors are thankful to the staff of the Prevention Centre Vanløse-Brønshøj-Husum as well as other key persons within the municipality who were very helpful in providing the relevant data. Also many thanks to Lærke Mygind and Katrine Lund Kragbak for data management. The authors acknowledge the significant and extensive contribution provided by Bendix Carstensen on the statistical analysis. Health Promotion Research, Steno Diabetes Center is funded by the Novo Nordisk Foundation and Novo Nordisk A/S.


