


The worldwide prevalence of obesity is on the rise with more than one billion people reported to be obese in 2022. Obesity is defined as excessive body fat accumulation and in the UK, an estimated 26 % of adults are classified as obese compared with 13 % globally(1,2) . Obesity has been extensively linked with non-communicable diseases such as CVD, some types of cancers, metabolic syndrome and type 2 diabetes. Amongst these diseases, an estimated 18·6 million people died from CVD in 2019 and if this trend continues it is expected to be responsible for over 23 million deaths by 2030, partly due to increasing obesity rates(Reference Roth, Mensah and Johnson3,Reference Smith, Collins and Ferrari4) . CVD is multifactorial in nature, with diet recognised as one of the most important modifiable risk factors in relation to obesity and CVD and a cornerstone of public health recommendations for the prevention of these chronic diseases. Interestingly, the type but not the amount of dietary fat intake has emerged as an important determinant in relation to CVD risk markers and body fat accumulation(Reference Summers, Fielding and Bradshaw5,Reference Neville, Geppert and Min6) .
The Scientific Advisory Committee on Nutrition (SACN) report on SFA and health recommends the population average intake of SFA should be no more than 10 % of total energy (TE) for CVD prevention(7). This target is reported in the UK Eatwell guide in grams as less than 30 grams of daily SFA intake for the average man and less than 20 g for the average woman(8). Despite these recommendations to limit SFA, it still remains a significant source of energy in the UK diet of around 12·3 % of TE (25·3 g/d)(9). Reducing dietary SFA intake has been a key public health strategy in the UK, but the replacement macronutrient also plays an important role in determining CVD risk. Studies have reported more beneficial effects on CVD risk markers after replacement of SFA with unsaturated fatty acids (UFA) than carbohydrates (CHO) or protein(Reference Vasilopoulou, Markey and Kliem10,Reference Vafeiadou, Weech and Altowaijri11) . Although evidence to conclude beneficial effects of substituting SFA with MUFA on hard clinical outcomes is limited, replacement of SFA with PUFA has been shown to be associated with lower risk of CVD events and SFA replacement with MUFA and PUFA to have favourable effects on CVD risk markers such as fasting total cholesterol (TC) and LDL-cholesterol concentrations. Studies have also reported that greater total body fat percentage is positively associated with CVD-related fasting lipid markers(Reference Sun, Zhang and Liu12). However, very little is known about the impact of replacing dietary SFA with UFA on body composition. As a result, there is now considerable interest in whether dietary fat composition has an impact on cardiovascular health via effects on the body fat distribution.
There is increasing recognition that not all obese people diagnosed with, or at a greater risk of developing cardiometabolic diseases, progress to CVD. This suggests that obesity per se is not always a marker for metabolic dysfunction(Reference Hamer and Stamatakis13). In agreement with this, clinical observations have reported a healthy metabolic profile in both lean and obese subjects to be related to the location of body fat storage(Reference Mathew, Farr and Mantzoros14). Therefore, it has become clear that body fat distribution may represent a better indicator of metabolic abnormalities than total adiposity(Reference Machann, Horstmann and Born15,Reference Piché, Vasan and Hodson16) . Adipose tissue consists of white, brown and beige adipose tissue(Reference Chait and den Hartigh17). Main total fat stores in humans are shown to be white adipose tissue which has two different metabolically characteristic compartments, subcutaneous adipose tissue (SAT) and visceral adipose tissue (VAT). SAT represents a major component of body fat and is located under the skin whereas VAT can be defined as the accumulation of adipose tissue around or within organs such as omental (intestines and organs in the lower abdomen), mesenteric (intestines and bowel), epicardial (heart) and mediastinal (thoracic cavity) regions(Reference Kwok, Lam and Xu18). Importantly, there are anatomical, cellular and molecular differences between SAT and VAT. In terms of cellular differences, VAT contain larger adipocytes which are dysfunctional, insulin resistant, hyperlipolytic and not subject to the anti-lipolytic effect of insulin compared to SAT which contains small adipocytes(Reference Ibrahim19). Studies have reported that gynoid fat accumulation is mostly subcutaneous and associated with favourable cardiometabolic profile(Reference Vasan, Osmond and Canoy20). On the other hand, abdominal fat accumulation includes a greater VAT mass which is associated with higher TC, LDL-cholesterol and TAG, insulin resistance and inflammatory markers(Reference Mittal21,Reference Hardy, Czech and Corvera22) .
Genetic heterogeneity can contribute between 40 and 75 % of the inter-individual variation in BMI(Reference Reddon, Patel and Turcotte23), towards phenotype diversity and predisposition to adiposity. Using GWAS more than 1000 specific independent loci were found to be associated with obesity, with SNP within fat mass and obesity-associated (FTO), melanocortin 4 receptor (MC4R) and leptin receptor (LEPR) genes being the most commonly identified(Reference Loos and Yeo24). APOLIPOPROTEIN (APO)E, a gene essential for lipid metabolism, is associated with CVD risk and dietary fat intake plays a role in this relationship, with APOE4 allele carriers (∼ 25 % of population) showing a greater responsiveness of the fasting lipid profile to dietary fat intake and composition. However, this is not always a consistent finding in the literature, with differences in the metabolic phenotype and BMI of the study participants thought to play a role in the relationship with CVD risk. Studies in animals have suggested the APOE gene to play a role in obesity, with one study reporting differences in body fat distribution and weight gain between APOE3 and APOE4 mice in response to high-fat feeding. Therefore, it is possible that the role of APOE genotype on CVD risk may be driven by changes in body composition and adiposity.
In this review, the relationship between body composition and CVD is presented, the first part focusing on the role of dietary fat intake and the second on the impact of the APOE genotype on this relationship.
Association between dietary fat intake and body composition
Although higher dietary fat intake was initially reported to be associated with adiposity, obesity rates have continued to increase despite decreasing fat intakes(Reference Melanson, Astrup and Donahoo25). Therefore, the quality of dietary fat has gained importance, but studies investigating the role on body fat content and distribution are limited. This was echoed in the review of Melanson et al. (Reference Melanson, Astrup and Donahoo25) published in 2009 which proposed that dietary SFA had negative effects on body weight but that more research was needed. Replacing dietary SFA with UFA has been shown in some studies to have a positive effect on body composition and abdominal VAT mass without impacting on weight loss(Reference Summers, Fielding and Bradshaw5,Reference Piers, Walker and Stoney26) . Studies examining the effect of dietary fat on adiposity and body fat distribution are presented in Table 1.
Table 1. Summary of the studies investigating the association of SFA intake with body composition and the effect of replacing SFA intake on body composition

CS, cross-sectional; M, male; BF, body fat; TF, trunk fat; (+), positive association; W, weight; WC, waist circumference; HC, hip circumference; SFT, skin fold thickness; F, female; BIA, bioelectrical impedance analysis; DXA, dual x ray absorptiometry; AL, android lean; R, randomised; CO, cross-over study; MRI, magnetic resistance imaging; VF, visceral fat; SAT, subcutaneous adipose tissue; HCL, hypercholesteraemic; OW, overweight; OB, obese; PAL, parallel; ↓: reduced, ↑: increased.
Findings from a cross-sectional study conducted in 128 men (mean BMI of 28 kg/m2) from the Quebec Family study concluded that dietary MUFA was positively associated with trunk skinfold thickness and waist circumference (WC), SFA intake with body fat mass, whereas PUFA showed no relationship with the adiposity markers (WC and body fat mass)(Reference Doucet, Alméras and White27). Later, in a cross-over study performed by Summers et al. (Reference Summers, Fielding and Bradshaw5), substituting SFA with a combination of n-3 and n-6 PUFA decreased abdominal fat accumulation specifically subcutaneous fat in female subjects without diabetes, whilst there was no difference in the waist:hip ratio and body fat percentage. However, findings from this study need to be interpreted with caution due to the small sample sizes within each of the subgroups (n 6 with type 2 diabetes, n 6 non-obese and n 5 obese individuals). Similarly, in a parallel study conducted in 61 abdominally obese healthy and type 2 diabetic subjects, liver fat content was found to be lower following a n-6 PUFA diet for 10 weeks compared with a SFA diet(Reference Bjermo, Iggman and Kullberg28). During a 16 week RCT, 75 participants with a BMI of 28–40 kg/m2 followed either a control diet (their habitual diet) or a low-fat vegan diet which was high in PUFA and low in SFA and trans-fat. The results suggested that a decrease in SFA intake during the vegan diet was associated with reduced fat mass. However, this finding was not significant after adjustment for BMI indicating that the level of adiposity of the participants at study entry was an important determinant of the response to dietary fat intake(Reference Kahleova, Hlozkova and Fleeman29). In the BODYCON cross-sectional study, the relationship between dietary SFA intake and body composition and fat distribution was investigated using dual energy X-ray absorptiometry (DXA). Although anthropometric measurements BMI, WC, hip circumference (HC) and waist:hip ratio across quartiles of increasing SFA intake were similar, android lean mass (but not fat mass) was higher in participants consuming 12·0–14·8 %TE SFA (Quartile 3) compared with those meeting the recommendation of ≤ 10·0 % TE SFA (Quartile 1). However, in a cross-sectional study conducted by Neville et al. (Reference Neville, Geppert and Min6), a higher dietary SFA intake in women aged 20–50 years was associated with having a higher total body fat percentage and trunk fat mass. In this study body composition was measured using bioelectrical impedance analysis (BIA) which is more prone to bias compared to DXA, computed tomography or MRI scans(Reference Neville, Geppert and Min6). Differences in the study cohorts might also explain this findings as the BODYON study group had a higher than average physical activity level. It should also be noted that the food sources of SFA consumed by populations in these studies could also have an impact on the results.
In an RCT substituting dietary SFA (24 %TE SFA, 13 %TE MUFA and 3 %TE PUFA) with MUFA (11 %TE SFA, 22 %TE MUFA and 7 %TE PUFA), using two isoenergetic diets for 4 weeks, a reduction in fat mass in 8 overweight or obese male subjects was reported. The authors stressed that on the SFA diet participants gained fat around the abdominal area, whereas during the MUFA diet, the fat loss was similar from the trunk and limbs. However, differences in physical activity levels and food intake between diets together with a small sample size may have influenced the findings in these free-living subjects(Reference Piers, Walker and Stoney26). In the parallel PREDIMED study conducted in participants with a mean BMI of 29·5 kg/m2 and high CVD risk, a 5 % reduction in WC was observed after 1 year in the group assigned to the MedDiet with nuts compared to baseline without a significant change in body weight(Reference Damasceno, Sala-Vila and Cofán30). However, differences in WC were not found in either the MedDiet with EVOO or the low-fat control diet groups which indicates that increased n-6 PUFA compared to MUFA might be more beneficial for abdominal obesity. In agreement with this, in the LIPOGAIN parallel RCT performed in thirty-nine free living subjects, higher visceral adiposity and liver fat was found after eating muffins high in SFA for 7 weeks, whereas muffins rich in PUFA increased lean tissue mass suggesting that dietary fat quality may influence liver fat accumulation, fat distribution and body composition(Reference Rosqvist, Iggman and Kullberg31). In another RCT study, reductions in abdominal obesity was evident after 4 weeks of following a CanolaOleic diet (6·5 % TE from SFA, 19·3 % TE from MUFA and 6·9 % TE from PUFA) compared with flax/safflower diet (6·8 % TE from SFA, 9·6 % TE from MUFA and 16·3 % TE from PUFA) but not canola, canola DHA or corn/safflower diets in men with central adiposity(Reference Liu, Kris-Etherton and West32). Raatz et al. (Reference Raatz, Conrad and Johnson33) argued in their study that SFA intake was positively associated with BMI; however, this observation needs to be interpreted with caution as food intake was self-reported and BMI has limitations as a marker of adiposity. The isoenergetic replacement of a high SFA diet (47 % CHO, 38 % fat- 20 % SFA, 12 % MUFA and 6 % PUFA) by a MedDiet (47 % CHO, 38 % fat-< 10 % SFA, 22 % MUFA and 6 % PUFA) or CHO diet (57 % CHO, 28 % fat-< 10 % SFA, 12 % MUFA and 6 % PUFA) had a positive effect on total body fat in 34 hypercholesterolemic male subjects with a mean BMI of 28·2 kg/m2 in a cross-over study(Reference Fernández de la Puebla, Fuentes and Pérez-Martinez34). However, the type of carbohydrate they consumed in the diets was not clear, therefore findings should be interpreted with caution.
DiNicolantonio and O’Keefe(Reference DiNicolantonio and O’Keefe35) speculated on the potential mechanisms on how dietary fatty acids influence body composition in their review paper. As long-chain SFA have a lower oxidation rate than MUFA and long chain PUFA, they tend to stay in the liver longer, whereas UFA are more likely to be packaged into very low density lipoprotein (VLDL) and exported from liver. This may explain the reason behind the line of thinking that SFA increase abdominal obesity more than UFA. Moreover, it has also been claimed that n-6 PUFA may cause more fat accumulation than n-3 PUFA by inhibiting the positive effects of n-3 PUFA on obesity such as increasing fatty acid oxidation and prevention of adipocyte proliferation(Reference DiNicolantonio and O’Keefe35,Reference Simopoulos and DiNicolantonio36) . It should be noted that observed inconsistencies in the literature may arise from different methodologies used to determine body fat distribution in these studies (e.g. anthropometric measures, BIA, DXA, computed tomography and MRI), sample size and different dietary approaches (e.g. supplementation, replacement, and self-reported intakes). Moreover, other behavioural and lifestyle factors in addition to diet such as sedentary lifestyle as well as non-modifiable risk factors such as the effects of genetic make-up may influence the relationship between body composition and CVD.
Association between the APOE gene and Body Composition
ApoE is a 34-kDa arginine rich protein consisting of 299 amino acids and encoded by the APOE gene. There are three major allelic variants of the APOE gene; ε2, ε3, ε4, caused by a single base substitution of the two nucleotides (SNP) at position 112 (rs429358) and at position 158 (rs7412) resulting in the substitution of arginine or cysteine amino acids in the apoE protein(Reference Seripa, D’Onofrio and Panza37). These three alleles give rise to six possible APOE genotypes, APOE2/2, E2/4, E4/4, E2/3, E3/4 and E3/3 (Reference Singh, Singh and Mastana38). Approximately 58·2 % of population are APOE3/E3 which is referred to as the wild-type, 26·3 % carry one copy of the E4 allele (E3/E4 and E4/E4), while E2 carriers (E2/E2 and E2/E3) account for only 15 % in the UK(Reference Lumsden, Mulugeta and Zhou39).
Several animal studies investigating the effect of diet on body weight and composition in APOE +/+ and APOE −/− mice concluded that APOE plays a role in obesity(Reference Chiba, Nakazawa and Yui40,Reference Hofmann, Perez-Tilve and Greer41) and that APOE deficiency is protective against obesity via suppression of fat accumulation in the liver and fat tissues(Reference Gao, Katagiri and Ishigaki42)). In a study by Huebbe et al. (Reference Huebbe, Dose and Schloesser43), APOE4 and APOE3 female mice were fed with low and high-fat diets (5% from soya and 21·2 % from milk respectively) for 10 months, with female APOE3 mice having a significantly higher body weight during both diets compared to female APOE4 mice. Arbones-Mainar et al. (Reference Arbones-Mainar, Johnson and Altenburg44) showed that male APOE4 mice had less body weight gain and VAT fat compared to APOE3 mice on a high fat western-type diet (21% fat from milk), while SAT accumulation was the same for both genotypes. Although findings from animal studies appear to support an association between APOE genotype and obesity, there is currently no clear consensus on which genotype group is more obesogenic. This may be due to the difficulty in comparing studies due to the sex or age of mice, diet composition/length and so these findings should be interpreted carefully.
The role of APOE genotype in obesity has been investigated in only a small number of human studies, but findings have generally been inconsistent (Table 2). An association between APOE2 with both BMI and WC was found in 208 Croatian subjects(Reference Zeljko, Škarić-Jurić and Narančić45) and with BMI in 4660 subjects from the Aragon Workers Health Study in Spain(Reference Tejedor, Garcia-Sobreviela and Ledesma46) and 94 healthy and 112 diabetic women in Turkey(Reference Duman, Oztürk and Yilmazer47). A greater waist:hip ratio was observed in APOE2 carriers compared to APOE4 carriers but only in early postmenopausal Slovak women (n 129/427)(Reference Luptákova, Siváková and Cvíčelová48). Moreover, the APOE4 allele was associated with lower BMI, especially in older Caucasian individuals, while the APOE2 allele was related to a higher BMI in a pooled analysis of seven longitudinal cohort studies(Reference Kulminski, Loika and Culminskaya49). Although the studies above suggest that the APOE2 allele is associated with adiposity, in contrast some others reported the APOE4 allele to be related with obesity markers. For example, in the Atherosclerosis Risk in Communities (ARIC) study, the APOE4 allele was linked to a greater BMI while the lowest was associated with APOE2 allele(Reference Volcik, Barkley and Hutchinson50). Similarly, in a case–control study which included 198 normal weight healthy and 198 obese Saudi university students, the APOE4 allele was positively associated with BMI in only overweight and obese subjects (BMI > 25 kg/m2)(Reference Alharbi, Syed and Alharbi51). In 164 non-diabetic first-degree relatives of people with diabetes and 962 non-diabetic people with no family history of diabetes, WC was significantly greater in older women with a family history of diabetes who were APOE4 carriers compared to APOE2 carrier and APOE3/E3 groups(Reference Oh and Barrett-Connor52). Similarly, the APOE4 allele was found to be positively associated with WC in 155 non-diabetic and 156 diabetic Iranian subjects(Reference Zarkesh, Daneshpour and Faam53). However, APOE and adiposity (BMI ≥ 25 kg/m2) was not found to be associated in an Iranian population in a cross-sectional study that included 345 men and 498 women(Reference Zarkesh, Daneshpour and Faam53). To summarise, while some findings indicate that APOE2 allele is associated with adiposity markers, the others suggest that being an APOE4 allele carrier is linked with obesity. This inconsistency could be due to differences in the study populations. Moreover, these studies are cross-sectional therefore they do not suggest causation.
Table 2. Summary of the studies investigating the role of APOE genotype and obesity
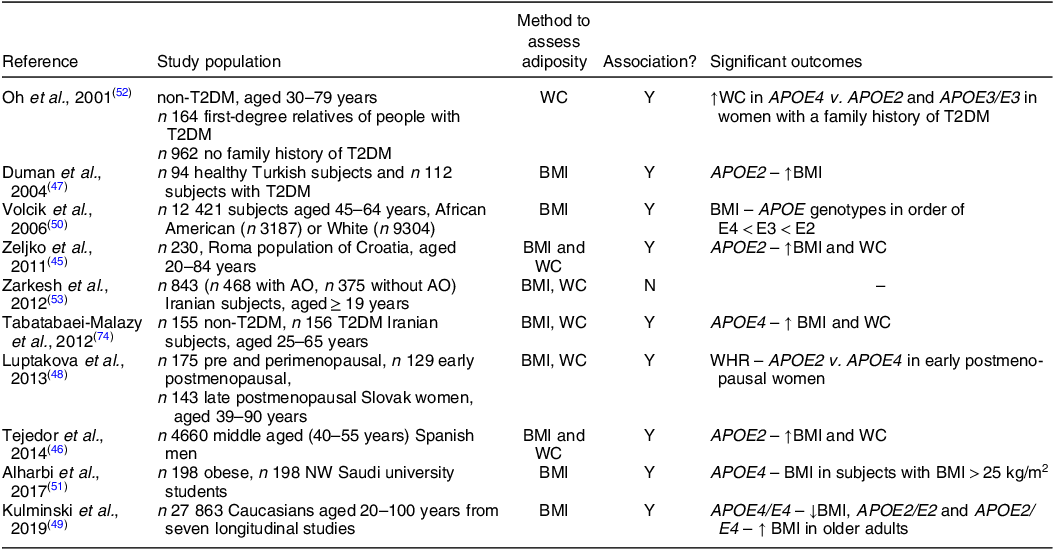
T2DM, type 2 diabetes; Y, yes; ↑, higher; WC, waist circumference; N, no; AO, abdominal obesity; NW, normal weight; ↓, lower.
Role of BMI in the relationship between APOE and CVD risk biomarkers
Higher concentrations of fasting lipid CVD risk markers TC and LDL-cholesterol in APOE4 compared to APOE2 carriers have been reported in many studies(Reference Rathnayake, Weech and Jackson54–Reference Griffin, Walker and Jebb57). This has been explained by the variance in the LDL-R binding activity of isoforms (with apoE4 having the greatest and apoE2 having the least affinity(Reference Hatters, Peters-Libeu and Weisgraber58)) and differences in rates of conversion of VLDL to LDL, cholesterol absorption and bile acid synthesis between genotype groups(Reference Huang, Liu and Rall59–Reference Minihane, Jofre-Monseny and Olano-Martin63).
In view of the impact of APOE genotype on CVD risk markers, a few studies have determined the role of BMI on this relationship and summary of these studies are presented in Table 3. Petkeviciene et al. (Reference Petkeviciene, Smalinskiene and Luksiene64) reported a lack of an interaction between APOE2 or APOE4 with BMI on circulating TC and LDL-cholesterol concentrations in 996 Lithuanian adults. However, a study conducted in 312 UK adults reported a lower TAG concentration in APOE2 carriers but only in subjects with a normal BMI and not in the overweight or obese sub-groups(Reference Kofler, Miles and Curtis65). Similarly, using data from the cross-sectional BODYCON study (n 360/409), novel interactions between APOE genotype and BMI on body fat distribution were evident. APOE4 carriers had higher lean and android lean mass compared to APOE3/E3 group only in the normal weight sub-group. Furthermore, differences in fasting lipid concentrations between the APOE2/E3 and other genotype groups were also only found within the normal weight, but not overweight or obese participants, with diet and sex important factors in this relationship(Reference Ozen, Mihaylova and Lord66). In contrast, in 454 Chinese subjects, lower TAG concentrations were observed in APOE3 and APOE4 carriers compared to APOE2 carriers in normal weight subjects(Reference Zhang, Xuemei and Fan67).
Table 3. Role of adiposity in the relationship between APOE genotype and CVD risk markers
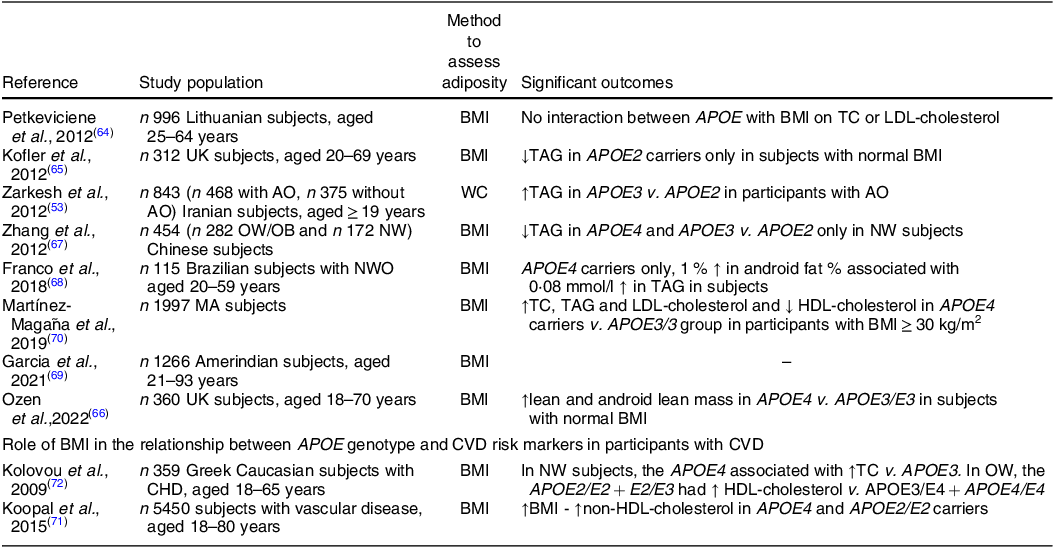
↑, higher; WC, waist circumference; T2DM, type 2 diabetes; AO, abdominal obesity; NW, normal weight; TC, total cholesterol; LDL-C, LDL-cholesterol; ↓, lower; OW, overweight; OB, obese; NWO, normal weight obesity; ↑, increase; MA, Mexican Amerindian.
In contrast to the findings above, some studies reported an APOE x BMI interaction on CVD risk markers only in subjects with higher adiposity. For example, in APOE4 carriers only, each 1 % increase in android fat percentage was associated with 0·08 mmol/l increase in TAG concentration in Brazilian adults with a normal BMI but higher body fat percentage(Reference Franco, Gonçalves Zardini Silveira and Sobral de Assis Vasconcelos Lima68). Another study in Iranian participants found that the APOE3/E3 genotype was associated with higher TAG concentrations in subjects only with higher WC(Reference Zarkesh, Daneshpour and Faam53). Similarly, in an Amerindian population in the Bolivian tropics, there was a tendency for APOE4 carriers to have lower TC and LDL-cholesterol concentrations at higher BMIs compared to APOE3/E3 group(Reference Garcia, Finch and Gatz69). Moreover, higher TC, TAG and LDL-cholesterol concentrations in APOE4 carriers compared to APOE3/3 group were only observed in a Mexican Amerindian sub-group with BMI ≥ 30 kg/m2 while there were no differences between genotypes in normal weight and overweight participants(Reference Martínez-Magaña, Genis-Mendoza and Tovilla-Zarate70). Some studies have also looked at whether the APOE genotype modifies the effects of adiposity on lipid risk markers in subjects with CVD. Only interactions between the APOE2/E2 genotype and APOE4 allele with BMI on non-HDL-cholesterol were observed in 5796 subjects with clinically manifest vascular disease. In all genotype groups, there was a relationship between WC and VAT with non-HDL-cholesterol concentration(Reference Koopal, van der Graaf and Asselbergs71). Similarly, the effect of adiposity and APOE genotype was investigated in 359 Greek Caucasian subjects with CHD. In normal weight subjects, the APOE4 allele was associated with higher TC levels compared with APOE3 allele while in the overweight group, the APOE2 allele was related to higher HDL-cholesterol concentrations compared to APOE3 and APOE4 genotype groups(Reference Kolovou, Anagnostopoulou and Kostakou72). Although it appears counterintuitive to determine the relationship between genotype and CVD risk markers in patients with pre-existing CVD, the genotype x adiposity interactions observed on the lipid profile were in agreement with findings in healthy individuals suggesting that adiposity may in part override effects of genotype on CVD risk and progression. In summary, studies investigating the effect of APOE genotype on body composition and fasting lipids markers has provided inconsistent results and so there was no clear consensus on which allele played an important role in this relationship. While in some studies the interaction between APOE × adiposity was only evident in normal weight subjects, the others reported an interaction in the overweight/obese participants. Sub-group analysis performed in some of the studies suggest that the findings might be influenced by the participants sex, age, ethnicity and habitual diet and should be taken into consideration during data interpretation and the design of future studies.
Conclusion
Obesity is a consequence of the imbalance between energy consumption and expenditure leading to either subcutaneous and/or ectopic fat (visceral) accumulation. The literature suggests that a complex relationship exists between abdominal (visceral) obesity and CVD risk mediated by inflammation and insulin resistance. It is well recognised that dietary fat quality has an impact on both body composition and CVD risk markers, with SFA considered to be less favourable compared to UFA. Moreover, emerging studies have suggested BMI to play a role in the relationship between APOE genotype and CVD risk markers, but the specific allele which play an important role in this relationship remains unclear. Further studies recruiting according to genotype are needed to understand the role of modifiable risk markers and their interaction with gene variants related to lipid metabolism and body fat distribution.
Acknowledgments
The authors would like to thank the organisers of the Nutrition Society 2022 Summer Conference and Postgraduate Competition for their invitation to present this current review.
Financial support
E.O. was supported by The Republic of Turkey Ministry of National Education (Ph.D. studentship).
Conflicts of interest
J.A.L. is Deputy Chair of the UK Government Scientific Advisory Committee on Nutrition (SACN) and a previous member of the SACN working group on Saturated Fats and Health. J.A.L. was chair, and K.G.J. was a member of a scientific expert committee for the International Life Sciences Institute (ILSI) on Individual SFA and Cardiovascular Risk (2018–2021). E.O. has no potential conflicts of interest to disclose.
Authorship
E.O drafted the manuscript with intellectual contribution and revision from K.G.J and J.A.L. All authors approved the final version of the manuscript.


 Open access