


It is recognized that South Africa (SA), a low-middle-income country, is in the midst of a health transition characterized by a quadruple burden of communicable diseases, non-communicable diseases (NCD), perinatal and maternal and injury-related disorders( Reference Pillay-van Wyk, Msemburi and Laubscher 1 ), as well as experiencing a nutrition transition( Reference Vorster, Kruger and Margetts 2 ). Sharp increases in overweight, obesity, hypertension, diabetes and CVD, without substantial improvements in undernutrition among children, have been reported for all population groups( Reference Mayosi, Flisher and Lalloo 3 – Reference Shisana, Labadarios and Rehle 5 ). The South African Medical Research Council( Reference Norman, Bradshaw and Schneider 6 ) identified both under- and overnutrition as risk factors for disability-adjusted life years and mortality in the South African population. We have previously shown that the diet followed by black Africans in rural areas of the North West Province (NWP) does not meet micronutrient requirements( Reference Vorster, Venter and Kruger 7 – Reference MacIntyre, Venter and Kruger 10 ). However, with urbanization and ‘modernization’ of the diet, increases (but not optimization) of micronutrient intakes have been observed( Reference Vorster, Venter and Kruger 7 ). Simultaneously, macronutrient intakes have been characterized by increases in animal protein, total fat and especially added sugar( Reference Vorster, Venter and Kruger 7 , Reference Vorster, Kruger and Wentzel-Viljoen 11 ) while total carbohydrate intake has decreased( Reference Vorster, Venter and Kruger 7 ), despite increased intake of added sugar( Reference Vorster, Kruger and Wentzel-Viljoen 11 ). These changes in nutrient intakes have been described since the 1970s( Reference Vorster, Kruger and Margetts 2 ). To address micronutrient deficiencies, the South African Department of Health (Directorate Nutrition) instituted a mandatory micronutrient fortification of the staples, maize meal and bread flour, in 2003( 12 ) that came into effect in 2004. The objectives of the present study were to measure and report the changes in nutrient intakes of rural and urban black African men and women over time (from 2005 to 2010) to assess the impact of urbanization and modernization of lifestyles on dietary and therefore nutrient intakes and NCD risk.
Participants and methods
The PURE study
The Prospective Urban and Rural Epidemiology (PURE) study is a prospective cohort study tracking changing lifestyles, risk factors and chronic disease in urban and rural areas of seventeen countries in transition( Reference Corsi, Subramanian and Chow 13 , Reference Schutte, Schutte and Huisman 14 ). One of the legs of the PURE study in SA is being conducted in two areas (urban and rural) of the NWP (PURE-NWP-SA). The province is experiencing a typical epidemiological transition( Reference Vorster, Venter and Kruger 7 ). The baseline study was conducted in 2005 and the follow-up in 2010.
The design of the PURE-NWP-SA study has been described elsewhere( Reference Vorster, Kruger and Wentzel-Viljoen 11 , Reference Schutte, Schutte and Huisman 14 , Reference Sotunde, Kruger and Wright 15 ). Briefly, participants were recruited from four different sites (two rural and two urban) in the NWP of SA. A census profile of 6000 households (1500 in each area) was completed from which 4000 individuals were identified as meeting the inclusion criteria and visited at home. The study was explained to the individuals and after voluntary and informed consent was obtained, the questionnaires were completed. Questionnaires for 3750 participants were completed. These participants were invited to the study sites and after giving informed consent, blood samples were drawn and other measurements taken. The dietary questionnaires were also completed at this stage. In total, 2000 participants were tested (target of 500 in each community) in 2005. In the 5-year follow-up survey conducted in 2010, 1233 participants were included. Figure 1 provides a summary of the recruitment and follow-up procedures (adapted from Vorster et al.( Reference Vorster, Kruger and Wentzel-Viljoen 11 )).
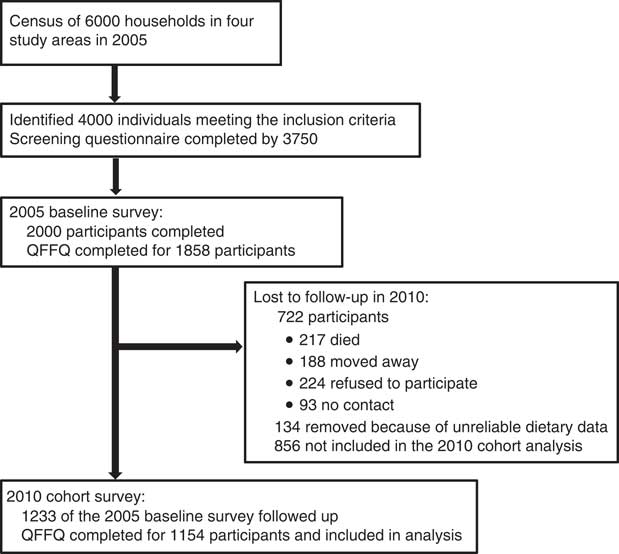
Fig. 1 Participant recruitment and follow-up from years 2005 to 2010 (adapted from Vorster et al.( Reference Vorster, Kruger and Wentzel-Viljoen 11 )). QFFQ, quantified FFQ
Measurements
Questionnaires
Standardized structured demographic, socio-economic, lifestyle and physical activity questionnaires of the international PURE study were used( Reference Corsi, Subramanian and Chow 13 ). These questionnaires were adapted for the South African study where necessary. Sixteen volunteer fieldworkers, from the communities where the study was undertaken, were recruited and intensively trained to complete the questionnaires at the study site or participant’s home in the language of choice (Setswana, Afrikaans or English). A 145-item, culture-sensitive, quantified FFQ (QFFQ) was used to obtain dietary intakes covering the previous month. The QFFQ was previously developed and extensively validated for this population( Reference MacIntyre, Venter and Vorster 16 , Reference MacIntyre, Venter and Vorster 17 ). Reproducibility was tested again for the present study( Reference Wentzel-Viljoen, Laubscher and Kruger 18 ). Portion sizes were reported by the participants using a food-portion photograph book( Reference Venter, MacIntyre and Vorster 19 ) specifically developed and tested for this population, as well as other suitable tools as previously described( Reference Wentzel-Viljoen, Laubscher and Kruger 18 ). Portion sizes reported in grams (based on the photographic portion book) or household measures were converted to weights using standard tables( Reference Langenhoven, Conradie and Wolmarans 20 ). Nutrient intake was calculated using the South African food composition database( Reference Wolmarans, Danster and Dalton 21 ). Food items not in the database were either analysed or sourced from other databases, added to the database and then coded as previously described( Reference Wentzel-Viljoen, Laubscher and Kruger 18 ).
Other measurements
The methodology used for the anthropometric measures (height, weight and waist circumference), blood collection, biochemical analyses (HDL-cholesterol) and HIV testing have been described previously( Reference Vorster, Kruger and Wentzel-Viljoen 11 , Reference Schutte, Schutte and Huisman 14 ).
Statistical analyses
The statistical software package Stata version 14 was used for the analyses. Due to the skewness of the nutrient intake data, results are reported as median and 25th percentile–75th percentile. Wilcoxon’s two-sample test was used to test for differences between the rural and urban participants (by gender) in terms of their nutrient intakes, as well as the changes in nutrient intakes between 2005 and 2010. Wilcoxon’s signed-rank test used to test for changes in nutrient intakes between 2005 and 2010 for each of the four groups (by gender and study site). Participants with energy intakes ≥30 000 or ≤3000 kJ/d in either 2005 or 2010 were excluded from the data set( Reference Vorster, Kruger and Wentzel-Viljoen 11 ).
To evaluate adequacy of intakes as well as compliance to recommendations for the prevention of NCD, reported nutrient intakes were compared with international recommendations( Reference Otten, Hellwig and Meyers 22 ), WHO recommendations( Reference Nishida, Uauy and Kumanyika 23 ) as well as the South African food-based dietary guidelines( Reference Vorster, Badham and Venter 24 ), as shown in the online supplementary material, Supplemental Table 1.
Baseline mean characteristics of the cohort in 2005 and of those participants lost to follow-up in 2010 are shown in Table 1.
Table 1 Baseline characteristics in 2005 of participants followed up from 2005 to 2010 (the cohort), compared with subjects lost to follow-up and compared with 2010; PURE-NWP-SA study
PURE-NWP-SA, Prospective Urban and Rural Epidemiology in the North West Province of South Africa; P25, 25th percentile; P75, 75th percentile.
* P value for significance of differences between subjects followed up in 2010 and those lost to follow-up (categorical variables: χ 2 test; continuous variables: two-sample Wilcoxon test).
† P value for significance of differences between the cohort in 2005 and 2010 (categorical variables: χ 2 test; continuous variables: two-sample Wilcoxon test).
In addition to intakes reported in their respective units, intakes of macronutrients were also expressed as a percentage of total energy, and intakes of micronutrients and dietary fibre per 4·2 MJ (1000 kcal; see online supplementary material, Supplemental Table 2; Tables 2 and 3). The percentages of participants not reaching 100 % of recommended intakes were also calculated and are shown in Tables 4 and 5.
Table 2 Daily nutrient intake, energy distribution and nutrient density of the male cohort by rural/urban residence in 2005 and 2010; PURE-NWP-SA study
PURE-NWP-SA, Prospective Urban and Rural Epidemiology in the North West Province of South Africa; P25, 25th percentile; P75, 75th percentile; TE, total energy.
* P value for significance of differences in intakes between 2005 and 2010 for rural men or urban men (two-sample Wilcoxon test)).
† P value for significance of differences in the change in intakes from 2005 to 2010 between rural men and urban men (Wilcoxon signed-rank test).
Table 3 Daily nutrient intake, energy distribution and nutrient density of the female cohort by rural/urban residence in 2005 and 2010; PURE-NWP-SA study
PURE-NWP-SA, Prospective Urban and Rural Epidemiology in the North West Province of South Africa; P25, 25th percentile; P75, 75th percentile; TE, total energy.
* P value for significance of differences in intakes between 2005 and 2010 for rural women or urban women (two-sample Wilcoxon test)).
† P value for significance of differences in the change in intakes from 2005 to 2010 between rural women and urban women (Wilcoxon signed-rank test).
Table 4 Nutrient intakes of the male cohort, expressed as a percentage of the recommendation, and the percentage who did not meet recommendations by urban/rural residence in 2005 and 2010; PURE-NWP-SA study
PURE-NWP-SA, Prospective Urban and Rural Epidemiology in the North West Province of South Africa; P25, 25th percentile; P75, 75th percentile; TE, total energy.
* Percentage of participants not meeting the recommendations.
† P value for significance of differences between 2005 and 2010 for rural men or urban men not meeting the recommendations (Wilcoxon two-sample test).
Table 5 Nutrient intakes of the female cohort, expressed as a percentage of the recommendation, and percentage who did not meet recommendations by urban/rural residence in 2005 and 2010; PURE-NWP-SA study

PURE-NWP-SA, Prospective Urban and Rural Epidemiology in the North West Province of South Africa; P25, 25th percentile; P75, 75th percentile; TE, total energy.
* Percentage of participants not meeting the recommendations.
† P value for significance of differences between 2005 and 2010 for rural women or urban women not meeting the recommendations (Wilcoxon two-sample test).
Results
Comparison of the cohort with those lost from the study and between 2005 and 2010
Dietary intake data of 1858 participants were measured in 2005. Table 1 shows the characteristics (in 2005) of the 1154 cohort participants who could be followed up in 2010 compared with the baseline characteristics of the 856 participants lost to follow-up. The latter were slightly (but significantly) younger, with a higher proportion of men, more HIV-infected participants, with lower BMI, waist circumference, HDL-cholesterol and total energy intake. There were small (but significant) increases in BMI and waist circumference from 2005 to 2010 that could probably be explained by the increase in energy intake and ageing.
Nutrient intakes, macronutrient distribution and micronutrient density of all participants in 2005
Supplemental Table 2 (see online supplementary material) shows that in 2005 the nutrient intakes of urban men and women were consistently higher than those of their rural counterparts.
Changes in nutrient intakes of men from 2005 to 2010
In Table 2, nutrient intakes of the male cohort (186 rural men and 202 urban men) in 2005 are compared with the intakes in 2010. Rural men consumed significantly more energy and therefore significantly more of all nutrients (P<0·05; except Mn) in 2010 than in 2005. However, the percentage of energy contributed by plant protein and the contribution of total carbohydrate to energy intake were lower in 2010 than in 2005, while the energy contributions from total and animal protein, total fat, saturated fat, monounsaturated fat and added sugar were higher in 2010 than in 2005. Energy from alcohol decreased significantly from 2005 to 2010. There were also significant increases in some micronutrient intakes (Fe, niacin and vitamin C), even when these micronutrients were expressed in terms of energy intake to ‘correct’ for increased energy intakes in 2010.
Urban men also showed a significant increase in total energy intake from 2005 to 2010 (P<0·001) and therefore an increased intake of all other nutrients. A non-significant decrease in the percentage of energy from alcohol was measured. No change in the percentage contribution of total protein to energy intake was observed, but similar to rural men, significant increases in the percentage contributions of animal protein, saturated and monounsaturated fats, as well as added sugar, to energy were seen. The percentage of energy from plant protein and total carbohydrate decreased significantly in rural and urban men from 2005 to 2010. Significant increases in micronutrient density for niacin and vitamin C and significant decreases for fibre and Zn were measured.
Changes in nutrient intakes of women from 2005 to 2010
Table 3 compares the changes in nutrient intakes over time in the female cohort (411 rural women and 355 urban women). Both rural and urban women consumed more energy in 2010 compared with 2005, with the consequence that intakes of all nutrients were higher in 2010 in the respective groups. However, as in the case of men, the changes in macronutrient distribution and micronutrient density showed distinct patterns.
In rural women, significant increases in the percentage of energy from animal protein, total, saturated, monounsaturated and polyunsaturated fats, as well as added sugar, were observed. Significant decreases in the percentage of energy from plant protein and total carbohydrate were seen. Furthermore, significant improvements in the nutrient density of Ca, Fe, niacin and vitamin C occurred, but the density of dietary fibre and thiamin decreased.
In urban women, percentage of energy from animal protein increased, while that from plant protein decreased. The change in percentage of energy from total fat was not significant. There was a significant decrease in the energy contribution from total carbohydrate between 2005 and 2010, but a significant increase from added sugar. Significant improvements in the nutrient density of Fe, niacin and vitamin C were seen, while that of Zn decreased.
Comparison of the differences in change of nutrient intakes between rural and urban participants
A possible question is whether the changes in nutrient intakes from 2005 to 2010 were significantly greater or smaller in rural than in urban participants. We therefore calculated the significance of the effect of time, shown in the final column of Tables 2 and 3.
Differences in change of nutrient intakes from 2005 to 2010 between rural and urban men
The significance of the differences in the change of nutrient intakes from 2005 to 2010 between rural and urban men is shown in Table 2. Because the change in energy intake from 2005 to 2010 was 1172 kJ/d greater in urban men, the changes in intakes of total protein, cholesterol and most micronutrients were also greater in urban men. However, when macronutrient intakes are expressed as a percentage of total energy and micronutrients intakes are expressed per 4·2 MJ, the changes in rural men were actually larger than those in urban men. These differences were significant for percentage of energy from plant protein, total, saturated and monounsaturated fats, and added sugar. The change in nutrient density was significantly higher in the rural men compared with the urban men for Fe.
Differences in change of nutrient intakes from 2005 to 2010 between rural and urban women
Table 3 shows that the median change in energy from 2005 to 2010 was slightly more in rural women (2·6 v. 2·3 MJ/d) than urban women (P=0·049). There were also other significant differences, for example the change in total fat intake was significantly greater in rural women. When expressed as a percentage of energy, the differences in change of macronutrients were significant for plant protein, total, saturated, monounsaturated and polyunsaturated fats, and total carbohydrate, with the rural women showing the largest change. Significant differences in change of micronutrients expressed per energy are also shown in Table 3. For dietary fibre, these changes showed a decrease in rural women but an increase in urban women. Therefore, the direction of change in rural and urban women was not always the same when nutrients were expressed in terms of energy intake.
Evaluation of dietary quality
We also measured how well the cohort participants met their nutrient needs and dietary recommendations for the prevention of NCD. The recommendations in Supplemental Table 1 (see online supplementary material) were used to determine whether a particular nutrient was under- or overconsumed by each participant. Furthermore, the percentage of participants in specific groups who did not meet their recommended intakes was also calculated. Table 4 gives values for men and Table 5 those for women, both by date (2005 and 2010) and rural v. urban participants.
Table 4 shows that in 2005 more than 50 % of the rural men did not meet the recommendation for sixteen of the twenty-three nutrients presented. More than 50 % of the urban men did not meet the recommendations for only six of the twenty-three nutrients in 2005. Although the situation improved in 2010 for the rural men, more than 50 % of them did not meet the recommendations for cholesterol, dietary fibre, Ca, K, pantothenic acid, vitamin C, vitamin D and vitamin E. Despite a higher energy intake (meaning that more food was eaten), still more than 50 % of the urban men had low Ca, K, vitamin C and vitamin D intakes in 2010 which did not meet the recommendations. In addition, the energy distribution was not optimal. There was a significant improvement in intake compared with the recommendation for rural and urban men for total protein, cholesterol, Zn, Cu, Mn, vitamin A, riboflavin, niacin, vitamin B6, pantothenic acid, biotin, vitamin C, vitamin D and vitamin E.
Table 5 shows that in 2005, 50 % of the rural women did not meet the recommendation for seventeen of the twenty-three nutrients presented. Although there was a significant improvement from 2005 to 2010, more than 50 % of the rural women still had an intake not meeting the recommendation for nine nutrients (cholesterol, fibre, Ca, K, pantothenic acid, biotin, vitamin C, vitamin D and vitamin E) in 2010. The nutrient quality of the diet of the urban women was better than that of the rural women, with more than 50 % of the urban women not meeting the recommendation for only seven of the twenty-three nutrients in 2005 and for only three nutrients (Ca, K and vitamin D) in 2010.
The energy distribution of the rural and urban women was not optimal. Because of overconsumption, more than 50 % of the participants in 2005 and 2010 did not meet the restrictive recommendations for total fat, saturated fat and added sugar.
Discussion
The objectives of the present part of the PURE-NWP-SA study were to measure and report the changes in nutrient intakes of rural and urban black African men and women over time, to assess the impact of urbanization and modernization of lifestyles on dietary and therefore nutrient intakes and NCD risk.
Energy intakes
The first important result was the substantial increase in energy intake from 2005 to 2010 in all groups. Increases in median values were 2·3, 3·4, 2·6 and 2·3 MJ/d for rural and urban men and rural and urban women, respectively. In 2010 (within 5 years) the rural subjects ‘caught up’ with the energy intake of the urban subjects measured in 2005. In 2010 the urban men consumed 13·3 MJ daily and women 11·3 MJ daily.
The question arises whether these increases are real or a result of methodological error. The facts argue against the latter. The same team of fieldworkers and researchers used in 2010 the same validated QFFQ that was used in 2005 to measure intakes. The reproducibility of the QFFQ was satisfactorily validated in the PURE-NWP-SA study in 2005( Reference Wentzel-Viljoen, Laubscher and Kruger 18 ). Because the median energy values of rural men and women in 2010 were similar to those of urban men and women in 2005, this suggests that ‘environmental’ or lifestyle factors were responsible for the increased intakes in 2010. There are several known contenders: (i) after the 2005 measurements, a large grocery and food store opened in the rural area which increased the availability and affordability of many foods, processed food products and beverages; (ii) social support in the form of grants in both rural and urban areas, and thus income, also increased over this time; and (iii) the rural area experienced a severe drought in 2005 which limited the availability of fresh products and income to buy them.
It seems reasonable to conclude that the observed rapid increases in energy intake in both rural and urban participants were real and part of an accelerated nutrition transition. The increases in energy intake were of course accompanied by expected increases in intakes of all other nutrients because of greater food consumption.
Similarly, a consistent rise in total energy supply (between 1970 and 2005) has been reported in the Middle East and North African countries( Reference Sibai, Nasreddine and Mokdad 25 ), while the Chinese population is consuming more energy-dense food than previously( Reference Popkin, Lu and Zhai 26 ). In Brazil, dietary deficit is changing to dietary excess( Reference Monteiro, Mondini and de Souza 27 ). It was recently reported in Nepal that there has been a change from an agricultural staple-based foods diet to a modern processed-foods diet with higher total energy, total fat and sugar( Reference Subedi, Marais and Newlands 28 ).
Macronutrient distribution
Another salient observation is the changes in macronutrient intakes and macronutrient distribution (expressed as a percentage of total energy) over time. These changes followed the same pattern described as part of the nutrition transition in the NWP when rural and urban Africans were compared in a cross-sectional study( Reference Vorster, Venter and Kruger 7 , Reference MacIntyre, Kruger and Venter 8 ). The differences in intakes between rural and urban participants in 2005 were similar to the changes observed in both rural and urban participants over time (in 2010). The urban participants ate more in 2005 and 2010 than their rural counterparts. With a few exceptions, the changes included the following: (i) the percentage of energy contributed by total protein (except urban men), animal-derived protein, total fat (except urban women), saturated fat, monounsaturated fat and added sugar all increased significantly and reflected increased intakes of mainly meat, eggs and milk; (ii) the percentage of energy from plant protein decreased significantly in all groups; and (iii) the percentage of energy from total carbohydrate decreased significantly in rural participants despite the increase in added sugar (a carbohydrate which forms part of total carbohydrate), therefore this decrease probably reflects the decreased intake of starchy staple foods. Because these changes occurred mostly in rural participants it suggests that the diet followed by urban participants in 2005 (except for energy intake) was already modernized to a ‘stable’ level and that rural participants still had ‘room to move’ towards the energy distribution seen as a result of the nutrition transition. The change from a high-fibre-rich carbohydrate to a lower-carbohydrate diet with more sugar and sugar-sweetened beverages is also taking place in other countries( Reference Subedi, Marais and Newlands 28 – Reference Mattei, Malik and Wedick 30 ). In addition, a dramatic increase in meat consumption has been reported for China and Brazil( Reference Vranken, Avermaete and Petalios 31 ).
An interesting finding is the significantly lower alcohol intake in rural and urban men in 2010 (both in grams and as a percentage of energy intake). A possible explanation could be that due to the nutrition transition, modernization and moving away from traditional home-brew methods, men consumed commercial beer rather than home-made beer. Commercial beer is more expensive and the higher price could have lowered its consumption.
Although we did not test for significance between men and women, it is interesting to note that women consumed more added sugar (in grams and as a percentage of energy; except for the rural women in 2005) than men. We previously showed( Reference Vorster, Kruger and Wentzel-Viljoen 11 ) that more women than men consumed sucrose-sweetened beverages in 2005 and 2010 and that the quantities were also larger. It could also be that the women consumed more sugar in their tea/coffee.
Micronutrient intakes: nutrient adequacy
One would have hoped and expected that the fortification of maize meal and bread flour, two main staples in these populations, would correct micronutrient deficiencies of most people in SA. The present study, however, showed that intakes of the rural men and women in 2005 did not meet recommended values for most minerals and vitamins. The situation was better in the urban groups and improved over time in both rural and urban participants. Therefore, the nutrition transition resulted in improved, but still not optimal micronutrient intakes. The South African food composition tables incorporated new analytical data of the fortified staple foods. However, it was reported in 2012( Reference Yusufali, Sunley and de Hoop 32 ) that many of the samples of maize meal and white bread flour across SA that were analysed were insufficiently fortified. To assess the real extent of micronutrient deficiencies, suitable biological markers of the micronutrients will have to be measured in future. Nevertheless, the data showed that micronutrient needs in the PURE-NWP-SA participants were not met despite a high intake of energy, probably a result of more energy-dense but nutrient-poor foods chosen.
Protective dietary effects
The low intakes of dietary fibre and many of the antioxidant micronutrients are of concern. The low-fat, high-fibre traditional diet of the indigenous people of Africa has been regarded as a major factor protecting them against NCD( Reference Vorster, Kruger and Margetts 2 , Reference Walker 33 , Reference Popkin 34 ). The nutrient intake changes observed here are indicative of a loss of this protection of the diet. Schutte and co-workers( Reference Schutte, Schutte and Huisman 14 ) already reported that 24 % of participants of the PURE-NWP-SA study who had normal blood pressure in 2005 presented with hypertension in 2010, while we showed the massive increased consumption of nutrient-poor sugar-containing beverages over this time( Reference Vorster, Kruger and Wentzel-Viljoen 11 ). Together with other changes during the epidemiological transition, the increase in NCD among the Africans in SA is not surprising.
Limitations
One of the major limitations of the PURE-NWP-SA study, namely the moderately high proportion of subjects lost to follow-up, of whom 30 % died, was discussed previously( Reference Vorster, Kruger and Wentzel-Viljoen 11 ). Those lost to follow-up were significantly younger, more often males, a higher percentage were HIV-infected, with lower BMI, waist circumference, HDL-cholesterol and energy intake than those followed up. We suspect that the rest of the participants lost to follow-up, being younger and male, probably moved away to bigger cities where there are more opportunities for work.
Conclusions
It is concluded that the results of the current analysis of the PURE-NWP-SA nutrient data confirm a rapid nutrition transition in the NWP, characterized by large increases in total food energy without correcting fully for micronutrient deficiencies despite fortification of staple foods. Micronutrient intakes could even be lower because of insufficient fortification. Furthermore, the shift towards an animal food-based diet at the cost of a lower plant protein food intake could increase the risk of NCD. The data also confirmed that low dietary fibre and micronutrient intakes were prevalent, further contributing to a double burden of under- and overnutrition in this population.
Acknowledgements
Acknowledgements: The authors acknowledge the contribution of the late Professor Annamarie Kruger to the PURE South Africa study. They thank all supporting staff and participants in the PURE study; in particular, from PURE South Africa, the PURE-NWP-SA research team, fieldworkers and office staff in the Africa Unit for Transdisciplinary Health Research and the Centre of Excellence for Nutrition, Faculty of Health Sciences, North-West University, Potchefstroom, South Africa; and from PURE International, S. Yusuf and the PURE project office staff at the Population Health Research Institute, Hamilton Health Sciences and McMaster University, Ontario, Canada. Financial support: This work was supported by the South Africa Netherlands Research Program on Alternatives in Development; the South African National Research Foundation (GUN numbers 2069139 and FA2006040700010); North-West University, South Africa; the Population Health Research Institute, McMaster University, Canada; and the South African Medical Research Council. Funders were not involved in any aspect of the design, implementation, analysis, or interpretation and written account of the study. Conflict of interest: The authors declare that they have no competing interests. Authorship: E.W.-V. and H.H.V. were responsible for the conception and design, analysis and interpretation of the data and wrote the manuscript. S.L. made contributions to the design, analysis and interpretation of the data and critically revised the manuscript for important intellectual content. R.L. was responsible for the statistical analysis of the data and made contributions to the interpretation of the data and critically revised the manuscript for important intellectual content. Ethics of human subject participation: The Ethics Committee of the North-West University approved the study (04M10 and NWU-0016-10-A1). The study complied with all applicable requirements of international regulations, including the Helsinki Declaration of 1975 (as revised in 2008). Permission for the study was also obtained from the North-West Provincial Department of Health, local government authorities, and tribal chiefs in the rural areas. Volunteers gave written informed consent. The participants were transported to and from the study sites in both the urban and rural areas. They received lunch on site after blood sampling was completed. The study is registered at ClinicalTrials.gov (ID NCT03225586, https://clinicaltrials.gov).
Supplementary material
To view supplementary material for this article, please visit https://doi.org/10.1017/S1368980018001118


