


Cancer and circulatory system diseases are the principal causes of mortality in the Basque Autonomous Community(1) and Spain(2), and these data are in line with the mortality rates of the European Region according to a WHO report(3). Lifestyle, including diet, has an important role in the treatment and prevention of non-transmissible chronic diseases, as previously mentioned(Reference Mertens, Markey and Geleijnse4–Reference Ros, Martínez-González and Estruch6). In this context, nutrition assessment is the first step to dietary modification in community-based interventional programmes(Reference Willett, Lenart and Willett7); however, it is widely recognised that a cause of uncertainty in the knowledge of the role of diet in the development of diseases is an intrinsic lack of precision in the methods used to assess dietary intakes(Reference Pisani, Faggiano and Krogh8), and this inaccuracy may be impeding our ability to understand the impact of dietary factors on these diseases(Reference Shim, Oh and Kim9).
Some dietary assessment methods, such as dietary records and dietary histories, are expensive and time-consuming, and they are not suitable for epidemiological studies(Reference Shim, Oh and Kim9). Thus, FFQ, among other methods used to assess dietary intakes, has been and will probably continue to be the main tool used in epidemiological studies(Reference Collins, Boggess and Watson10,Reference Steinemann, Grize and Ziesemer11) because they are easy to administer, they can assess dietary intake for a long period of time, and they are cheaper(Reference Subar12). In this method, selected food items are listed and the frequency of intake and usual portion or serving sizes (average quantity per intake) are noted. To calculate the consumption of a food item, the portion size is multiplied by its intake frequency(Reference Wakai13).
The lesser number of food items found in an FFQ compared with open methods makes it easier and cheaper to collect, process and analyse data(Reference Cade, Thompson and Burley14). Moreover, when using a short FFQ (SFFQ), the time for data processing is reduced, and these questionnaires are less burdensome for the participants to complete(Reference Andersen, Johansson and Solvoll15) than are other dietary evaluation methods. SFFQ has been previously developed and validated for different population groups(Reference Henriksen, Carlsen and Paur16,Reference Saeedi, Skeaff and Wong17) , but because of the variety of dietary habits that depend on ethnic, social and cultural backgrounds and the sensitivity of FFQ to the culture and ethnic background of the study population, FFQ must be tailored to target populations(Reference Wakai13,Reference Shu, Yang and Jin18) .
Although some studies have validated different versions of FFQ for various objectives in the Spanish population, to the best of our knowledge no SFFQ has been validated for use in the residents of the Basque Autonomous Community. Therefore, we required an SFFQ to assess the dietary patterns and nutritional improvement in this population(19). The current study was performed to adapt an SFFQ, evaluate its relative validity and reproducibility to assess food group intake in a population resident in the Basque Country, and determine the possible influence of associated variables (such as education level or weight status) on its validity and reproducibility. The original SFFQ used in the current study was validated in the general population in other regions of Spain(Reference Rodríguez, Ballart and Pastor20).
Methods
Subjects and study design
The target population consisted of a sample of adults living in the Basque Autonomous Community (a region in northern Spain). The sampling design was polietapic and stratified by sex and age among individuals drawn randomly from the Basque Country population with the aim of obtaining a representative sample(21). The sample size was chosen based on the findings of Cade et al. (Reference Cade, Thompson and Burley14), which established that a sample size of at least 50–100 individuals is sufficient for testing FFQ validity.
Eligibility criteria for inclusion were established to recruit a healthy population and are as follows: (1) adults aged ≥18 years, (2) residents who had lived in the Basque Autonomous Community for >5 years, (3) free-living people without serious diseases requiring a special diet, (4) subjects not on a weight reduction diet and (5) subjects not related to other participants.
Subjects included in the validation study were recruited from February 2013 to February 2014. In total, 135 subjects were invited to participate in the current study, and the response rate was 73·3 %, that is, a total of ninety-nine subjects consented to join the current study and completed the first SFFQ (SFFQ1) and the first series of 24-h recalls (24HR). Among these subjects, eighty-two finished three series of 24HR and a second SFFQ (SFFQ2) and were included in the final analyses (56·1 % were females). Thus, the final participation rate was 60·7 %. Each of the series of 24HR included three phone interviews (on non-consecutive days) in which participants were asked to describe the foods and amounts consumed over the previous day. Information was collected for 3 days – 2 weekdays and 1 weekend day (1 day’s information in each of the interviews). A series of 24HR interviews were carried out at 4-month intervals during the study period.
The mean age was 47·3 years (range 21·0–88·0, sd 17·8); the mean BMI was 25·2 kg/m2 (range 17·0–36·5, sd 4·2); and no significant differences were observed by sex for age and BMI (P > 0·05). The current study covered a time period of 1 year. The study design is shown in Fig. 1. At the beginning and end of this period, the participants completed the same SFFQ (SFFQ1 and SFFQ2, respectively) through a face-to-face interviews conducted by well-trained interviewers. Although the evaluation study was conducted via face-to-face interviews using an SFFQ, in later studies it was self-reporting of diet with instructions on how to complete the SFFQ with staff members providing assistance when needed. In any case, both face-to-face interviews and self-reported SFFQ were subsequently checked by a dietician.

Fig. 1 Flow chart of the validation study. SFFQ, short FFQ; 24HR, 24-h recall
Short FFQ
After comparing the original SFFQ(Reference Rodríguez, Ballart and Pastor20) with a quantitative study on food consumption in the Basque Autonomous Community(22), we identified twenty-two new items that corresponded to frequently consumed foods in this population. The food items that we added to the original SFFQ, which consisted of forty-five items, were whole grains (muesli, whole wheat flakes…); cookies with fibre; butter; margarine; sugar (added to milk, yogurt, coffee); honey; garlic and onions; fried foods or foods with added oil; whole bread; fried tomato sauce; mayonnaise; spicy (pepper, paprika, hot chili…); salt; sausages, foie-gras and pates; bacon; raisins, prunes, dried figs and dates; coffee or tea; cider; and aperitifs with alcohol (vermouth…) (food items are ordered in the same way as they were presented in the SFFQ).
Moreover, in the new questionnaire, items corresponding to milk and dairy products were itemised as: whole milk, semi-skimmed milk and skimmed milk; and full-fat yogurt and low-fat yogurt. These introduced three additional items because in the original there was only an item for each food. In the end, the SFFQ included sixty-seven food items. The distribution of new food items by food groups was as follows: processed meat (two new items), milk (two new items), dairy products (one new item), cereals (two new items), fruits (one new item), vegetables (one new item), sweets and sugar (three new items), other foods (three new items), other alcoholic drinks (two new items), fat (two new items), coffee or tea (one new item), added salt (one new item) and spicy foods (one new item). The distribution of the rest of food groups remained the same. Additionally, an open question was added with the objective of identifying foods that were not included in the SFFQ, such as soy products. When a food was written in the open questionnaire, we also asked how often they consumed it.
For each food item, participants were first asked whether they consumed that specific item. If the participant affirmed consumption, they were asked about the usual frequency of consumption (weekly or monthly) of one standard serving(Reference Carbajal, Sánchez-Muniz, García-Arias and García-Fernández23). With respect to vegetable oil(s) consumption, due to the difficulty in estimating it, we followed the same rule as the original authors(Reference Rodríguez, Ballart and Pastor20); in all cases, we used the median quantity consumed by the study population; for the Basque Country population, this was 29·89 g/d(22). Additionally, we asked about the consumption frequency of fried or stewed foods and foods with oil added (e.g., salads), and about the type of vegetable oil(s) usually consumed with these foods (olive, sunflower, corn, soya or other); the combination of both data allowed us to estimate the proportion of daily consumption of each type of oil.
Answers about weekly or monthly intake frequency for each food item were transformed into daily servings. The daily intake of each food item (g/day) was calculated by multiplying the reported number of daily servings by the standard serving size of each food item in Spain(Reference Carbajal, Sánchez-Muniz, García-Arias and García-Fernández23). For items that included several foods, each food’s contribution was estimated with weighting coefficients obtained from usual consumption data(22). All food items consumed were entered into DIAL 2.12(Reference Ortega, López-Sobaler and Andrés24), a dietary assessment programme to estimate the total energy intake. The results of food group intake are expressed as daily consumption per 1000 kcal.
24-h recalls
To minimise errors in portion size, we used the protocol described in the Innovative Dietary Assessment Methods in Epidemiological Studies and Public Health – Standard Operating Procedure (IDAMES-SOP) for 24HR telephone interviews(25). Based on this protocol, a trained dietician collected the 24HR, and all completed recalls were checked by a research supervisor for accuracy. To avoid errors, participants were not informed about the day they would be contacted. Once they were contacted for interview via telephone, a short explanation about the procedure was given to each participant. They were asked about everything they had eaten or drunk the last 24 h and they then had to describe in detail all of the items, such as the type of food and its characteristics (full-fat dairy, fresh fish, etc.), preparation method and the dressings (type of oil used) or condiments used.
Simultaneously, the interviewer collected all the data in a note file, and once the interview was finished, the interviewer reviewed it. These data were registered into DIAL 2.12(Reference Ortega, López-Sobaler and Andrés24), and in case of mixed dishes for which the participants did not know the ingredients, a search in the database of standardised recipes(26,27) was done.
Covariates
Information on sociodemographic and economic characteristics (sex, age, marital status and children, birthplace, place of residence, household members and number of rooms used for sleeping, educational attainment, economic activity and last work) and lifestyle (alcohol consumption, smoking status, duration of sleep and physical activity (PA)) were registered at the same time as SFFQ1 via a face-to-face interview based on questions employed by the Spanish Health Survey(28).
We estimated the crowding index using the household members and the number of rooms used for sleeping. This index is considered a good indicator of social status(Reference Cabrera de León, Rodríguez Pérez and Domínguez Coello29). The following variables were re-categorised for easier data analysis: age was dichotomised taking account of the median (younger subjects <46 years and older ones ≥46 years); marital status was separated into the following categories: not part of a couple (single, separated or divorced, widowed) and part of a couple (married and others); birthplace was dichotomised as Basque Country and others (any region apart from Basque Country); economic activity was separated into working, unemployed, retired and others (looking after home or family or others); and last work was categorised as steady salaried employee (cooperative members included), temporary salaried employee and others (employer, businessmen/women or others). Finally, BMI classification, alcohol consumption and smoking status were dichotomised as non-overweight and overweight/obese; non-current (those who do not drink or those who drank only in the past) and current drinkers (those who currently drink); and non-smokers and smokers, respectively.
Additionally, we obtained the following data about weight status: self-reported weight and height, desired weight and healthy weight. These data were obtained by asking the participants the following questions: ‘What do you usually weigh?’, ‘How tall are you?’, ‘What would you say is your ideal weight?’ and ‘What would your doctor say is your ideal weight according to standard height/weight charts?’)(Reference Pattishall, Hayes and Sachiko30,Reference Spencer, Appleby and Davey31) . BMI was estimated from self-reported height and weight and classified according to the WHO criteria(32).
Apart from BMI, using these data the following variables were calculated: for body weight dissatisfaction (BWD), the desired weight minus the self-reported weight was divided by the self-reported weight and multiplied by 100(Reference Kuk, Ardern and Church33); and for healthy weight perception (HWP), the healthy weight minus the self-reported weight was divided by the self-reported weight and multiplied by 100. The ‘weight difference percentage’ was considered a meaningful difference if it was ≥5 %. A 5 % cut-off was used in a previous study(Reference Jackson, Wardle and Johnson34) to assess the desire to weigh less using the ideal–actual weight discrepancy. This method was preferred for its simplicity and utility(Reference Nianogo, Kuo and Smith35).
Three other categories were created for BWD: desired weight less than self-reported weight (dissatisfaction by excess: relative difference ≤–5 %); desired weight greater than self-reported weight (dissatisfaction by defect: relative difference ≥5 %); and desired weight same as self-reported weight (satisfaction: –5 % < relative difference < 5 %). Finally, three categories were generated for HWP: healthy weight less than self-reported weight (relative difference ≤–5 %); healthy weight greater than self-reported weight (relative difference ≥5 %); and healthy weight same as self-reported weight (–5 % < relative difference < 5 %).
Statistical analysis
The data were analysed using SPSS for Windows (version 22.0, SPSS Inc.) and STATA13.0 (Stata Corp LP). The results are expressed as mean (standard deviation) and median daily intake as well as grams per 1000 kcal per day to adjust for energy density. The distribution of values was examined for normality by the Kolmogorov–Smirnov–Lilliefors test. Data collected through SFFQ and 9-day 24HR were non-normally distributed, with the exception of cereals, legumes and fat intake assessed by SFFQ1 and SFFQ2. Cereals, legumes and fat intakes were analysed using parametric methods. For non-normally distributed data, that is, for the rest of food items, non-parametric tests were performed. In the case of crude correlations, Spearman’s correlation coefficients were used, except for the three food groups whose distribution was normal for which Pearson’s correlation coefficients were used.
The validity of SFFQ was evaluated by comparing the average 9-day 24HR with the data obtained in the SFFQ. Differences in each comparison are presented as a percentage of consumption for the 9-day 24HR. To estimate these percentages of consumption relative to the 9-day 24HR, non-intakers’ data for the 9-day 24HR were not taken into account, since the division of a number by zero would result in infinity (SFFQ value × 100/0 = ∞). The differences in food group intake between two SFFQ and between SFFQ and the average of 9-day 24HR were assessed using paired t-tests (Student’s t or Wilcoxon signed-rank test). To determine if crude and age- and sex-adjusted correlations existed between the two methods, 9-day 24HR and SFFQ, and between two SFFQ, Pearson or Spearman correlations were conducted. To correct within-person errors in the measurement, age- and sex-adjusted correlations were multiplied by a de-attenuation factor, (1 + γ/n)1/2, where γ is the ratio of within- and between-person variances and n is the number of repeats (n 11)(Reference Rosner and Willett36). One-way ANOVA was used to calculate this ratio. We also estimated de-attenuation correlations associated with P-values(37).
Additionally, to measure the degree of agreement, subjects were classified into quartiles based on food group intakes obtained by the two methods (SFFQ2 and 24HR), and the percentages of agreement (same and adjacent quartiles) and complete disagreement (distant quartiles) are presented. Additionally, the agreement between two SFFQ was also calculated. Reproducibility and reliability were analysed using Cohen’s κ statistic for qualitative variables and intraclass correlation coefficients (ICC) for quantitative variables(Reference Martínez-González, Toledo, Sánchez-Villegas, Martínez-González, Sánchez-Villegas and Toledo Atucha38). The cut-off points for Cohen’s κ were: >0·8, excellent; >0·6, good/moderate; and >0·4, acceptable, while those for ICC were: <0·4, poor; 0·40–0·75, good or moderate; and >0·75, excellent(Reference Martínez-González, Toledo, Sánchez-Villegas, Martínez-González, Sánchez-Villegas and Toledo Atucha38).
Bland–Altman(Reference Bland and Altman39) plots on energy-adjusted values were also used to graphically check the agreement between the two methods; these plots would show the differences in intake between the two methods (SFFQ2 v. 9-day 24HR) against the mean intake of both measures ((SFFQ2 + 9-day 24HR)/2). The upper and lowest acceptable limits with 95 % CI were calculated with this formula: mean ± (1·96 × sd). For Bland–Altman plots, the same food groups as used in Fernández-Ballart et al. (Reference Fernández-Ballart, Piñol and Zazpe40) were selected for the current study.
Finally, the possible influences of associated variables on validity and reproducibility were assessed by χ 2 test and Fisher’s exact test. In the current study, the results are shown for the same food groups as Bland–Altman plots. The associated variables examined in the current study were marital status, children, education level, economic activity, BMI, BWD and HWP classifications, PA level and smoking status. For these analyses, dichotomic categories of associated variables were crossed with the quartiles (same/adjacent v. distant) based on the food group intakes obtained using the two methods (SFFQ and 24HR). Variables were re-categorised in the following way to analyse the influence of covariates: marital status (without partner v. with partner), children (yes v. no), education level (primary education or without studies v. higher than primary education), economic activity (working v. others), BMI (under/normal weight v. overweight/obesity), BWD (dissatisfied v. satisfied), HWP (dissatisfied v. satisfied), physical exercise during free time (yes v. no) and smoking status (yes v. no). All tests were two-sided, and P-values <0·05 were considered statistically significant.
Results
The general characteristics of participants are shown in Table 1. The mean age was 47·3 years, and the majority of subjects were an active worker, residing in an urban area, without partners and had children and at least a secondary education. Regarding the economic activity, more males than females were working; in the case of men, there were more steady salaried employees, while among women, there were more temporary salaried employees. With regard to lifestyle, most of the participants had a normal weight, were current drinkers, were non-smokers and did physical exercise during free time; however, the analysis of these variables by sex showed that males smoked a greater number of cigarettes and had a higher PA level than found for women. Additionally, with respect to weight status, there were no significant differences by sex in BMI, BWD and HWP classifications.
Table 1 Characteristics of the study sample: adults living in the Basque Autonomous Community

BWD, body weight dissatisfaction; HWP, healthy weight perception.
* Significant P-values are highlighted in bold.
† Any region apart from Basque Country.
‡ Looking after home or family and others.
§ Employer, businessman/women or others.
‖ Relative difference ≤–5 %.
¶ Relative difference ≥5 %.
** 5 % < relative difference < 5 %.
Validation and reproducibility analysis is shown in Tables 2 and 3; see online supplementary material, Supplementary Tables 1 and 2, and Fig. 2. In addition, some of these tables (in particular Table 2 and see online supplementary material, Supplementary Table 1) include data on reproducibility from the SFFQ. The mean daily intake of food groups (g/1000 kcal) (assessed by 9-day 24HR, SFFQ1 and SFFQ2) is presented in Table 2. Higher intake values were obtained with the SFFQ (SFFQ1 and SFFQ2) than with the 9-day 24HR for the following foods and beverages (sequenced in order of appearance in Table 2): fatty fish, other foods, light drinks, other alcoholic drinks, fat, broth and soups, added salt and spicy foods (P < 0·05). Among these products, the highest mean differences were observed for light drinks, fat, and broth and soups. The intake value of the following products was lower for the SFFQ1 and SFFQ2 than for the 9-day 24HR (sequenced in order of appearance in Table 2): total meat, processed meat, milk and cereals (P < 0·05). The highest mean differences, in favour of 9-day 24HR, were observed for total meat and milk. However, no significant differences were found between mean intakes obtained in the SFFQ1 and SFFQ2. For some foods, such as milk, the SFFQ mean intake was lower than the 9-day 24HR mean intake; however, the percentage reported in the 9-day 24HR was >100 %, at 230·3 %; this result could be due to a wide standard deviation.
Table 2 Mean daily intake of food groups estimated from 9-day 24HR and two SFFQ
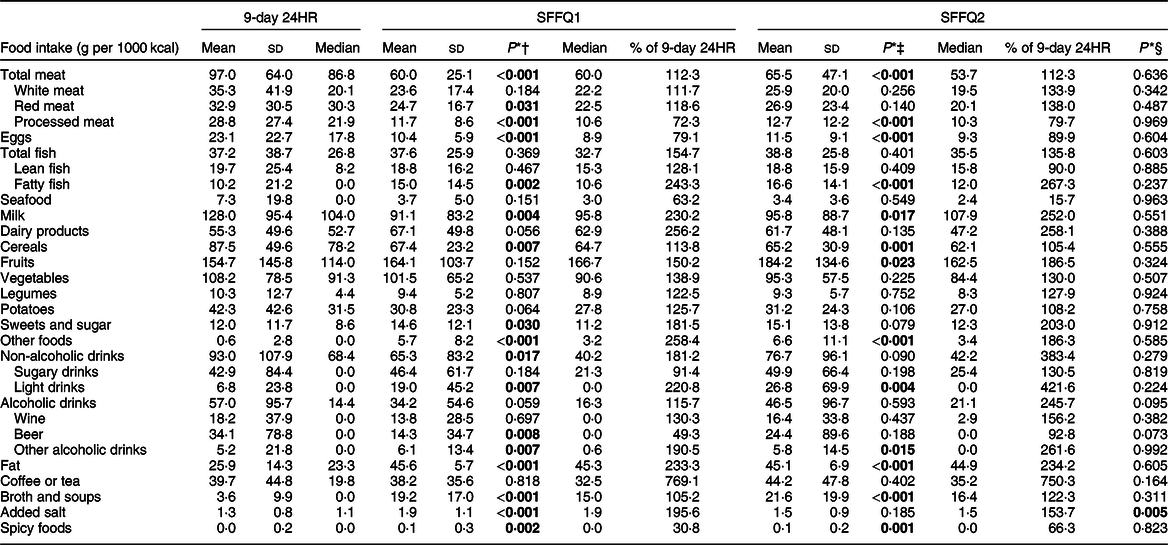
24HR, 24-h dietary recalls; SFFQ, short FFQ.
* Significant P-values are highlighted in bold.
† Differences in intakes of food groups between 24HR and SFFQ1.
‡ Differences in intakes of food groups between 24HR and SFFQ2.
§ Differences in intakes of food groups between SFFQ1 and SFFQ2.
Table 3 Correlation coefficients for the estimation of energy density in food groups by 9-day 24HR and two SFFQ*

24HR, 24-h dietary recalls; SFFQ, short FFQ.
* Higher and lower correlation coefficients in each column are depicted as bold numbers.
† Significant P-values are highlighted in bold.

Fig. 2 Bland–Altman plot for agreement between SFFQ2 and the mean of 9-d 24HR for intake of vegetables (a), meat and meat products (b), potatoes (c) and legumes (d). SFFQ, short FFQ; 24HR, 24-h dietary recall
Table 3 presents the crude and adjusted coefficients of the associations between the SFFQ and 9-day 24HR. The crude correlation coefficients varied from –0·008 (fat) to 0·705 (alcoholic drinks). The means of correlation coefficients for all food groups were 0·277 and 0·304 for SFFQ1 and SFFQ2, respectively. The adjusted coefficients ranged between –0·011 (spicy foods) and 0·712 (wine). The mean age- and sex-adjusted coefficient for SFFQ1 was 0·231, while that obtained for SFFQ2 was 0·254. The de-attenuated correlations and ICC between food intakes estimated from the SFFQ and 9-day 24HR are shown in online supplementary material, Supplementary Table 1. The mean de-attenuated correlation coefficients were 0·286 (for SFFQ1) and 0·301 (for SFFQ2) and ranged from –0·013 (spicy foods) to 0·963 (other foods). According to ICC, good/moderate or excellent reproducibility was observed for both SFFQ for the following foods/beverages: dairy products, fruits, vegetables, sugary drinks, alcoholic beverages (especially wine and beer), and coffee or tea (sequenced in order of appearance in online supplementary material, Supplementary Table 1). Moreover, Bland–Altman plots showed that for all the analysed food groups, <10 % of participants were out of the limits of agreement (Fig. 2), indicating fairly good agreement between the SFFQ2 and 9-day 24HR. This analysis also showed a tendency for the differences to increase as the magnitude of measurement increased for all food groups except vegetables.
Reliability statistics for the SFFQ are presented in Table 4. Crude Pearson’s correlations ranged from 0·201 (fat) to 0·809 (alcoholic drinks), and age- and sex-adjusted coefficients ranged from 0·219 (spicy foods) to 0·823 (wine). ICC showed excellent or good reproducibility for the majority of analysed foods: processed meat, eggs, lean fish, milk, dairy products, fruits, vegetables, sweets and sugar, other foods, non-alcoholic drinks, sugary drinks, light drinks, alcoholic drinks, wine, beer, other alcoholic drinks, and coffee or tea.
Table 4 Correlation coefficients between SFFQ1 and SFFQ2 and intraclass correlation coefficients (ICC)

SFFQ, short FFQ.
* Significant P-values are highlighted in bold.
† Pearson correlation coefficients; higher and lower correlation coefficients in each column are depicted as bold numbers.
The classification of SFFQ1 and SFFQ2 intakes into quartiles showed that the minimum percentage of subjects placed in the same or adjacent quartile was 72·0 % (this percentage was obtained for the food group ‘fats’). For the rest of the food groups, the percentage of agreement between SFFQ1 and SFFQ2 was ≥75·6 % (see online supplementary material, Supplementary Table 3). The mean percentage of participants placed in the same or adjacent quartiles was 82·6 %. Cohen’s κ indicated good, moderate or acceptable agreement for the following foods/beverages (ordered from higher to lower κ values): sugary drinks, processed meat, light drinks, total fish and alcoholic drinks.
However, 75·2 % of participants’ food intakes derived from the SFFQ2 and 9-day 24HR were classified into the same or adjacent quartiles (Table 5). Cohen’s κ ranged from –0·045 (fat) to 0·632 (alcoholic drinks), with an average value of 0·257, indicating acceptable to good agreement for the following products (ordered from higher to lower κ values): alcoholic drinks, beer, coffee or tea, wine, dairy products, fruits and sugary drinks. Regarding the influence of associated variables (marital status, having children, education level, economic activity, BMI, BWD and HWP classifications, PA level and smoking status) on validity and reproducibility, no association was found (P > 0·05). For example, the results for vegetables (SFFQ1 v. SFFQ2 and SFFQ2 v. 9-day 24HR) by marital status were χ 2 = 0·457 (P > 0·05) and 1·553 (P > 0·05), respectively; the results for meat and meat products (SFFQ1 v. SFFQ2 and SFFQ2 v. 9-day 24HR) by having or not having children were χ 2 = 3·579 (P > 0·05) and 0·824 (P > 0·05), respectively; the results for potatoes (SFFQ1 v. SFFQ2 and SFFQ2 v. 9-day 24HR) by education level were P = 0·526 and 0·175, respectively (Fisher’s exact test); and the results for legumes (SFFQ1 v. SFFQ2 and SFFQ2 v. 9-day 24HR) by economic activity were χ 2 = 1·059 (P > 0·05) and 0·010 (P > 0·05), respectively.
Table 5 Misclassification and weighted κ between SFFQ2 and 9-day 24HR
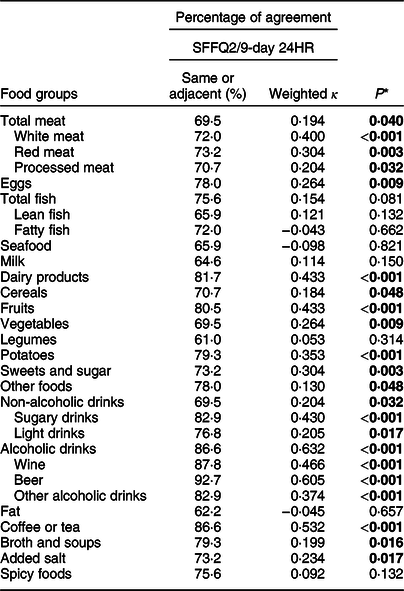
SFFQ, short FFQ; 24HR, 24-h dietary recalls.
* Significant P-values are highlighted in bold.
Discussion
In the current study, we adapted and assessed the validity and reproducibility of an SFFQ in a population resident in the Basque Country; additionally, we analysed the influence of some variables (such as education level or weight status) on validity and reproducibility. To our knowledge, no previous study has investigated these aspects in this population. The general characteristics of the sample, with regard to having children, place of residence, education level and economic activity, were similar to those of the general Basque population(41). Relative to weight status, the percentage of overweight/obesity in our sample was similar to the latest health survey carried out in the Basque Autonomous Community(42), and in both cases, the percentage of men with overweight/obesity was higher than that of women.
The results indicate that the SFFQ is a reasonably good method for dietary assessment in relation to 24HR for many food groups. In addition, the number of items in this FFQ could be considered optimal, because it matched the median number used in other studies(Reference Cade, Thompson and Burley14). It is important to emphasise that there is no fixed number of items for FFQ, and each item should be designed to provide information for which it was intended(Reference Cade, Burley and Warm43).
The design of the current study was the same as that used in other validation and reproducibility studies(Reference Zhuang, Yuan and Lin44,Reference Villegas, Yang and Liu45) . In our case, SFFQ was administered at the beginning and the end of study, and 24HR was performed during the year at 4-month intervals, in agreement with the theory that considers a sufficient number of days to be necessary during a term (typically 1 year) to represent average dietary intakes(Reference Cade, Thompson and Burley14).
In relation to the validity of SFFQ and in agreement with other authors, we also found that food group intakes assessed by SFFQ were, in general, higher than those estimated by the 9-day 24HR(Reference Zhuang, Yuan and Lin44,Reference Jackson, Walker and Younger46,Reference Deschamps, De Lauzon-Guillain and Lafay47) . A possible explanation for this could be that participants might overestimate the consumption of ingredients of mixed dishes or meals and they might consider these quantities as a full portion even though they are smaller(Reference Zhuang, Yuan and Lin44). Foods with the highest mean differences between SFFQ and 9-day 24HR (in favour of SFFQ) were light drinks, fat, and broth and soups. In case of drinks (light drinks and broth and soups), the overestimation could be because the consumption of these products is not frequent, which means estimations are less accurate(Reference Nelson, Atkinson and Darbyshire48). In relation to fat intake, it should be noted that for the SFFQ, in all cases we used the median of quantity consumed by the Basque Country population(22), and this quantity was higher than those registered by the 24HR. It should be noted that individual fat intake is difficult to estimate because it is usually added in the cooking of main courses for the whole family(Reference Pisani, Faggiano and Krogh8).
The correlations between SFFQ and 9-day 24HR were significant for more than half of the studied food groups, with the lowest correlations being for fat and spicy foods and the highest correlations being for alcohol drinks and other foods. The low correlation for spicy foods could be related to the low accuracy of estimation of foods consumed in small quantities(Reference Nelson, Atkinson and Darbyshire48). With regard to fat, as mentioned above, we used the median of quantity consumed by the study population in the FFQ. In this sense, the data recorded for fat by 9-day 24HR showed high intra- and inter-individual variability, and this is why the de-attenuated correlation coefficient was higher than the crude correlation for this food. In addition, in some food groups, such as meat or fish, the correlation coefficients were <0·4, and this might reflect difficulties in recognising and classifying these categories(Reference Erkkola, Karppinen and Javanainen49) even though there were some examples of each item in our questionnaire. On the other hand, the high correlation found for alcohol drinks and other foods could be due to using beverage-specific questions in the SFFQ(Reference Ekholm, Strandberg-Larsen and Grønbæk50) and may indicate that the intake of these products is associated with particular situations, such as weekends; thus, it may be easier for participants to remember the quantity more precisely. Relative to de-attenuated correlations, they were in almost all cases similar to adjusted correlations, and as Fernández-Ballart et al. (Reference Fernández-Ballart, Piñol and Zazpe40) described, this small difference could be due to relatively low within-individual variation with regard to the between-individual variations and/or because of the large number of days recorded (9 d).
In general, correlations between SFFQ2 and 9-day 24HR were slightly higher than those found between SFFQ1 and 9-day 24HR. This has also been reported in other studies and could be the result of changes that occur throughout the duration of participation in the study(Reference Villegas, Yang and Liu45) or because of a learning effect(Reference Zhuang, Yuan and Lin44) by which participants were able to observe their diets more conscientiously during the second SFFQ(Reference Hjartaker, Andersen and Lund51).
The results of both Bland–Altman plots and classification by quartiles confirmed that the agreement between SFFQ2 and 9-day 24HR was fairly good, where the percentage of participants being out of the limits of agreement was <10 %, and the mean percentage of participants’ food intakes being classified into the same or adjacent quartiles was 75·2 %. Although meat and meat products showed worse agreement when the intake of these foods was higher, other authors have also observed this phenomenon and considered it a measurement error proportional to mean intake(Reference Fernández-Ballart, Piñol and Zazpe40).
With regard to the reproducibility of the adapted SFFQ, the intakes of more than half of food groups were higher in SFFQ2 than in SFFQ1. The same result occurred in the Shanghai Women’s Health Study(Reference Shu, Yang and Jin18) and in the Tehran Lipid and Glucose Study(Reference Esfahani, Asghari and Mirmiran52). This could be because the participants, after the first SFFQ1 and ninth 24HR, became more aware of their intakes; however, other researchers have suggested a contrary effect, that is, intake was lower in the second FFQ than in the first(Reference Zhuang, Yuan and Lin44,Reference Xia, Sun and Zhang53) . Moreover, it should be noted that, in our case, the interval between both FFQ was 1 year; thus, the differences observed could have been due to changes in participants’ diets and variations in their responses(Reference Deschamps, De Lauzon-Guillain and Lafay47).
Crude and age- and sex-adjusted correlation coefficients for reproducibility in the current study were similar to those reported by Ogawa et al. (Reference Ogawa, Tsubono and Nishino54) and higher than those reported by others(Reference Zhuang, Yuan and Lin44,Reference Vioque, Navarrete-Muñoz and Giménez-Monzó55) . Regarding the significant level of correlations between SFFQ, we found that all the coefficients were significant except for fat in crude correlations, and for fatty fish and spicy foods in adjusted correlations. These results are similar to previously reported data(Reference Hebden, Kostan and O’Leary56). In addition, the results of classification by quartiles confirmed that the agreement between both SFFQ was good, as the mean percentage of food intakes that was classified into the same or adjacent quartiles was 82·6 %, similar to other studies(Reference Zhuang, Yuan and Lin44,Reference Villegas, Yang and Liu45) . Finally, associated variables such as education level, having children, weight status or lifestyle did not seem to influence the validity and reproducibility of SFFQ. In any case, a larger sample size would be needed to confirm the results observed in the current study. Although limited data are available regarding the influence of variables on the validity and reproducibility of FFQ, other authors(Reference Hansson, Galanti and Bergström57) also could not find a relationship between education level and reproducibility of an FFQ. To our knowledge, no studies reported to date have evaluated the possible association between education level and validity of an FFQ.
Strengths and limitations
A possible limitation of the current study, as has been reported for other validation and reproducibility studies, is that these results may not be generalisable to other populations(Reference Plummer and Kaaks58). Study strengths include that the results are discussed in detail, which show the challenges associated with the registration of different foods. Food items were not regrouped because single items are usually better than grouping, since similar foods are easy to be differentiated and grouped items could be confusing to participants(Reference Cade, Thompson and Burley14). In addition, this SFFQ can be very useful to estimate the intake of some specific foods, such as different alcoholic beverages (with different alcoholic graduation and bioactive compounds), as well as foods that are usually consumed in small quantities (e.g. spicy foods). In any case, in view of the results of the present research and in order to improve the accuracy of self-reported data, the final version of this SFFQ included, in addition to quantities of food servings (grams or millilitres)(Reference Carbajal, Sánchez-Muniz, García-Arias and García-Fernández23), its equivalent in household measures. Other strengths of the current study are the design and the fact that we analysed the independent effect of associated variables on reproducibility and validity.
Conclusions
The adapted SFFQ presents good reproducibility and validity for measuring most food groups in a population resident in the Basque Country, and it did not seem to be influenced by associated variables such as education level or weight status. However, in future studies, the intakes of food groups estimated by this SFFQ that showed a low validity should be used and interpreted with caution.
Acknowledgements
Acknowledgements: The authors would like to thank all the participants of the current study. Financial support: This work was supported by a grant from the EHU12/24 project of the University of the Basque Country (UPV/EHU), a pre-doctoral scholarship from the Basque Language Vice-chancellor of the UPV/EHU, and a pre-doctoral grant from the Basque Government (PRE_2015_2_0084). Neither the UPV/EHU nor the Basque Government had any role in the design, analysis or writing of this article. Conflict of interest: None. Authorship: M. A.-I. contributed to the conception and design of the research; I.A.-L., M. A.-I. and N. T.-A acquired and analysed the data, interpreted the results, drafted the manuscript, revised the paper and approved the final version of the manuscript. Ethics of human subject participation: The current study was conducted according to the guidelines laid down in the Declaration of Helsinki, and all procedures involving research study participants were approved by the Ethical Committee on Human Research of the UPV/EHU (CEISH/181/2012/ARROYO IZAGA). Written informed consent was obtained from all subjects.
Supplementary material
To view supplementary material for this article, please visit https://doi.org/10.1017/S1368980020001822


