


The pre-pregnancy weight status of underweight (UW), overweight (OW) and obese (OB) at the population level is known to affect the nutritional status during pregnancy. While the prevalence of an UW status has become stable in affluent countries(1), the prevalence of OW/OB statuses has sharply increased across the world(Reference Nurwanti, Uddin and Chang2). It is estimated that in 2025, more than 21 % of women will be OB and 9 % of women will be severely OB(1).
Anaemia and iron deficiency (ID) anaemia (IDA) are among the most common forms of nutritional disorders affecting 56 million pregnant women worldwide(3). During pregnancy, the demand for erythropoiesis-related nutrients is increased to support fetoplacental development(4,Reference Fisher and Nemeth5) . The pre-pregnancy BMI (pBMI) is an indicator of the nutritional status of women before entering pregnancy. There is growing evidence suggesting that pre-pregnancy OW/OB is associated with impaired Fe(Reference Garcia-Valdes, Campoy and Hayes6–Reference Scholing, Olthof and Jonker10), folate(Reference Scholing, Olthof and Jonker10–Reference Bjørke-Monsen, Ulvik and Nilsen12) and vitamin B12 (Reference Scholing, Olthof and Jonker10,Reference Bjørke-Monsen, Ulvik and Nilsen12) statuses during pregnancy. The possible link between obesity and the Fe status may be attributable to adiposity-mediated low-grade inflammation that upregulates hepcidin synthesis resulting in a decreased Fe absorption rate and lower systemically bioavailable Fe(Reference Sangkhae and Nemeth13). However, other studies showed that pre-pregnancy UW women were more susceptible to maternal IDA or anaemia, and OW/OB women the least susceptible(Reference Tan, Qi and He14,Reference Uno, Takemi and Hayashi15) , or that there was no association between obesity and the maternal Fe status(Reference Cao, Pressman and Cooper16).
Dietary factors are known to influence the relationship between the pBMI and gestational IDA. In recent years, several studies examined the risk between pBMI/BMI and erythropoiesis-related nutritional deficiencies(Reference Garcia-Valdes, Campoy and Hayes6–Reference Bjørke-Monsen, Ulvik and Nilsen12,Reference Tan, Qi and He14–Reference Sumarmi, Puspitasari and Handajani19) ; however, available data are inconclusive. It is possible that one’s socio-economic status may influence the relationship between pBMI and the maternal nutritional status. In developed countries, the risks of ID and IDA seem to increase among OB pregnant women(Reference Garcia-Valdes, Campoy and Hayes6,Reference Scholing, Olthof and Jonker10) , but in developing countries, the risk of IDA seems to be higher among UW women(Reference Tan, Qi and He14,Reference Sumarmi, Puspitasari and Handajani19) . Since a pre-pregnancy UW status indicates that a women is malnourished before entering pregnancy, insufficient intake of calories, proteins and micronutrients as well as a lack of stored nutrients (e.g. Fe) in the body are thought to be responsible for gestational IDA among UW women with a low socio-economic status(Reference Tan, Qi and He14,Reference Sumarmi, Puspitasari and Handajani19,Reference Thankachan, Muthayya and Walczyk20) . However, in affluent countries like Taiwan, some pre-pregnancy UW women are well educated with a good income and dietary habits, but they tend to control their body weight in order to maintain a slim figure(Reference Noh, Kwon and Yang21). In contrast, obesity is frequently associated with poor dietary habits and a preference for eating high-energy (e.g. fat-containing) but low-micronutrient food (e.g. vitamins and trace elements)(Reference Shin, Lee and Song11,Reference Astrup and Bügel22) .
Currently, how the pre-pregnancy weight status affects erythropoiesis during pregnancy is less clear at a population scale. By studying nationwide representative population data in Taiwan, the broad aim of this study was to investigate associations between the pBMI and erythropoiesis-related nutritional deficiencies.
Methods
Study design and population
The Nationwide Nutrition and Health Survey in pregnant women was conducted in Taiwan in 2017–2019. Stratified probability sampling was used in this study according to data of Urban and Regional Development statistics and sampling design of this nutrition and health survey in Taiwan(Reference Chang, Chen and Owaga23). The sample population was stratified into northern, central, southern and eastern regions. For each stratum, medical facilities were divided into large and small medical facilities according to the number of annual prenatal examinations. At least two medical facilities were chosen from each stratum, and pregnant women were recruited when they visited one of the prenatal care centres. The inclusion criteria were (1) ≥15 years of age, (2) Taiwanese residency and able to speak fluent Chinese or Taiwanese, (3) had received the maternal health checkout booklet and (4) provided signed written informed consent or a copy of signed written informed consent of a parent or legal guardian for those who were ≤19 years of age. The study protocol was approved by the Taipei Medical University Institutional Review Board (TMU-JIRB N201707039). In this study, we excluded 46 respondents who were ≤19 years (n 6), with multiple pregnancies (n 33), and with missing data on body weight or height (n 7). Pregnant women who were underage (<19 years) and with multiple pregnancies were excluded since these conditions may influence the nutritional status or nutritional needs of the women(Reference Gutierrez and King24). In total, 1456 respondents were included in the analysis.
Data collection
Trimester was defined according to the guideline of Ministry of Health and Welfare, Taiwan: (1) the first trimester (T) 1 was defined as the first 17 weeks of pregnancy following the last normal menstrual period, (2) T2 as weeks 18 to 28 and (3) T3 as weeks 29 to 40. Blood sample, self-reported questionnaire and dietary intake data were collected during a prenatal care visit. A self-reported questionnaire was collected which included data on: (1) personal information (e.g. age, trimester, anthropometric data, residence, educational level, household income and parity); (2) health history before and during pregnancy; and (3) use of prenatal dietary supplementation (e.g. multivitamins, vitamin B12, folate and Fe). Anthropometric data were obtained from a self-reported questionnaire in which woman reported their pre-pregnancy body height (pBH) and body weight (pBW). Self-reported height and weight are a valid measurement of the actual pBMI(Reference Shin, Chung and Weatherspoon25). The pBMI was calculated using the formula of pBW divided by pBH squared (kg/m2). The nutritional status of the pregnant women was defined based on the pBMI according to the WHO for the Asian-Pacific region’s recommendation and the Ministry of Health and Welfare, Taiwan: UW is defined as a pBMI of <18·5 kg/m2, normal weight (NW) as a pBMI of 18·5–23·9 kg/m2, OW as a pBMI of 24–26·9 kg/m2 and OB as a pBMI of ≥27·0 kg/m2(26,Reference Yeh, Chang and Pan27) . Dietary intake was assessed by a face-to-face interview using a 24-h dietary recall by an experienced dietitian. Detailed dietary data, such as meal type, mealtime, food sources (e.g. home-made food or eating out), food items and cooking methods, were recorded to help estimate nutrient intake levels. Dietary intake data were calculated based on the Taiwan Food Nutrient Database using the online software Cofit Pro (Cofit Healthcare, Taipei, Taiwan). Dietary recommended intake (DRI) levels of pregnant women were calculated according to guidelines of the Ministry of Health and Welfare, Taiwan(28).
Blood biochemical analyses
Blood samples were drawn from peripheral venous blood vessels during a prenatal care visit (first trimester: 13 or 17 weeks, second trimester: 22 or 26 weeks and third trimester: >29 weeks). Whole-blood samples were used to measure the Hb concentration with a hematology analyser (Sysmex). Serum was used to analyse Fe biomarkers (e.g. serum iron, transferrin saturation (TS), ferritin and hepcidin), folate and vitamin B12. Serum iron was analysed by a ferrozine-based colorimetric assay by a Beckman Coulter Unicel DxC 800 (Beckman Coulter, Brea). Serum ferritin was analysed by a chemiluminescence immunoassay by the Beckman Coulter Unicel DxC 800 (Beckman Coulter). The total iron-binding capacity (TIBC) was assessed by an immunoturbidimetric method by the Beckman Coulter Unicel DxC 800, and TS was calculated as serum iron/TIBC × 100. Serum folate and vitamin B12 were analysed by a RIA (MP, Biomedicals). Serum hepcidin levels were analysed by a human hepcidin DuoSet ELISA (R&D Systems), according to the manufacturer’s instructions.
Definitions of nutritional deficiencies related to erythropoiesis
Erythropoiesis-related nutritional deficiencies include anaemia, IDA, ID, folate depletion and a vitamin B12 deficiency. According to the Central Disease Center (CDC), Taiwan, anaemia in pregnancy is defined as an Hb level of <11 g/dl in the first and third trimesters, and as <10·5 g/dl in the second trimester(29). According to the WHO, ID is defined as TS of <16 %(30) and serum ferritin of <15 ng/ml(Reference Breymann31). IDA is defined as: (1) an Hb level of <11 g/dl in the first and third trimesters, and of <10·5 g/dl in the second trimester; (2) TS of <16 %; and (3) serum ferritin of <15 ng/ml. Serum ferritin is a commonly used biomarker for assessing the Fe status of healthy individuals. However, ferritin is also regarded as an acute-phase reactant, as it is sensitive to inflammation, and the inclusion of serum ferritin may cause a ‘false-negative’ diagnosis of ID and IDA among individuals who are OW or OB(Reference Zhao, Zhang and Shen32). Therefore, we also defined ID and IDA in the absence of serum ferritin to prevent ‘false-negative’ diagnoses among women with chronic inflammation. IDA1 was defined based on TS of <16 % and an Hb level of <11 g/dl in the first and third trimesters, and <10·5 g/dl in the second trimester; and ID1 was defined based on TS of <16 %, without inclusion of serum ferritin(Reference Daru, Colman and Stanworth33). Folate depletion was defined as serum folate of <6 ng/ml(Reference Chen, Pan and Lin34). A vitamin B12 deficiency was diagnosed when the serum vitamin B12 concentration was <203 pg/ml(Reference de Benoist35). A severe nutritional deficiency was defined as anaemia or IDA. A mild nutritional deficiency related to erythropoiesis was defined by the presence of ID, folate depletion or a vitamin B12 deficiency.
Data analysis
Data were analysed using SPSS vers. 21 (IBM) and GraphPad Prism 5 (GraphPad Prism 5, GraphPad Software). A normal distribution was determined depending on the histograms and absolute values of skewness (≤2) and/or absolute kurtosis (≤7) without considering Z-values(Reference Kim36). Continuous variables are presented as the mean and standard deviation and categorical variables as number (percentage). Variables with a skewed distribution were reported as the median (interquartile range). A P for trend was determined by a general linear trend model. For continuous variables, the Mann–Whitney U test was performed to compare the difference between two groups. For categorical variables, a chi-squared test was performed for two-group comparisons. A multivariate logistic regression was performed to measure the OR of severe and mild nutritional deficiencies related to erythropoiesis using the pBMI as a factor. The significance level for the P for trend and P value was defined as <0·05.
Results
General characteristics of study participants according to the pBMI
Table 1 shows baseline characteristics of study participants according to the pBMI. Among these pregnant women, 9·6 % were UW and 29·2 % were either OW (15·8 %) or OB (13·4 %). When compared to OB pregnant women, UW pregnant women were younger and had the highest primiparous rate and highest levels of circulating folate, vitamin B12, and TS %, but the lowest serum ferritin and hepcidin levels (Table 1).
Table 1 Maternal baseline characteristics stratified by the pre-pregnancy BMI (pBMI) (n 1456)

UW, underweight; NW, normal weight; OW, overweight; OB, obese; TS, transferrin saturation; SF, serum ferritin; ID, iron deficiency; IDA, iron deficiency anaemia; Vit, vitamin; 1, no serum ferritin.
Continuous data are presented as the mean ± sd; categorical data are presented as the number (percentage of the same group).
UW, pBMI of <18·5 kg/m2; NW, pBMI of 18·5–23·9 kg/m2; OW, pBMI of 24–26·9 kg/m2; OB, pBMI of ≥27 kg/m2.
* P for trend was analysed by a general linear model/one-way ANOVA for continuous variables and chi-squared test for categorical variables (P < 0·05).
† P value (UW compared to OB).
‡ P value (OW compared to OB).
§ P value (NW compared to OB).
‖ Median (interquartile range) is given because of the skewed distribution of the variable.
The P value was analysed by the Mann–Whitney U test for continuous variables and chi-squared test for categorical variables (P < 0·05).
Prevalence rates of nutritional deficiencies related to erythropoiesis
We next investigated prevalence rates of erythropoiesis-related nutritional deficiencies according to the pBMI. In general, U-shaped associations between the pBMI and severe nutritional deficiencies such as anaemia (Fig. 1(a)) and IDA1 (Fig. 1(b)) were found (Table 1). In contrast, significant positive linear trends were found between the pBMI and the prevalence of ID1 (Fig. 1(c)), folate depletion (Fig. 1(d)) and a vitamin B12 deficiency (Fig. 1(e)). Notably, the linear trend association between the pBMI and rates of ID1 were only observed when using TS of <16 % alone and not the standard criteria of serum ferritin of <15 ng/ml plus TS of <16 % (Table 1). Figure 1(f) shows that in women with a normal Fe status, serum hepcidin levels decreased across the trimesters, except in OB women who had significantly higher hepcidin levels in the third trimester compared to UW/NW/OW subjects. In women with ID or IDA, although serum hepcidin decreased sharply across the trimesters in all groups, serum hepcidin levels of OB pregnant women remained significantly higher across the three trimesters compared to the other weight categories (Fig. 1(g)). We next evaluated relationships between the pBMI and mild nutritional deficiencies related to erythropoiesis. Figure 2 shows that UW pregnant women had the highest rate of a normal nutritional status compared to OB women. In contrast, OB pregnant women had the highest rate of single, double and triple nutritional deficiencies related to erythropoiesis (Fig. 2).
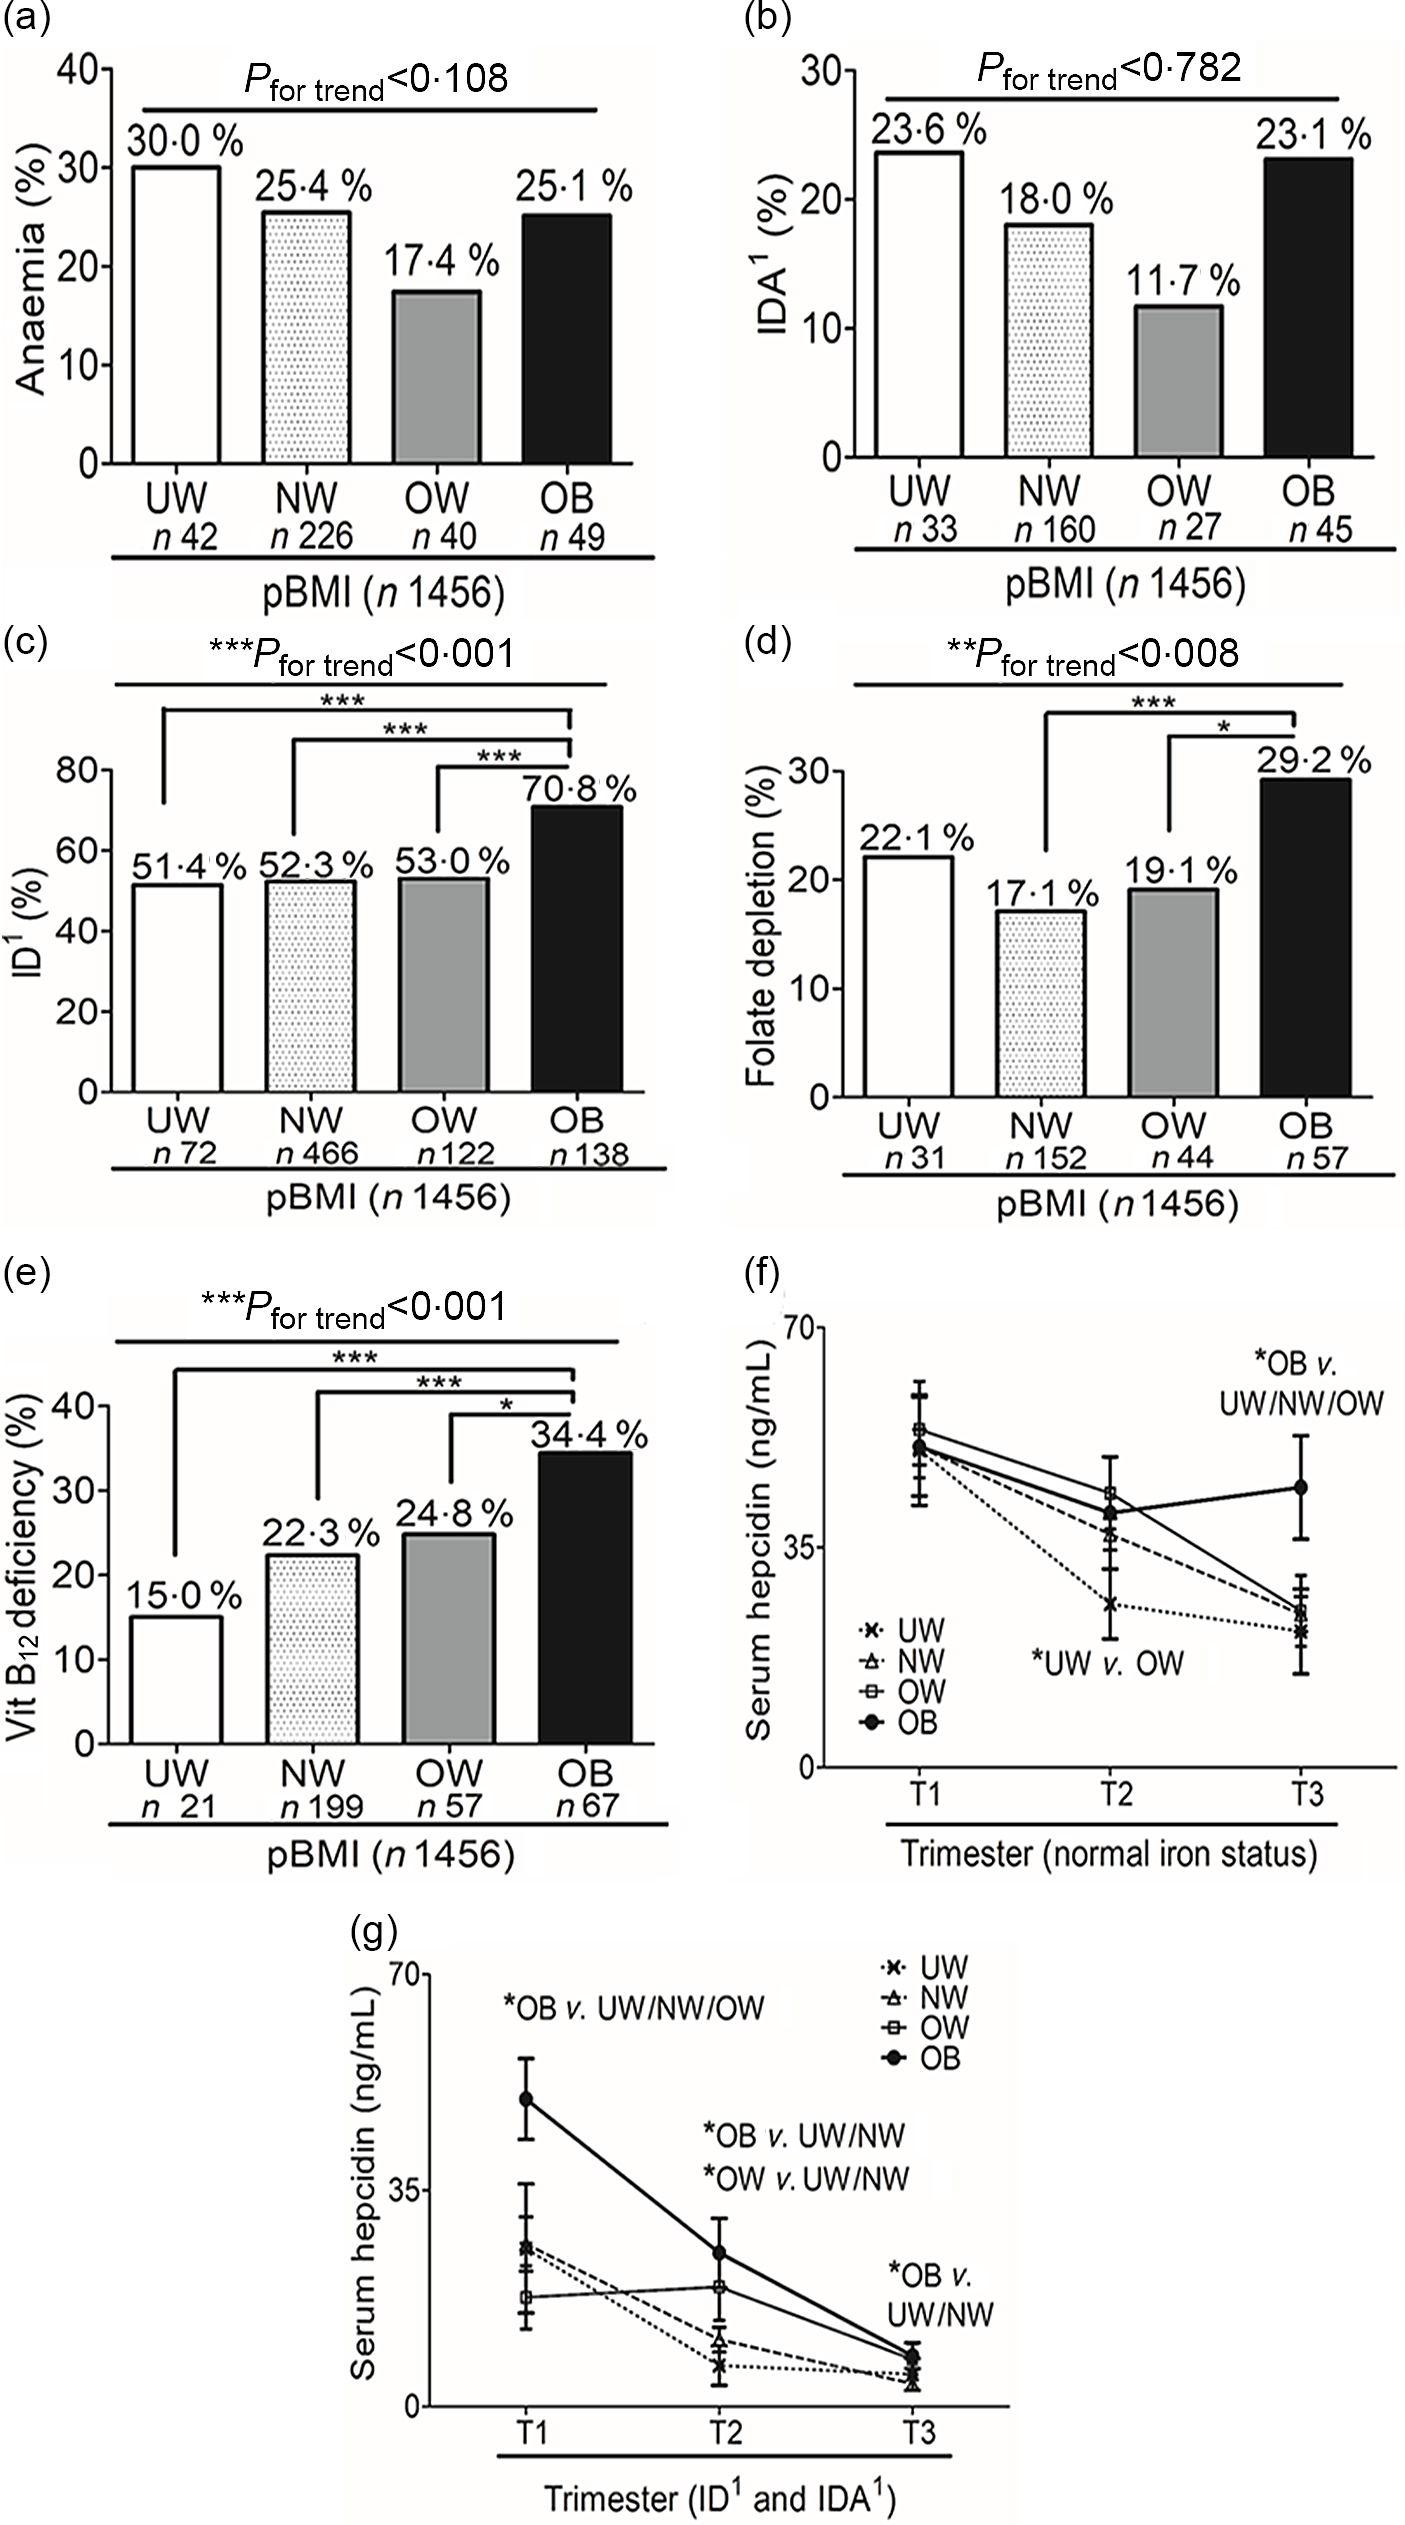
Fig. 1 Prevalences of nutritional deficiencies related to erythropoiesis according to the pre-pregnancy BMI. (a) Anaemia; (b) iron deficiency (ID) anaemia (IDA); (c) ID; (d) folate depletion and (e) vitamin (Vit) B12 deficiency for underweight (UW), normal weight (NW), overweight (OW) and obese (OB) women

Fig. 2 Prevalences of mild nutritional deficiencies related to erythropoiesis according to the pre-pregnancy BMI. No nutritional deficiency, single nutritional deficiency, two nutritional deficiencies and three nutritional deficiencies for underweight (UW), normal weight (NW), overweight (OW) and obese (OB) women
Socio-economic factors
Socio-demographic characteristics are shown in Table 2. Compared to other weight groups, UW pregnant women had the highest proportions of living in the northern area (39·3 %) and had the highest (>3333 USD/month) and the lowest (<1000 USD/month) household income (all P < 0·05) (Table 2). In contrast, OB pregnant women had the highest proportions of living in the eastern area (32·3 %) and less than a college degree and had the highest household income (all P < 0·05) (Table 2).
Table 2 Socio-demographic characteristics stratified by the pre-pregnancy BMI (pBMI) (n 1456)

UW, underweight; NW, normal weight; OW, overweight; OB, obese.
Continuous data are presented as the mean ± sd; categorical data are presented as the number (percentage of the same group).
UW, pBMI of <18·5 kg/m2; NW, pBMI of 18·5–23·9 kg/m2; OW, pBMI of 24–26·9 kg/m2; OB, pBMI OF ≥ 27 kg/m2.
* P value was analysed by chi-squared for categorical variables (P < 0·05).
† P value (UW compared to OB).
‡ P value (NW compared to OB).
§ P value (OW compared to OB).
In 2019, the average exchange rate was US$1.00≈New Taiwan (NT)$30.
Daily nutrient intake
Table 3 shows significant inverse trends between the pBMI and nutrient intake levels (total calories, carbohydrates, protein, dietary fibre, Fe and folate) but positive trends of the pBMI with percent fat and protein intake below the DRI. Compared to UW women, OB pregnant women had significantly lower intake levels of total calories, carbohydrates, protein, percent carbohydrates, Fe, fibre and folate but a higher rate of percent fat and less than the recommended intake for protein (all P < 0·05, except Fe at P = 0·063) (Table 3). There were no differences in the reported use of prenatal dietary supplements across the pBMI categories. However, compared to UW women, the OB group tended to have the lowest rates of using multivitamins/minerals (65·5 % v. 57·1 %) and Fe supplements (11·0 % v. 8·4 %).
Table 3 Maternal dietary intake (unadjusted by calories) stratified by the pre-pregnancy BMI (pBMI) (n 1456)

UW, underweight; NW, normal weight; OW, overweight; OB, obese; CHO, carbohydrates; DRI, dietary recommended intake.
Continuous data are presented as the mean ± sd; categorical data are presented as number (percentage of same group).
UW, pBMI of <18·5 kg/m2; NW, pBMI of 18·5–23·9 kg/m2; OW, pBMI 24–26·9 of kg/m2; OB, pBMI of ≥27 kg/m2.
* P for trend was analysed by a general linear model/one-way ANOVA for continuous variables, and the P value was analysed by chi-squared for categorical variables (P < 0·05).
† P value (UW compared to OB).
‡ P value (NW compared to OB).
§ P value (OW compared to OB).
‖ Median (interquartile range) is given because of the skewed distribution of the variable.
The P value was analysed by the Mann–Whitney U test for continuous variables and chi-squared test for categorical variables (P < 0·05).
OR for severe and mild nutritional deficiencies related to erythropoiesis
The multivariate linear regression analysis showed that compared to NW subjects, OW women had 39 % and 42 % decreased odds of having severe nutritional deficiencies such as anaemia and IDA1, respectively, after adjusting for covariates (age, trimester, parity, education, household income, use of total supplements and % protein intake) (Fig. 3). While there was no significant difference between NW and OW women, OB pregnant women respectively had (2·5; 95 % CI (1·6, 3·9)), (2·6; 95 % CI (1·4, 4·8)) and 3·4-fold (95 % CI (1·4, 8·1)) higher risks of developing single, double and triple mild nutritional deficiencies related to erythropoiesis compared to NW women (Fig. 4). In general, UW pregnant women had the lowest risk of developing mild nutritional deficiencies related to erythropoiesis, but this did not reach statistical significance (Fig. 4).

Fig. 3 Adjusted OR and 95 % CI of severe nutritional deficiencies using the pre-pregnancy BMI as a factor. (a) Anaemia; and (b) iron deficiency anaemia (IDA1). OR were adjusted for age, trimester, parity, educational level, income, total supplement and % dietary protein intake

Fig. 4 Adjusted OR and 95 % CI of mild nutritional deficiencies using the pre-pregnancy BMI (pBMI) as a factor. (a) Single nutrition deficiency; (b) two nutrition deficiencies and (c) three nutrition deficiencies. OR were adjusted for age, trimester, parity, educational level, income, total supplement and % dietary protein intake
Discussion
To our best knowledge, this is the first study to investigate the association between pre-pregnancy weight status and erythropoiesis-related nutritional deficiencies in a population-based format. The present study showed that: (1) UW and OB pregnant women were most likely to develop severe nutritional deficiencies (anaemia and IDA) and OW women were the least likely; (2) OB pregnant women with ID/IDA had high serum hepcidin levels across the three trimesters, indicating interference by inflammation of gestational Fe metabolism and a possible risk of functional ID/IDA; (3) OB pregnant women had the poorest dietary intake and the highest risk for mild nutritional deficiencies; and (4) although UW pregnant women had the best dietary intake and lowest rate of mild nutritional deficiencies, they had the same risk for gestational anaemia/IDA as did OB pregnant women
The present study found that 65·5 % of gestational anaemia was caused by an ID. This finding is similar to that of a meta-analysis study which analysed anaemia epidemiology from 18 countries during 1990 to 2010, and those authors reported that in several high-risk anaemia regions, including Central Asia (64·7 %), South Asia (54·8 %) and Andean Latin America (62·3 %), a very high proportion of the anaemia burden was due to ID(Reference Kassebaum, Jasrasaria and Naghavi37). Our study showed that the prevalence of gestational IDA was 18·2 %, which is similar to that in China (14 %) but lower than that in South Korea (26 %)(Reference Lee, Lee and Ahn38,Reference He, Sun and Tan39) .
The current study found that UW and OB pregnant women had the highest rate of severe nutritional deficiencies and OW the lowest. Cao and colleagues investigated impacts of the pBMI and gestational weight gain on the neonatal and maternal Fe statuses in 230 pregnant adolescents, and those authors reported that UW (22·2 %) and OB (9·5 %) pregnant adolescents had higher prevalence rates of anaemia in mid-gestation and OW the lowest (0 %). However, those authors observed no negative impacts of the pBMI or gestational weight on the maternal or neonatal Fe status(Reference Cao, Pressman and Cooper16). Our study also found that OB pregnant women had the highest rates of ID1, folate depletion and vitamin B12 deficiency, but to our surprise, UW women had the lowest rates of ID1 and vitamin B12 deficiency. Both folate and vitamin B12 are essential vitamins required for successful erythropoiesis, and an insufficient supply of those nutrients may lead to gestational anaemia. Schooling et al. also observed that compared to NW pregnant women, OB women had a 3·26-fold (95 % CI 2·09, 5·08) higher risk of ID, a 2·03-fold (95 % CI 1·35, 3·06) higher risk of folate deficiency and a 2·05-fold (95 % CI 1·41, 2·99) higher risk of a vitamin B12 deficiency in early-stage pregnancy(Reference Scholing, Olthof and Jonker10). A study in Amsterdam also observed inverse relationships of the pBMI with serum iron, folate and vitamin B12 in pregnant women(Reference Scholing, Olthof and Jonker10). To our surprise, UW pregnant women seemed to have a better status of erythropoiesis-related nutrients, as they had the highest rate of a normal nutrition status related to erythropoiesis compared to the other weight categories. These results were unexpected and interesting, as these findings contradict a study from a developing country which showed that UW women were seven times more likely to develop ID compared to non-UW women(Reference Sumarmi, Puspitasari and Handajani19).
The pBMI may reflect a woman’s socio-economic status, food preferences and dietary habits as well as the degree of chronic inflammation. Those factors may affect the gestational nutritional status through influencing the storage of nutrients (e.g. Fe and vitamin B12) in the body, nutrient intake and metabolism. It is well known that women with a higher socio-economic status are more likely to better control their body weight(Reference Choi, Cho and Kang40). People in East Asian countries, like Taiwan, also admire slim figures, as a thin figure in a woman is considered attractive(Reference Noh, Kwon and Yang21). Our findings were in agreement with 795 US pregnant women from the National Health and Nutrition Examination Survey, 2003–2012, which showed that UW women and women with a normal pBMI had better dietary quality as measured by the HEI-2010 compared to those with an OB pBMI(Reference Shin, Lee and Song11). During pregnancy, mothers are advised to increase their DRI of Fe (trimesters 1 and 2: 10–15 mg/d; trimester 3: 40–45 mg/d), folate (600 µg/d) and vitamin B12 (2·6 µg/d) to support fetal growth and development. However, the current study found that most of the pregnant women did not reach these DRI guidelines, with OB women having the highest rates of deficiencies of DRI intake for protein and Fe. It is possible that OB women try to control their dietary intake to prevent gestational weight gain but still maintain a preference for fatty foods and poor dietary habits. Our previous population-based study found that OW/OB women who tended to consume a high-fat, low-carbohydrate diet were 10·1 (1·26–80·8) times more likely to develop IDA(Reference Chang, Chen and Owaga23).
Garcia-Valdes et al. investigated the relationship of the pBMI with hepcidin levels in 158 pregnant women (NW: 90; OW: 37 and OB: 31), and those authors found that compared to NW women, OB pregnant women had higher hepcidin levels in the first and third trimesters, and hepcidin levels were inversely correlated with maternal Fe levels(Reference Garcia-Valdes, Campoy and Hayes6,Reference Jones, Zhao and Jiang8) . Bah et al. reported a decline in the hepcidin concentration at 20 weeks of gestation in 395 Gambian pregnant women(Reference Bah, Pasricha and Jallow41). The current study also observed a significant positive trend between the pBMI and serum hepcidin levels. However, a detailed analysis found that in women with ID or IDA, serum hepcidin levels were the highest among OB pregnant women. Our results also showed that OB pregnant women had the highest serum ferritin levels. Serum ferritin is also sensitive to the presence of inflammation and elevated serum ferritin may cause a ‘false-negative’ diagnosis of ID and IDA among OB pregnant women(Reference Zhao, Zhang and Shen32). Based on this evidence, it is tempting to hypothesise that OB pregnant women may suffer from functional ID/IDA, and not absolute ID/IDA as do UW women, due to the presence of adiposity-related inflammation that upregulates ferritin and hepcidin levels(Reference Teng, Tseng and Aulia42). Decreased hepcidin levels can increase the Fe absorption rate, facilitate the delivery of bioavailable Fe to the fetus and prevent gestational ID/IDA(Reference Fisher and Nemeth5).
Our study had several strengths and limitations. First, we included a sufficient number of pregnant participants with a nationwide representative population in Taiwan. Second, we provided population-scale data of serum hepcidin, which may help clarify the role of hepcidin in functional ID/IDA among OB pregnant women. Third, we included various parameters which allowed us to adjust for a large number of potentially influential variables that are known to affect gestational IDA, such as age, trimester, parity, educational level, household income, use of prenatal supplements and daily nutrient intake data. There are also several limitations to this study which need to be taken into account when interpreting the results. First, this study was a cross-sectional study and thus cannot explain causality between the pBMI and gestational IDA. Second, dietary intake data were obtained based on 1 d of a 24-h recall which might be incapable of obtaining reliable daily intake data due to an insufficient time period of the survey. The literature shows that 3–6 d of dietary recall is a minimum time period to obtain valid macronutrient and micronutrient data among pregnant women(Reference Persson, Winkvist and Ninuk43). Persson and colleagues showed that inter-individual variability can be minimised by increasing the sample size, but intra-individual variability will persist even with a larger sample size(Reference Persson, Winkvist and Ninuk43). Due to wide variations in geographical locations and limitations in manpower and funding, the current NAHSIT survey for dietary intake was limited to 24 h. Third, under-reporting of energy intake among OW/OB women during pregnancy may act as a potential bias of nutrient–disease relationships. Moran et al. reported that under-reporting of energy intake was present in over a third of OW and OB pregnant women, and the rate of under-reporting was higher in late compared to early pregnancy(Reference Moran, McNaughton and Sui44). Currently, we are unable to distinguish whether under-reporting of dietary intake reflects misreporting or true restriction of dietary intake to control gestational weight gain.
In conclusion, our study showed that women who were UW or OB before pregnancy had the highest risk of gestational anaemia and IDA; however, the aetiologies and types of ID/IDA likely differ. Understanding how socio-economic and dietary factors affect gestational IDA among women with different pBMI values may help prenatal caregivers, midwives and dietitians develop effective intervention programmes for preventing gestational IDA.
Acknowledgements
Acknowledgements: All of the authors would like to thank the Ministry of Health and Welfare of Taiwan for allowing us to retrieve data of Pregnant NAHSIT 2017-2019. Dr Jung-Su Chang was supported by grants from Taipei Medical University Hospital (109TMU-TMUH-13) and the Ministry of Science and Technology, Taiwan (MOST107-2320-B-038-010-MY3 and MOST109-2923-B-038-001-MY3. Financial support: Dr Jung-Su Chang was supported by grants from Taipei Medical University Hospital (109TMU-TMUH-13) and the Ministry of Science and Technology, Taiwan (MOST107-2320-B-038-010-MY3 and MOST109-2923-B-038-001-MY3). Conflicts of interest: The authors declare no conflicts of interest. Authorship: J.S.C., Y.L.H., C.C.C., F.F.W., J.C.C. and C.H.B. designed the search strategy and interpreted the results. N.R.M. and T.Y.H. performed the data analysis. J.S.C., N.R.M. and T.Y.H. drafted the paper and approved the submitted paper. J.S.C. performed critical revision of the manuscript for important intellectual content. Ethics of human subject participation: This study was conducted according to guidelines laid down in the Declaration of Helsinki, and all procedures involving human subjects/patients were approved by the Taipei Medical University Institutional Review Board (no. TMU-JIRB N201707039). Written informed consent was obtained from all subjects/patients.
Supplementary material
For supplementary material accompanying this paper visit https://doi.org/10.1017/S1368980021002627


